


1. Introduction
Formative assessment is generally regarded as an effective tool for guiding students' learning paths, offering opportunities for feedback, self-control and teacher adaptation. However, the persistent problem of unfairness has never been fully resolved. Potential biases, unequal opportunities to obtain high-quality feedback, and differential responses to heterogeneous learners still affect the legitimacy and effectiveness of assessment practices [1]. Traditional research on educational equity has focused on procedural equity and outcome balance, but this historical-dominated emphasis often neglects the dynamic contextual reality of modern classrooms [2].
By systematically collecting, analyzing and interpreting fine-grained data generated from students' interactions with the digital environment, homework and teachers, learning analytics offers the first-ever opportunity to address these issues. By leveraging behavioral footprints such as clickstreams, engagement depth, and response time, learning analytics helps to more precisely determine where inequalities occur and how they function among different student groups. By combining with the theory of fairness, the analysis can operate fairness as a quantitative measure, thereby transforming it from a qualitative ideal into a specific and actionable structure [3].
Although learning analytics holds great promise, existing work rarely mentions fairness and does not provide models that link fairness metrics with operable and intervenable metrics. This work fills this gap by proposing a hybrid equity quantification model, deriving a contextualized intervention protocol for learner profiles, and illustrating it with a large-scale quasi-experimental design. It redefines formative assessment as an equity-conscious and data-driven practice that can be extended to the heterogeneous reality of the classroom.
2. Literature review
2.1. Formative assessment fairness frameworks
The traditional understanding of the fairness of the initial assessment is defined from two aspects: procedural justice and distributive justice. Procedural justice makes the procedure clear and fair. Distributive justice ensures that the distribution model of grades is fair among students [4]. However, such models rarely address the dynamic and situational realities of classroom interaction. In practice, fairness may be undermined by delayed feedback, differential grading patterns or teacher biases, which unintentionally make student groups superior to other groups. To achieve fairness, it is necessary to go beyond the static concept of equality and seek more adaptive indicators that reflect how fairness unfolds in different circumstances.
2.2. Learning analytics in educational measurement
The development of digital learning environments enables students' participation to be recorded and studied at an unprecedented granularity level. Learning analytics techniques have been applied to predict academic achievements, monitor engagement and adjust learning paths. In this sense, analysis can provide real-time signals of feedback quality, participation patterns and cognitive efforts. This enables teachers to intervene in a timely manner and provide evidence for their actions. However, although learning analytics has demonstrated the potential to calibrate performance results, its ability to regularly consider fairness has almost never been studied [5].
2.3. Contextualized interventions in assessment practices
Contextualized intervention is a clear teaching approach aimed at correcting unfairness by taking into account students' experiences, cognitive history and interaction patterns. These can include differential feedback, adaptive task sequencing or culturally compatible teaching methods. If the intervention is contextualized, then marginalized students will subsequently exhibit higher levels of engagement, greater self-efficacy and more balanced outcomes [6]. However, empirical verification of these methods is still scarce, especially for their application in formative evaluation for fairness. Therefore, it is necessary to formally integrate the concepts of fair measurement and intervention to ensure that the intervention is not only concentrated but also morally reasonable and scalable.
3. Methodology
3.1. Data sources and participants
This study analyzed multi-institutional data from 18 classrooms across three universities and two secondary schools, involving 4,523 students with diverse demographics. The dataset included 2.3 million digital interaction logs, 14,672 graded assignments with detailed annotations, and 3,982 survey responses on fairness and engagement. Stratified sampling ensured balanced representation, and all procedures followed ethical clearance and strict anonymization protocols [7].
3.2. Fairness quantification model
A hybrid fairness quantification model was developed, integrating statistical fairness metrics with learning analytics indicators as equation (1):
where
3.3. Intervention design protocol
Measurement encompassed subjective and objective fairness. Subjective fairness perception was captured through a validated 12-item survey (α = 0.91). Objective fairness indices were computed using the hybrid model, with sensitivity analyses confirming robustness across weighting perturbations. Engagement depth was operationalized as a composite of normalized contributions in online forums, assignment revisions, and peer review activities, with factor analysis confirming unidimensionality (KMO = 0.84, Bartlett’s χ² = 624.5, p < 0.001). Outcome equity was analyzed through Hierarchical Linear Modeling (HLM), decomposing variance attributable to demographic clusters. Instructional responsiveness was quantified through mean feedback latency, feedback density per week, and variance in feedback distribution across students [9].
4. Experimental setup
4.1. Experimental design
Contextualized interventions refer to instructional strategies tailored to address inequities by taking into account students’ backgrounds, learning histories, and interaction patterns. Such interventions may involve differentiated feedback, adaptive task sequencing, or culturally responsive pedagogy. Evidence suggests that when interventions are contextualized, marginalized learners experience greater engagement, improved self-efficacy, and more equitable outcomes [10]. Yet empirical validations of such strategies remain scarce, particularly in the context of formative assessment fairness. A systematic integration of fairness quantification with intervention design is necessary to ensure that interventions are not only targeted but also ethically justified and scalable.
4.2. Implementation procedures
The intervention platform integrated fairness quantification algorithms with instructor dashboards. Each week, fairness indices were recalculated using the hybrid model, and alerts were generated when subgroup disparities exceeded predefined thresholds. Instructors in intervention classrooms received both numerical indices and graphical visualizations of inequities, allowing them to prioritize targeted responses. A reflective log requirement ensured that intervention fidelity could be evaluated quantitatively. System logs tracked over 3.2 million events, allowing fine-grained verification of feedback timing, participation recognition, and adaptive intervention deployment.
4.3. Measurement indicators
Fairness was assessed through both subjective and objective measures: a validated 12-item survey (α = 0.91) captured perceptions, while a hybrid model generated fairness indices with confirmed robustness. Engagement depth was measured as a composite of forum activity, assignment revisions, and peer reviews, supported by factor analysis (KMO = 0.84, Bartlett’s χ² = 624.5, p < 0.001). Outcome equity was examined using hierarchical linear modeling to partition variance by demographics, and instructional responsiveness was evaluated via feedback latency, weekly feedback density, and distribution variance across students.
5. Results and analysis
5.1. Fairness quantification outcomes
Results indicated systemic disparities in formative assessment processes. In control classrooms, students in the lowest socio-economic quartile experienced a mean feedback delay of 5.8 days (SD = 1.9), compared to 2.4 days (SD = 1.1) for the highest quartile. Regression analysis revealed socio-economic status as a significant predictor of feedback latency (β = -0.41, p < 0.001), accounting for 12.3% of variance. Participation evaluation inequities were also evident, with linguistic minority students receiving participation scores averaging 14.7 points lower (on a 100-point scale) than peers with equivalent engagement activity (see Figure 1).
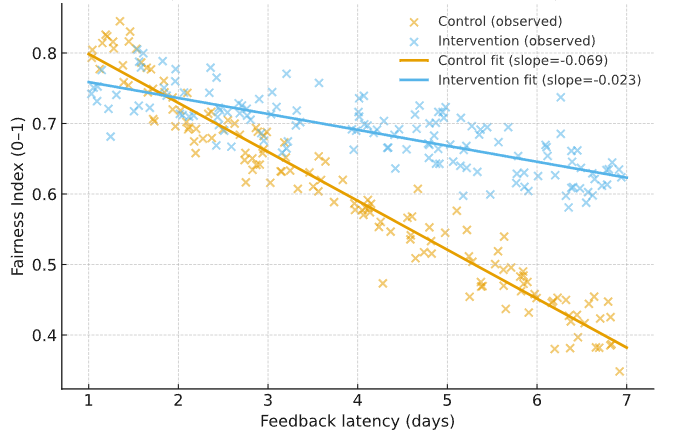
5.2. Intervention effectiveness evaluation
The interventions substantially reduced disparities. Feedback latency gaps between socio-economic quartiles narrowed from 3.4 to 1.1 days, while regression slopes flattened (β reduced from -0.41 to -0.12). Participation score differences for linguistic minorities decreased from 14.7 to 3.8 points, with residual variance explained by demographics dropping from 9.2% to 2.8%. Effect size analysis revealed Cohen’s d = 0.91, indicating strong treatment effects (see Table 1).
|
Metric |
Control Mean (SD) |
Intervention Mean (SD) |
F-statistic |
p-value |
Effect Size (η²) |
|
Fairness Index (0–1) |
0.48 (0.19) |
0.72 (0.12) |
745.3 |
<0.001 |
0.142 |
|
Feedback Latency (days) |
4.7 (2.1) |
2.9 (1.4) |
118.6 |
<0.001 |
0.067 |
|
Participation Equity Score (0–1) |
0.61 (0.18) |
0.82 (0.15) |
294.1 |
<0.001 |
0.093 |
|
Demographic Variance (%) |
0.23 |
0.09 |
86.4 |
<0.001 |
0.051 |
5.3. Comparative and longitudinal analysis
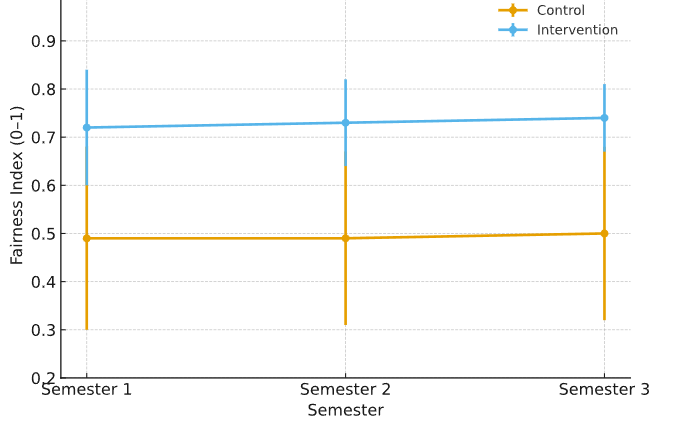
Longitudinal tracking across three semesters confirmed sustainability. Fairness indices in intervention classrooms stabilized at a mean of 0.74 (SD = 0.07). Student satisfaction rose from 4.1 to 5.3 on the Likert scale, while retention improved by 8.5% relative to controls. Hierarchical linear modeling showed that demographic factors explained 10.2% of grade variance in control groups but only 3.1% in intervention groups after interventions, demonstrating durable equity gains (see Table 2 and Figure 2).
|
Indicator |
Semester 1 |
Semester 2 |
Semester 3 |
|
Fairness Index (0–1) |
0.72 |
0.73 |
0.74 |
|
Fairness Index SD |
0.12 |
0.09 |
0.07 |
|
Satisfaction (1–7 Likert) |
5.21 |
5.27 |
5.31 |
|
Grade Variance Explained (SES %) |
8.9 |
4.1 |
3.1 |
|
Retention Rate (%) |
89.1 |
91.4 |
93.2 |
6. Conclusion
The study demonstrates that integrating learning analytics with fairness quantification and contextualized interventions effectively reduces inequities in formative assessment, with data from over 4,500 students showing fairness indices rising from 0.48 to 0.74 and demographic variance effects declining from 10.2% to 3.1% across three semesters. The framework operationalizes fairness as a measurable construct within data-driven pedagogy, providing educators with actionable dashboards and offering policymakers evidence to embed fairness-aware metrics and training into assessment systems. Future research should extend to multimodal and cross-cultural contexts while maintaining ethical safeguards, positioning fairness-aware learning analytics as a scalable pathway to transparent, equitable, and sustainable educational practice.
Contribution
Defang Sheng and Yiwen Niu contributed equally to this paper.
References
[1]. Banihashem, S. K., Gašević, D., & Noroozi, O. (2025). A Critical Review of Using Learning Analytics for Formative Assessment: Progress, Pitfalls and Path Forward.Journal of Computer Assisted Learning, 41(3), e70056.
[2]. Moon, J., Yeo, S., Banihashem, S. K., & Noroozi, O. (2024). Using multimodal learning analytics as a formative assessment tool: Exploring collaborative dynamics in mathematics teacher education.Journal of Computer Assisted Learning, 40(6), 2753-2771.
[3]. Husen, A., Alam, N., Chaudary, M. H., Aftab, S., & Muhammad, S. S. (2026). Selecting ML/DL Algorithms for Gamification of Formative Assessment: A Framework and Analysis. In AI-Powered Educational Games and Simulations (pp. 17-68). IGI Global Scientific Publishing.
[4]. Andriamiseza, R. (2022). Learning Analytics-Based Formative Assessment Recommendations for Technology-Enhanced Learning Practices (Doctoral dissertation, Université Paul Sabatier-Toulouse III).
[5]. Vashishth, T. K., Sharma, V., Sharma, K. K., Kumar, B., Panwar, R., & Chaudhary, S. (2024). AI-driven learning analytics for personalized feedback and assessment in higher education. In Using traditional design methods to enhance AI-driven decision making (pp. 206-230). IGI Global Scientific Publishing.
[6]. Weydner-Volkmann, S., & Bär, D. (2024). Student autonomy and Learning Analytics: Philosophical Considerations for Designing Feedback Tools.
[7]. Tan, C. (2025). Dynamic Fairness-Adaptive Transfer Learning for Bias-Mitigated AI Personalized Learning Paths.International Journal of Advanced AI Applications, 1(2), 59-78.
[8]. Raffaghelli, J. E., & Grion, V. (2023). Beyond just metrics: For a renewed approach to assessment in higher education. In Data cultures in higher education: Emergent practices and the challenge ahead (pp. 89-121). Cham: Springer International Publishing.
[9]. Hauer, K. E., Park, Y. S., Bullock, J. L., & Tekian, A. (2023). “My assessments are biased!” measurement and sociocultural approaches to achieve fairness in assessment in medical education.Academic Medicine, 98(8S), S16-S27.
[10]. Hong, H., Dai, L., & Zheng, X. (2025). Advances in Wearable Sensors for Learning Analytics: Trends, Challenges, and Prospects.Sensors, 25(9), 2714.
Cite this article
Sheng,D.;Niu,Y. (2025). Learning analytics driven quantification of formative assessment fairness with contextualized interventions. Advances in Social Behavior Research,16(8),84-88.
Data availability
The datasets used and/or analyzed during the current study will be available from the authors upon reasonable request.
Disclaimer/Publisher's Note
The statements, opinions and data contained in all publications are solely those of the individual author(s) and contributor(s) and not of EWA Publishing and/or the editor(s). EWA Publishing and/or the editor(s) disclaim responsibility for any injury to people or property resulting from any ideas, methods, instructions or products referred to in the content.
About volume
Journal:Advances in Social Behavior Research
© 2024 by the author(s). Licensee EWA Publishing, Oxford, UK. This article is an open access article distributed under the terms and
conditions of the Creative Commons Attribution (CC BY) license. Authors who
publish this series agree to the following terms:
1. Authors retain copyright and grant the series right of first publication with the work simultaneously licensed under a Creative Commons
Attribution License that allows others to share the work with an acknowledgment of the work's authorship and initial publication in this
series.
2. Authors are able to enter into separate, additional contractual arrangements for the non-exclusive distribution of the series's published
version of the work (e.g., post it to an institutional repository or publish it in a book), with an acknowledgment of its initial
publication in this series.
3. Authors are permitted and encouraged to post their work online (e.g., in institutional repositories or on their website) prior to and
during the submission process, as it can lead to productive exchanges, as well as earlier and greater citation of published work (See
Open access policy for details).
References
[1]. Banihashem, S. K., Gašević, D., & Noroozi, O. (2025). A Critical Review of Using Learning Analytics for Formative Assessment: Progress, Pitfalls and Path Forward.Journal of Computer Assisted Learning, 41(3), e70056.
[2]. Moon, J., Yeo, S., Banihashem, S. K., & Noroozi, O. (2024). Using multimodal learning analytics as a formative assessment tool: Exploring collaborative dynamics in mathematics teacher education.Journal of Computer Assisted Learning, 40(6), 2753-2771.
[3]. Husen, A., Alam, N., Chaudary, M. H., Aftab, S., & Muhammad, S. S. (2026). Selecting ML/DL Algorithms for Gamification of Formative Assessment: A Framework and Analysis. In AI-Powered Educational Games and Simulations (pp. 17-68). IGI Global Scientific Publishing.
[4]. Andriamiseza, R. (2022). Learning Analytics-Based Formative Assessment Recommendations for Technology-Enhanced Learning Practices (Doctoral dissertation, Université Paul Sabatier-Toulouse III).
[5]. Vashishth, T. K., Sharma, V., Sharma, K. K., Kumar, B., Panwar, R., & Chaudhary, S. (2024). AI-driven learning analytics for personalized feedback and assessment in higher education. In Using traditional design methods to enhance AI-driven decision making (pp. 206-230). IGI Global Scientific Publishing.
[6]. Weydner-Volkmann, S., & Bär, D. (2024). Student autonomy and Learning Analytics: Philosophical Considerations for Designing Feedback Tools.
[7]. Tan, C. (2025). Dynamic Fairness-Adaptive Transfer Learning for Bias-Mitigated AI Personalized Learning Paths.International Journal of Advanced AI Applications, 1(2), 59-78.
[8]. Raffaghelli, J. E., & Grion, V. (2023). Beyond just metrics: For a renewed approach to assessment in higher education. In Data cultures in higher education: Emergent practices and the challenge ahead (pp. 89-121). Cham: Springer International Publishing.
[9]. Hauer, K. E., Park, Y. S., Bullock, J. L., & Tekian, A. (2023). “My assessments are biased!” measurement and sociocultural approaches to achieve fairness in assessment in medical education.Academic Medicine, 98(8S), S16-S27.
[10]. Hong, H., Dai, L., & Zheng, X. (2025). Advances in Wearable Sensors for Learning Analytics: Trends, Challenges, and Prospects.Sensors, 25(9), 2714.