


1. INTRODUCTION
China’s A-share stock market consists of the shares of companies based in China that conduct trading in two Chinese stock exchanges, the Shenzhen Stock Exchange (SZSE) and the Shanghai Stock Exchange (SSE). The investors who want to trade in China A-shares have to focus on time selection and stock selection. Selecting the time or market timing is considered an important component of investment strategy and it is a basic trading strategy. Stock selection is a technique related to the management of a portfolio which emphasizes the selection of stock that is beneficial instead of making broad choices related to asset allocation. According to Chen & Chi (2018), timing skill is the result of intra-period trading of funds. Also, the funds which have large return gaps have higher timing skills. The factor timing skill of mutual funds is significant even when lagged turnover is controlled in the model. The size factor timing is important for managerial skills and it contributes to half of the fund alpha. Hence, it is important to analyze whether China’s stock market has the ability of stock and time selection.
Further, several factors have an impact on the returns of bonds and stocks. As per the findings of Fama & French (1992), three stock market factors which are firm size, book-to-market equity and market factor overall affect stock returns. Whereas, the two bond market factors which impact bond returns include default and maturity risks. Also, there can be lower returns to investors because of higher active management costs (Fama & French, 2010). Hence, these factors have the potential to affect time and stock selection. In this context, this research project aims to analyze the ability of China’s stock market in-stock selection and time selection along with examining the significance of different factors in the Chinese A-share stock market. Also, A-shares in China’s stock market offer attractive investment opportunities therefore it is chosen for the above analysis (Chi & Qiao, 2021). Firstly, data and methodology will be discussed followed by empirical analysis and conclusion which will summarize the findings of the project.
2. DATA AND METHODOLOGY
2.1. Data
2.1.1. Overview
Our main data set is a panel data set where it contains the monthly fund return from the SZSE and SSE, ranging from January 2003 to July 2020, together with the risk-free rate collected from WIND database and the corresponding market and factor premium. In this section, we describe our data and methodologies in order to identify whether the fund managers in the Chinese market have superior skills in timing the market and security selection.
| (1) | (2) | (3) | (4) | (5) |
VARIABLES | N | mean | sd | min | max |
fund_return | 76,986 | 1.24% | 7.20% | -38.60% | 0.561 |
rf_m | 76,986 | 0.13% | 0.06% | 0.09% | 0.28% |
market_prem | 76,986 | 0.62% | 6.65% | -26.20% | 22.40% |
SMB | 76,986 | 0.36% | 4.91% | -22.50% | 21.40% |
HML | 76,986 | -0.22% | 3.58% | -15.50% | 16.40% |
MOM | 76,986 | 1.06% | 5.02% | -19.10% | 14.00% |
Excess_Return | 76,986 | 1.11% | 7.20% | -38.70% | 56.00% |
|
|
|
|
|
|
Table 1: Summary Statistics of the Sample
The table above provides us with a brief idea of the distribution of the sample during January 2003 to July 2020. In addition, the definitions of various data fields are presented in the table below.
Variables | Definition |
fund_return | Monthly fund return |
rf_m | Monthly risk-free rate |
market_prem | Corresponding market premium, calculated by using the monthly market return minus risk-free return |
SMB | Size factor premium |
HML | Value factor premium |
MOM | Momentum premium |
ExcessReturn | Excess return of funds’ monthly return over the risk-free return |
Table 2: Data Definition
In the dataset, there are a total of 76,986 data entries are recorded in the dataset. Overall, the average monthly mutual funds return in China is 1.24% with standard deviation of 7.20%. The maximum monthly return can be as high 56.10% with a minimum of -38.60%. Though the table only reports the average market premium, the average market return can be calculated from adding back the average risk-free rate. Hence, the average market return throughout the period is 0.75%. This number is lower than that of the average mutual funds’ market return. Hence, we can have a preliminary observation that the Chinese mutual funds indeed perform consistently better than the market. In the following sections, details of the data collection and summary statistics will be presented and discussed.
2.1.2. Mutual Funds Return
In the sample, the monthly return of 1181 mutual funds listed on Chinese stock exchanges are collected from January 2003 to July 2020. The average monthly return is calculated and plotted in a time series graph below.
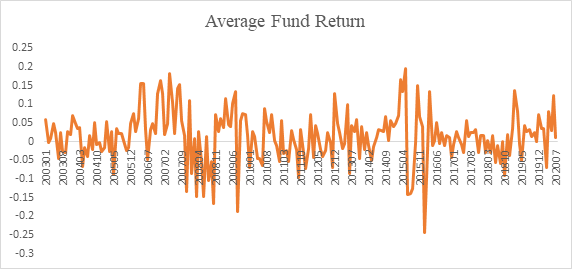
Figure 1: Mutual Funds’ Average Monthly Return
Based on Figure 1, we can see that the average monthly return of the funds demonstrate a somewhat mean reverting behavior with high volatility during certain periods.
2.1.3. Risk-free Rate
The risk-free rate used in this study is collected as the Chinese monthly loan prime rate published monthly.
2.1.4. Market Premium
Similarly, the market premium is collected from the same database as the average monthly fund returns.
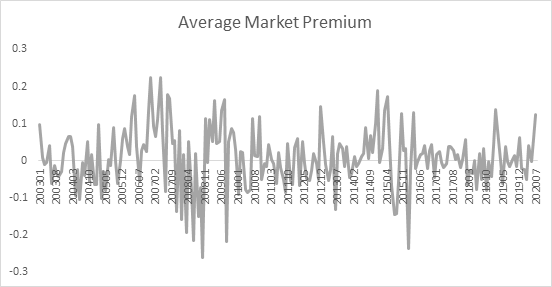
Figure 2: Average Monthly Market Premium
The average monthly market premium’s time series plot shows a mean reverting behavior around an average of 0.62%. The most volatile period of the market is observed during the Global Financial Crisis (“GFC”) in 20088.
2.1.5. Factor Premium
There are 3 factors that we are interested in this study, namely, the size, value and momentum factors. The size factor is calculated using the return for stocks with smaller market capitalization minus the ones with larger market capitalization. The value factor is calculated using the return of value stock minus growth stocks. Lastly, the momentum factor is calculated with the returns of the winning stocks minus that of the losing stocks.
2.2. Methodology
In this section, we will present the methodology used in this study to investigate the timing and stock selection skill of Chinese mutual fund managers. Overall, as demonstrated in earlier section, the Chinese fund managers perform well over the years. Hence, this study aims to identify what are the factors that contributed to the stellar performance. First of all, as the sampling period ranging consists of a 17-years long period from 2003 – 2020, and based on the preliminary observation from the previous section, the volatility of the market performance varies in different periods. Hence, I will divide the sample period into 3 sub-period, namely, 2003 – 2009, 2010 – 2016, and 2017 – 2020. All the relevant analysis will be performed by using data for the full sample period and each sub-sample period. The results from the sub-sample are also served as a robustness check for the conclusion based on the full sample.
2.2.1. Market-timing Model
This study adopts the methodology proposed by Chen and Chi (2018) in which they studied the factor-timing strategies in actively managed mutual funds. This methodology is primarily based on the Capital Asset Pricing Model (“CAPM”) and its extension such as the Fama French (“FF”) 3 factors model and Carhart model. In their research, the return-based factor-timing model is developed based on the framework proposed by Treynor and Mazuy (1996) and Henriksson and Merton (1981;). The foundation of the model is built upon the CAPM theory and proposed that the actively-managed fund manager will adjust their market beta in month t according to the forecasted market movements. Hence, the basis of this methodology can be established as follow:
\( {β_{i,t-1}}={β_{i}}+{γ_{i}}E({MKT_{t}}|{I_{t-1}}) \) – (1)
where the coefficient captures the fund manager’s timing skill and represents the manager’s market movement forecast based on the information available at t-1. Hence, substitute the above equation into the CAPM, we can get the equation below:
\( {R_{i,t}}={α_{i}}+{β_{i}}*{MKT_{t}}-{γ_{i}}*MKT_{t}^{2}+{ϵ_{i,t}} \) – (2)
In addition, Henriksson and Merton (1981) used a parametric model in order to identify the difference in beta for a upward moving market and a downward moving market. The proposed model is shown as below:
\( {R_{i,t}}={α_{i}}+{β_{i}}*{MKT_{t}}+{γ_{i}}*I({MKT_{i}} \gt 0)*{MKT_{t}}+{ϵ_{i,t}} \) – (3)
The key difference between the two models is that the second one has an indicator function where the function equals to 1 If the market return at time t is greater than 0 and equals to 0 otherwise. The additional indicator function enables us to see if there is significant difference in beta if there is an upward movement in the market.
2.2.2. Factor-timing Model
The above section has outlined the methodology to capture the timing skill of the fund manager. However, as we also intend to identify the stock selection skill of the fund manager from factor point of view. We will then extend the models outlined above in order to incorporate the factors as suggested by Chen and Chi (2018). The factors selected are based on FF3 and Carhart model proposed by Fama and French (1993, p.3-56) and Carhart (1997, p.61). The models can be specified as below:
\( {R_{mf,t}}-{R_{f,t}}={α_{mf}}+{b_{mf}}({R_{{m_{t}}}}-{R_{{f_{t}}}})+{s_{mf}}{SMB_{t}}+{h_{mf}}{HML_{t}}+{m_{mf}}{MOM_{t}}+{ϵ_{mf,t}} \) – (4)
Next, with regards to the model proposed by Henriksson and Merton (1981), an indicator function will then be applied to each of the factors to identify whether the fund manager will have a different beta for each factors during upward factor movement.
3. RESULTS AND DISCUSSION
This section will start with the presentation of results with regards to the models outlined and discussion the key findings based on the regression results.
2003 - 2020 | ||||||||
Model | Market Premium | Market Premium2 | I*Market Premium | Intercept | ||||
1 | 0.77 | ** | -0.31 | *** | 0.01 | ** | ||
(0.03) | (0.19) | (0.00) | ||||||
2 | 0.84 | *** | -0.13 | * | 0.01 | *** | ||
(0.05) | (0.08) | (0.00) | ||||||
2003 - 2009 | ||||||||
3 | 0.72 | *** | -0.07 | 0.01 | *** | |||
(0.03) | (0.19) | (0.00) | ||||||
4 | 0.78 | *** | -0.12 | 0.01 | *** | |||
(0.05) | (0.08) | (0.00) | ||||||
2010 - 2016 | ||||||||
5 | 0.84 | *** | -1.03 | ** | 0.01 | ** | ||
(0.05) | (0.40) | (0.00) | ||||||
6 | 1.00 | *** | -0.31 | ** | 0.01 | ** | ||
(0.10) | (0.16) | (0.01) | ||||||
2017 - 2020 | ||||||||
7 | 0.87 | *** | -2.33 | * | 0.01 | ** | ||
(0.11) | (1.29)) | (0.01) | ||||||
8 | 1.09 | *** | -0.51 | * | 0.02 | ** | ||
(0.21) | (0.30) | (0.01) | ||||||
Standard errors in parentheses
*** p<0.01, ** p<0.05, * p<0.1
Table 3: Regression Output of Market Timing Model (Model 2 and Model 3)
The table above is the regression output based on the market-timing model. It aims to identify whether the Chinese mutual funds possess significant market timing skill. For TM’s model (Model 1, 3, 5 and 7), the coefficients that captures the timing skill are significant in all sample periods except for 2003 – 2009. In addition, the coefficients are negative which indicated that the Chinese mutual funds’ performance decrease when market performance deviates from 0. Moreover, the intercepts of the equation are significant in all sample periods which indicates that first and second order of market premium are unable to fully explain Chinese mutual funds’ return.
Similar conclusions can be drawn from the HM model (Model 2, 4, 6 and 8) as the coefficients that measure the timing skills are significant in all sample periods except for 2003 – 2009. Hence, we can deduce that Chinese mutual funds indeed have superior timing skills. In addition, the HM model results tell us that Chinese mutual funds manager do have different betas in different market situation. As we observed, the coefficient for I*Market Premium is negative which indicates that the manager generally has a lower beta in times when market is trending upwards.
2003 - 2020 | ||||||||||
Model | Market Premium | SMB | HML | Mom | Intercept | |||||
9 | 0.77 | *** | 0.01 | *** | ||||||
(-0.03) | (0.00) | |||||||||
10 | 0.75 | *** | -0.02 | * | -0.49 | *** | 0.01 | *** | ||
(0.02) | (0.04) | (0.06) | (0.00) | |||||||
11 | 0.76 | *** | 0.07 | ** | -0.41 | *** | 0.26 | *** | 0.00 | *** |
(0.02) | (0.04) | (0.05) | (0.03) | (0.00) | ||||||
2003 - 2009 | ||||||||||
12 | 0.72 | *** | 0.01 | *** | ||||||
(0.03) | (0.00) | |||||||||
13 | 0.73 | *** | -0.16 | *** | 0.06 | 0.01 | *** | |||
(0.03) | (0.04) | (0.09) | (0.00) | |||||||
14 | 0.74 | *** | -0.01 | -0.06 | 0.27 | *** | 0.01 | *** | ||
(0.02) | (0.05) | (0.08) | (0.05) | (0.00) | ||||||
2010 - 2016 | ||||||||||
15 | 0.84 | *** | 0.00 | |||||||
(0.05) | (0.00) | |||||||||
16 | 0.77 | *** | 0.14 | * | -0.58 | *** | 0.00 | *** | ||
(0.03) | (0.07) | (0.10) | (0.00) | |||||||
17 | 0.79 | *** | 0.11 | * | -0.53 | *** | 0.15 | *** | 0.00 | |
(0.03) | (0.07) | (0.09) | (0.04) | (0.00) | ||||||
2017 - 2020 | ||||||||||
18 | 0.78 | *** | 0.01 | |||||||
(0.10) | (0.00) | |||||||||
19 | 0.58 | *** | -0.27 | * | -0.82 | *** | 0.00 | |||
(0.08) | (0.14) | (0.17) | (0.00) | |||||||
20 | 0.60 | *** | -0.08 | -0.75 | *** | 0.16 | 0.00 | |||
(0.08) | (0.18) | (0.17) | (0.10) | (0.00) | ||||||
Standard errors in parentheses
*** p<0.01, ** p<0.05, * p<0.1
Table 4: Regression Output of Model 4 from 2003 – 2020
We show the regression results of the CAPM, FF3 and Carhart model in the table above. We can see that market performance has a significant positive effect in all models which means the higher the market return, the higher the mutual funds’ return in all sample periods. For the SMB factor, the coefficient is significant in most of the sample period except for Carhart model in 2003 – 2009 and 2017 – 2020. Nonetheless, the effect of SMB factor on mutual funds’ return varies in different sample period. Hence, there is no consistent conclusion can be drawn based on our regression results.
For HML factor, it is significant at 1% level for all sample periods in all models except for 2003 – 2009. All the significant coefficients have a negative effect to the mutual funds’ return. This translate to the fact that Chinese mutual funds generally have a negative exposure to the HML factor i.e. the Chinese mutual funds behave more like a growth stock. This could potentially explains the stellar performance in Chinese mutual funds over the years. For momentum factor, it is significant in all period except for 2017 – 2020 and the exposure to momentum factor is positive. This indicated that for most of the time, the Chinese mutual funds will buy in historically winning stocks. Last but not least, we can see that the alpha (can be interpreted as the intercept) are disappearing over the years which indicates that the theoretical model provides a better framework for prediction of Chinese mutual funds’ return over the years.
2003 - 2020 | 2003 - 2009 | 2010 - 2016 | 2017 - 2020 | |||||
Market Premium | 0.75 | *** | 0.75 | *** | 0.77 | *** | 0.70 | *** |
(0.02) | (0.02) | (0.03) | (0.08) | |||||
Market Premium2 | -0.06 | 0.01 | -0.09 | -4.42 | *** | |||
(0.14) | (0.15) | (0.24) | (1.06) | |||||
SMB | 0.09 | ** | 0.03 | 0.06 | 0.05 | |||
(0.03) | (0.05) | (0.07) | (0.17) | |||||
SMB2 | 0.01 | -0.77 | 1.84 | ** | -3.02 | |||
(0.46) | (0.60) | (0.71) | (2.65) | |||||
HML | -0.39 | *** | -0.09 | -0.52 | *** | -0.58 | *** | |
(0.05) | (0.09) | (0.09) | (0.18) | |||||
HML2 | 1.92 | ** | 6.01 | *** | -1.34 | 3.95 | ||
(0.87) | (1.70) | (1.24) | (3.57) | |||||
MOM | 0.28 | *** | 0.28 | *** | 0.19 | *** | 0.17 | * |
(0.03) | (0.05) | (0.05) | (0.09) | |||||
MOM2 | -0.07 | 0.04 | -0.63 | 2.36 | * | |||
(0.40) | (0.60) | (0.61) | (1.25) | |||||
Intercept | 0.00 | 0.01 | * | 0.00 | 0.01 | |||
(0.00) | (0.00) | (0.00) | (0.00) | |||||
Standard errors in parentheses
*** p<0.01, ** p<0.05, * p<0.1
Table 5: Regression Output of Extension of Model 2 from 2003 – 2020 According to FF3 and Carhart Factors
In the table above, we showed the regression results of TM’s factor timing model. Interestingly, there is no general trend based on the regression results above as there is different significant factors in different period. For the whole sample period, only the HML factor timing is considered as statistically significant. This also applies to the subsample period of 2003 – 2009. In 2010 – 2016, the only significant factor timing is the SMB factor. During the most recent period, market premium and momentum timing factor become significant.
2003 - 2020 | 2003 - 2009 | 2010 - 2016 | 2017 - 2020 | |||||||||
Market Premium | 0.77 | *** | 0.74 | *** | 0.78 | *** | 0.97 | *** | ||||
(0.04) | (0.04) | (0.05) | (0.18) | |||||||||
I*Market Premium | -0.03 | 0.01 | -0.02 | -0.63 | ** | |||||||
(0.06) | (0.07) | (0.09) | (0.26) | |||||||||
SMB | 0.06 | 0.07 | -0.02 | 0.10 | ||||||||
(0.07) | (0.09) | (0.13) | (0.24) | |||||||||
I*SMB | 0.04 | -0.11 | 0.23 | -0.09 | ||||||||
(0.11) | (0.15) | (0.17) | (0.39) | |||||||||
HML | -0.58 | *** | -0.43 | ** | -0.56 | *** | -0.79 | ** | ||||
(0.09) | (0.17) | (0.12) | (0.35) | |||||||||
I*HML | 0.37 | ** | 0.63 | ** | 0.05 | 0.31 | ** | |||||
(0.15) | (0.27) | (0.21) | (0.47) | |||||||||
MOM | 0.26 | *** | 0.25 | *** | 0.17 | * | 0.09 | |||||
(0.06) | (0.09) | (0.10) | (0.20) | |||||||||
I*MOM | 0.02 | 0.07 | -0.02 | 0.19 | ||||||||
(0.10) | (0.15) | (0.15) | (0.31) | |||||||||
Intercept | 0.00 | 0.00 | 0.00 | 0.01 | ||||||||
(0.00) | (0.01) | (0.00) | (0.01) | |||||||||
Standard errors in parentheses
*** p<0.01, ** p<0.05, * p<0.1
Table 6: Regression Output of Extension of Model 3 from 2003 – 2020 According to FF3 and Carhart Factors
In the table above we showed the regression results of the factor-timing model based on the HM model. We can observe that the market premium and HML factors are significant over every sample periods. However, the timing coefficient that intend to capture the market timing factor is only significant in the most recent period 2017 – 2020 and it is significantly negative. This indicates that the fund manager will require a lower beta for the market premium in the case of an upward trending market. Additionally, the HML is also significant with a negative effect on the mutual funds’ performance. This is a similar observation as Table 4. However, in the HM model, we can see that the I*HML factor is also significant in all sample periods except for 2010 – 2016. This means that the Chinese mutual fund manager will adjust their beta when there is positive HML factor exposure. Moreover, all of the I*HML factors are positive which means the HML factor will be adjusted upwards i.e. making the fund behave like a value stock instead of a growth stock. The momentum factor is also significant. However, there seems to be no statistically significant evidence suggest that the Chinese funds manager have a superior momentum timing skill.
4. CONCLUSION
Overall, based on the regression results presented in this section, we can see that the mutual funds’ performance in China do have significant timing effect. However, the timing effect is different during different periods. Generally, for the whole sample period, based on TM and HM model, the Chinese mutual funds are able to time the HML factor. 2003 – 2009 has the same timing effect by the Chinese mutual fund managers according to TM and HM models. During 2010 – 2016, only TM model shows that the Chinese fund managers will time the SMB factor but the HM model does not show the same. For the most recent period, 2017 – 2020, the TM model shows that Chinese fund managers focuses on the timing of market and momentum factor whereas the HM model tells us that they will time the market and HML factor.
References
[1]. Carhart, M. M. (1997). On persistence in mutual fund performance. The Journal of Finance, 52(1), 57-82.
[2]. Chen, Q., & Chi, Y. (2018). Smart beta, smart money. Journal of Empirical Finance, 49, 19-38.
[3]. Fama, E. F., & French, K. R. (1993). Common risk factors in the returns on stocks and bonds. Journal of Financial Economics, 33(1), 3-56.
[4]. Henriksson, R., & Merton, R. (1981). On market timing and investment performance. Journal of Business, 54, 513-533.
[5]. Treynor, J., & Mazuy, K. (1966). Can mutual funds outguess the market? Harvard Business Review, 44, 131-136.
Cite this article
Li,Q. (2024). Actively Managed Stock Mutual Funds and Market Efficiency Evidence from China. Journal of Fintech and Business Analysis,1,56-63.
Data availability
The datasets used and/or analyzed during the current study will be available from the authors upon reasonable request.
Disclaimer/Publisher's Note
The statements, opinions and data contained in all publications are solely those of the individual author(s) and contributor(s) and not of EWA Publishing and/or the editor(s). EWA Publishing and/or the editor(s) disclaim responsibility for any injury to people or property resulting from any ideas, methods, instructions or products referred to in the content.
About volume
Journal:Journal of Fintech and Business Analysis
© 2024 by the author(s). Licensee EWA Publishing, Oxford, UK. This article is an open access article distributed under the terms and
conditions of the Creative Commons Attribution (CC BY) license. Authors who
publish this series agree to the following terms:
1. Authors retain copyright and grant the series right of first publication with the work simultaneously licensed under a Creative Commons
Attribution License that allows others to share the work with an acknowledgment of the work's authorship and initial publication in this
series.
2. Authors are able to enter into separate, additional contractual arrangements for the non-exclusive distribution of the series's published
version of the work (e.g., post it to an institutional repository or publish it in a book), with an acknowledgment of its initial
publication in this series.
3. Authors are permitted and encouraged to post their work online (e.g., in institutional repositories or on their website) prior to and
during the submission process, as it can lead to productive exchanges, as well as earlier and greater citation of published work (See
Open access policy for details).
References
[1]. Carhart, M. M. (1997). On persistence in mutual fund performance. The Journal of Finance, 52(1), 57-82.
[2]. Chen, Q., & Chi, Y. (2018). Smart beta, smart money. Journal of Empirical Finance, 49, 19-38.
[3]. Fama, E. F., & French, K. R. (1993). Common risk factors in the returns on stocks and bonds. Journal of Financial Economics, 33(1), 3-56.
[4]. Henriksson, R., & Merton, R. (1981). On market timing and investment performance. Journal of Business, 54, 513-533.
[5]. Treynor, J., & Mazuy, K. (1966). Can mutual funds outguess the market? Harvard Business Review, 44, 131-136.