


1. Introduction
The stock market is an integral part of the economy because it organizes resources and channels them to proper investments [1]. Stock price reflects the value in the market and broadly represents the economy's tendency. Since the stock price is a typical indicator of economic status and a bellwether of financial investment, stock price prediction has been a hot field for economists. By predicting stock prices, investors can make huge profits and hedge risks, and such economic activity also increases the transparency and efficiency of the capital market.
However, the stock market is highly dynamic and intercorrelated, and stock price prediction with high accuracy is challenging. For a substantial modern market, excessive data scale and complex environment make the act of prediction more difficult [2]. In addition, multiple linear and nonlinear factors exist, such as time lag problems, inefficient data used in the empirical study, and reflexivity in the market, making stock prices volatile and dynamic and affecting the prediction model [3][4].
Computer scientists have invented multiple prediction models based on different algorithms to participate in market prediction. Long Short-Term Memory (LSTM) was first presented by S. Hochreiter and J. Schmidhuber in 1997 [5]. LSTM is one special Recurrent Neural Network model. Unlike regular RNN models with only one hidden state, LSTM has one more transmission state: the cell state [6]. By controlling the state of gates, the LSTM model forgets less critical information, remembers valuable information, and thus performs better in long-term prediction [7].
This paper uses LSTM to predict the stock price and improve the accuracy of the result. The dataset used in this paper includes monthly stock prices of Tesla from 9/30/2019 to 4/11/2022. The data is arranged in 7 columns: the Date, the Highest price, the Lowest price, the Opening price, the Closing price adjusted for splits and dividends, the Stock volume, and total turnovers. We preprocessed the data by normalizing them to the range from 0 to 1 and splitting them into 70% train and 30% test sets.
We trained the LSTM model and evaluated it with four standards: mean average error, root mean square error, coefficient of determination, and mean absolute error percentage. Compared with the baseline K-nearest neighbors (K-NN) algorithm method, our LSTM performs better in these four terms of evaluation metrics.
2. Proposed Method
This section discusses the proposed method. First, the dataset is split into 70% train set and 30% test set. Then, we normalized the data (Sec. 2.1). Next, we presented the structure of our LSTM model (Sec. 2.2). In Section 2.3, we presented the process of getting optimal parameters used in our model.
2.1. Data Pre-Processing
We used seven parameters to extract the dataset's features, shown in Table 1.
Before normalizing the data, we split the dataset into two sets with the ratio of 70% training set and 30% test set. The train set is before the test set because the model is a time-series prediction [8]. Since stock prices are distributed in different ranges, the nonlinear dataset cannot be applied in the LSTM model. In this case, we applied the MinMaxScaler function to normalize the dataset [8]. The MinMaxScaler transformation is defined as (1) and (2). We set min as 0 and max as 1, and thus data in the normalized train set are in the range from 0 to 1.
\( {x^{std}}=\frac{x-min{(x)}}{max{(x)}-min{(x)}}\ \ \ (1) \)
\( {x^{scaled}}={x^{std}} ×(max-min)+min\ \ \ (2) \)
2.2. LSTM structure
LSTM performs better than the regular RNN model because it can solve long-term dependency problems. In order to control the loss of features from the dataset, LSTM implements gate mechanism, and the LSTM model is composed of a series of LSTM units [9]. The structure of one LSTM nit is shown in figure 1 [10].
The core part of LSTM is the cell state. As figure 1 shows, the cell state's input is Ci-1, and its output is Ci. The equation is defined as equation (3):
\( {C_{t}}={f_{t}}∙{C_{t-1}}+{i_{t}}∙\widetilde{{C_{t}}}\ \ \ (3) \)
|
Figure 1. The architecture of LSTM. |
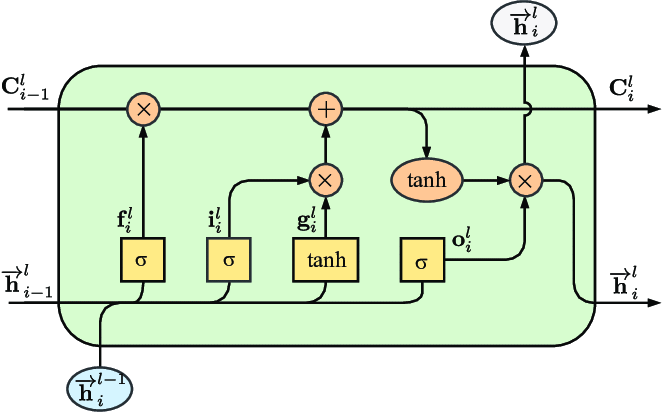
In equation (3), \( {f_{t}} \) is called forget gate, which forgets less important data from the previous data [10]. \( {i_{t}} \) is called input gate, which determines and writes information onto the Internal Cell State. The formulas are defined below:
\( {f_{t}}=σ({W_{f}}∙[{h_{t-1}},{x_{t}}]+{b_{f}})\ \ \ (4) \)
\( {i_{t}}=σ({W_{i}}∙[{h_{t-1}},{x_{t}}]+{b_{i}})\ \ \ (5) \)
\( \widetilde{{C_{t}}}=tanh({W_{C}}∙[{h_{t-1}},{x_{t}}]+{b_{C}})\ \ \ (6) \)
The output gate \( {σ_{t}} \) determines the output from the current state, and the formula is defined below:
\( {σ_{t}}=σ({W_{σ}}∙[{h_{t-1}},{x_{t}}]+{b_{σ}})\ \ \ (7) \)
\( {h_{t}}={σ_{t}}∙tanh({C_{t}})\ \ \ (8) \)
2.3. Tuning Parameters Process
We have an initial guess of optimal parameters and set the learning rate as 0.01, the number of hidden layers as 32, the number of epochs as 10, and the batch size as 16. First, we only change the learning rate and keep other parameters unchanged. Then we use four evaluation metrics to evaluate the results with different learning rates. As Table 2 shows, MAE, R2, RMSE, and MAPE reach the lowest value, and R square also reaches the highest value when we set the learning rate as 0.005. Therefore, the optimal learning rate is 0.005.
In Table 3, Since the optimal learning rate is 0.005, we only kept the learning rate unchanged and changed the number of epochs. The optimal epoch number is 30.
In Table 4, we set the number of epochs as 30. The optimal batch size is 16.
In Table 5, we only change hidden layers. The optimal number of hidden layers is 32.
Finally, we chose the optimal parameters: the learning rate is 0.005; the number of epochs is 30; the batch size is 16; the number of hidden layers is 32.
3. Experimental Result
This section discusses the experiment and the result. We introduced the dataset, the baseline method, and evaluation metrics used in the experiment (Sec. 3.1). Next, we presented the results of our LSTM model and KNN model in the experiment (Sec. 3.2). Then we compared the performance of two models and analyzed the result. (Sec. 3.3)
3.1. Experiment Setting
3.1.1. Dataset. The dataset used in this paper is Tesla INC from 9/30/2019 to 4/11/2022. The sample of the dataset is shown in Table 6.
3.1.2. Baseline Method. This paper used a model based on the K-nearest neighbors algorithm as the baseline method [11]. KNNs are characterized by a fast-training process and save all training data. We used the same dataset to train KNN models in the range of 1 to 300 and chose the one with the lowest MAE, RMSE, and MAPE to compare with our LSTM model.
3.1.3. Evaluation Metrics. We use four evaluation metrics: root mean square error, mean average error, mean absolute error percentage, and the coefficient of determination, and they are defined as (9) (10) (11) (12):
\( MAE= \frac{1}{n}\sum _{i=1}^{N}|{(Prediction_{i}}-{Real_{i}})|\ \ \ (9) \)
\( RMSE= \sqrt[]{\frac{1}{n}\sum _{i=1}^{N}{ω_{i}}{{(Prediction_{i}}-{Real_{i}})^{2}}}\ \ \ (10) \)
\( R2= 1-\frac{\sum _{i=1}^{N}{{(Prediction_{i}}-{Real_{i}})^{2}}}{\sum _{i=1}^{N}{{(Mean(Real)_{i}}-{Real_{i}})^{2}}}\ \ \ (11) \)
\( MAPE= \frac{1}{n}\sum _{1}^{N}\frac{|{(Prediction_{i}}-{Real_{i}})|}{{Real_{i}}}\ \ \ (12) \)
When MAE, RMSE, and MAPE are low, it represents that the forecasting task has less error and performs better. R2 is the coefficient of determination which is larger for better performance.
3.2. Result
In our experiment, the LSTM model and KNN model are evaluated in terms of four evaluation metrics. Table 7 shows the result of our LSTM model and KNN model, respectively.
As Table 7 shows, the LSTM model has the result with lower MAE, RMSE, MAPE, and higher R2, performing better than the KNN model.
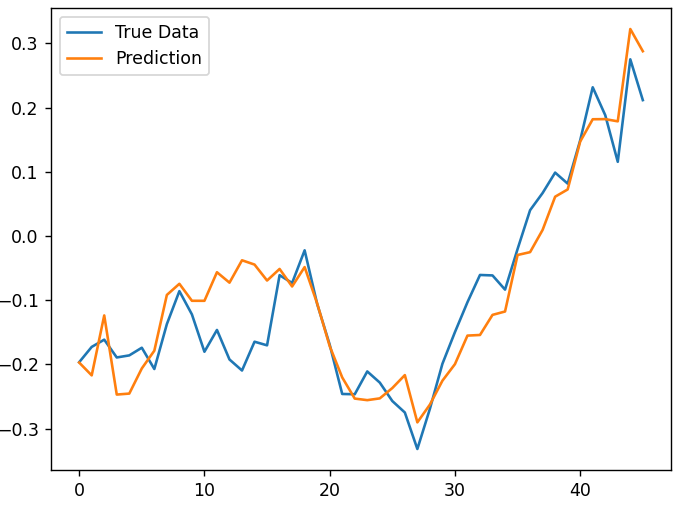
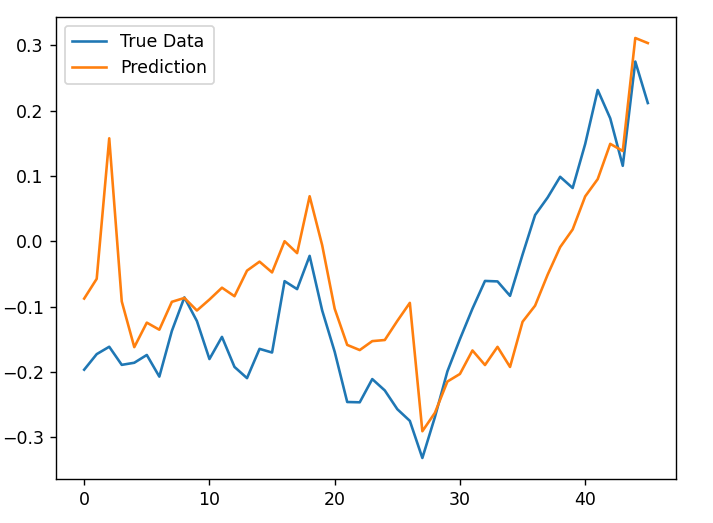
We visualize prediction data and real data. Figure 1 plots the relationship between the actual data and the prediction from LSTM; Figure 2 plots actual data and the prediction from the KNN model.
|
| |
Figure 2. Result of LSTM. | Figure 3. Result of KNN. |
3.3. Analysis
In figure 2, the prediction stock price is close to the real price, and the prediction line also reflects trends of real data; In figure 2, although the prediction data reflects the basic trends of real data, the predicted result is rough and inaccurate compared with figure 1. The lag problem also occurs in figure 2 and makes KNN inefficient in reflecting changes of stock price.
In conclusion, LSTM performs better than the KNN model in terms of both four evaluation metrics and visualized graphs.
4. Conclusion
This paper uses the LSTM model to perform best when we set hidden layers as 32, learning rate as 0.02, batch size as 32, and epochs as 250. The LSTM model has better performance than the average KNN model based on the evaluation metrics of MAE, RMSE, R2, and MAPE. In the future, we will continuously work on this issue to improve the accuracy by adding the Convolutional neural network into the Long Short-term Memory model; we will also study how to maintain performance stability.
References
[1]. UKEssays. (November 2018). The importance of the Stock Market to the Economy. (UKEssays) p2
[2]. Thawornwong, S, Enke, D.(2004) Forecasting Stock Returns with Artificial Neural Networks, Chap. 3. In: Neural Networks in Business Forecasting, (G.P. IRM Press, 2004.)
[3]. P. J. LUND, K. HOLDEN (1928) An Econometric Study of Private Sector Gross Fixed Capital Formation in the United Kingdom, 1923–1938 1, (Oxford Economic Papers) P56–73
[4]. C. Li, X. Zhang, M. Qaosar, S. Ahmed, K. M. R. Alam and Y. Morimoto (2019), "Multi-factor Based Stock Price Prediction Using Hybrid Neural Networks with Attention Mechanism," (IEEE Intl Conf on Dependable) p3
[5]. S. Hochreiter and J. Schmidhuber.(1997) Long short-term memory. (Neural Computation, 1997.) p5
[6]. Sussillo, D. (2014). Random walks: Training very deep nonlinear feed-forward networks with smart initialization.
[7]. Gers F A, Schmidhuber J, Cummins F. (2019) Learning to forget: Continual prediction with LSTM[J].
[8]. Cho K, Van Merriënboer B, Gulcehre C, et al. (2014) Learning phrase representations using RNN encoder-decoder for statistical machine translation[J]. (arXiv) p3
[9]. Jozefowicz R, Zaremba W, Sutskever I. (2015) An empirical exploration of recurrent network architectures[C] (International Conference on Machine Learning)
[10]. Nguyen, Minh Tuan & Kim, Yong-Hwa. (2019). Bidirectional Long Short-Term Memory Neural Networks for Linear Sum Assignment Problems. (Applied Sciences.)
[11]. Vahur Madisson,(2019) Stock market predictions with RNN using daily market variables. (Published in Towards Data Science)
[12]. W. Zhang, X. Chen, Y. Liu and Q. Xi (2020) "A Distributed Storage and Computation k-Nearest Neighbor Algorithm Based Cloud-Edge Computing for Cyber-Physical-Social Systems," (IEEE Access)
Cite this article
He,J. (2023). Stock price prediction with long short-term memory. Applied and Computational Engineering,4,127-133.
Data availability
The datasets used and/or analyzed during the current study will be available from the authors upon reasonable request.
Disclaimer/Publisher's Note
The statements, opinions and data contained in all publications are solely those of the individual author(s) and contributor(s) and not of EWA Publishing and/or the editor(s). EWA Publishing and/or the editor(s) disclaim responsibility for any injury to people or property resulting from any ideas, methods, instructions or products referred to in the content.
About volume
Volume title: Proceedings of the 3rd International Conference on Signal Processing and Machine Learning
© 2024 by the author(s). Licensee EWA Publishing, Oxford, UK. This article is an open access article distributed under the terms and
conditions of the Creative Commons Attribution (CC BY) license. Authors who
publish this series agree to the following terms:
1. Authors retain copyright and grant the series right of first publication with the work simultaneously licensed under a Creative Commons
Attribution License that allows others to share the work with an acknowledgment of the work's authorship and initial publication in this
series.
2. Authors are able to enter into separate, additional contractual arrangements for the non-exclusive distribution of the series's published
version of the work (e.g., post it to an institutional repository or publish it in a book), with an acknowledgment of its initial
publication in this series.
3. Authors are permitted and encouraged to post their work online (e.g., in institutional repositories or on their website) prior to and
during the submission process, as it can lead to productive exchanges, as well as earlier and greater citation of published work (See
Open access policy for details).
References
[1]. UKEssays. (November 2018). The importance of the Stock Market to the Economy. (UKEssays) p2
[2]. Thawornwong, S, Enke, D.(2004) Forecasting Stock Returns with Artificial Neural Networks, Chap. 3. In: Neural Networks in Business Forecasting, (G.P. IRM Press, 2004.)
[3]. P. J. LUND, K. HOLDEN (1928) An Econometric Study of Private Sector Gross Fixed Capital Formation in the United Kingdom, 1923–1938 1, (Oxford Economic Papers) P56–73
[4]. C. Li, X. Zhang, M. Qaosar, S. Ahmed, K. M. R. Alam and Y. Morimoto (2019), "Multi-factor Based Stock Price Prediction Using Hybrid Neural Networks with Attention Mechanism," (IEEE Intl Conf on Dependable) p3
[5]. S. Hochreiter and J. Schmidhuber.(1997) Long short-term memory. (Neural Computation, 1997.) p5
[6]. Sussillo, D. (2014). Random walks: Training very deep nonlinear feed-forward networks with smart initialization.
[7]. Gers F A, Schmidhuber J, Cummins F. (2019) Learning to forget: Continual prediction with LSTM[J].
[8]. Cho K, Van Merriënboer B, Gulcehre C, et al. (2014) Learning phrase representations using RNN encoder-decoder for statistical machine translation[J]. (arXiv) p3
[9]. Jozefowicz R, Zaremba W, Sutskever I. (2015) An empirical exploration of recurrent network architectures[C] (International Conference on Machine Learning)
[10]. Nguyen, Minh Tuan & Kim, Yong-Hwa. (2019). Bidirectional Long Short-Term Memory Neural Networks for Linear Sum Assignment Problems. (Applied Sciences.)
[11]. Vahur Madisson,(2019) Stock market predictions with RNN using daily market variables. (Published in Towards Data Science)
[12]. W. Zhang, X. Chen, Y. Liu and Q. Xi (2020) "A Distributed Storage and Computation k-Nearest Neighbor Algorithm Based Cloud-Edge Computing for Cyber-Physical-Social Systems," (IEEE Access)