


1. Introduction
Looking for effective investment strategies is an ongoing pursuit in the complex world of finance and investment. However, as more investors discover and utilize a strategy that produces Alpha, its effectiveness may diminish due to market competition over time [1-2]. Bollinger bands and RSI are classic investment technical analysis tools. on the one hand, according to Wilder, RSI values range from 0 to 100, with a level above 70 generally considered overbought and a level below 30 considered oversold [3]. On the other hand, the Bollinger bands is more suitable for long-term strategy, when the price hits the upper track which is the highest possible level of the price, the price may fall back; Similarly, when prices hit a downward trajectory which represents the lowest possible level, the market may be oversold and prices may rebound.
In order to further explore and innovate on these reversion strategy, the Reversion-Volume Alpha and the RSI-based Reversion Alpha are proposed, both integrating volume and Average True Range (ATR) metrics to mitigate the risks associated with reversion strategies and to enhance their performance relative to baseline tests.
Concurrently, through the test data, the Reversion-Volume Alpha has a relatively high level of volatility, and the RSI-based Reversion Alpha has a lower Information Ratio (IR). So a new combination strategy named VOLU-Reversion-RSI Alpha was created, which has been formulated to merge these two alpha, allowing different weightings imposed in accordance with their respective volatilities. It seeks to be market neutral , allows for significant reductions in exposure to the market risk and is adaptable through each different market environments. This not only adjusts the risk-return profile of reversion strategies, but also establishes the importance of using dynamic weighting according to the market results.
2. Precondition
As for the source of data, we will concentrate on equities in the China Securities Index 300 (CSI 300 Index), representing 300 large-cap and liquid A-shares listed in the Shanghai and Shenzhen Stock Exchanges. The components of this index are well known and maintain high liquidity, which is important for quant billionaires to utilise quantitative trading algorithms. It is using trade dates and including volume based on high and low price as well as opening to closing prices, which can be quickly extracted for financial analysis from CSMAR by defining data set through Python to interact on the index from 2014 up to year 2024. With access granted through an institutional account that has procured the necessary database subscription, datas are processed in four-year intervals based on the index's constituent list for each respective year.
To enhance the accuracy of the projected profit and loss (PNL), transaction costs are factored into the analysis. According the datas found in China Financial Futures Exchange (2024), the transaction cost encompass stamp duty, trading commissions, as well as considerations for slippage and the bid-ask spread.
Table 1: The three speculative data about the alpha
Stamp Duty | Trading commission | Trading commission |
0.1% | 0.025% | 0.03% |
• Stamp Duty (only charged when selling shares): 0.1% of the transaction value.
• Trading commission (charge both ways): 0.025%, Generally, it is now about 0.025% of the transaction value, and it may be lower if the amount of capital is large or if the situation is negotiated with brokerages.
• Trading commission: If market volatility is moderate, stock liquidity is high and order sizes are small, we consider it will be 0.02% or 0.03% of the transaction value.
At the meantime, in order to get the market neutrality which means the proportion of alpha investment meets the sum of 0 and the sum of absolute values is 1 [4], the strategy involves a series of computational steps. Initially, the average of all obtained values is calculated and each individual value subtracts this average. Then, this adjustment is followed by a normalization process to ensure that the strategy adheres to the stipulated market neutrality criteria. It ensures that the portfolio's exposure to market movements is neutralized, thereby reducing systematic risk and focusing the strategy's performance on the alpha signals.
3. Method
3.1. Reversion-volume alpha
3.1.1. Economic institution
Through the observation and analysis of a large number of stock trends, it is found that if there is no particularly large fluctuation in a certain period, stocks often show a mean reversal trend. Behind this phenomenon lies the inherent logic of the market. When the stock price deviates from its intrinsic value, the market forces will gradually prompt it to return to a relatively reasonable level. At the same time, as a classic technical analysis tool, the Bollinger Bands principle has important reference value in judging the fluctuation range of stock prices[5].
The principle is observing the price trend of stocks within an appropriate period. If the stock price does not have a particularly large fluctuation during this period, that is, the price fluctuation range is within a certain range, it can be preliminarily judged that the stock may have a mean reversion trend. The Bollinger Bands splits the range of the price change into three bands: the middle band, the upper band, and the lower band.
\( Middle Band(MB) = SMA(20) \)
SMA(20) represents the simple arithmetic average of the closing price over the past 20 periods (such as days, hours, etc.). The middle track is usually the moving average of stock prices over a period of time.
\( SD = \sqrt[]{\frac{\sum _{i-1}^{n}{({P_{i}}-MB)^{2}}}{n}} \) (1)
Among them, \( {P_{i}} \) denotation the price of its cycles.
\( Upper Band(UB) = MB + 2 × SD \) (2)
When the stock price is close to the upper track, it means that the stock price is relatively high and there may be a risk of correction.
\( Lower Band(LB) = MB - 2× SD \) (3)
when the stock price is close to the lower track, it means that the stock price is relatively low and there may be a rebound opportunity.
Fluctuations in trading volume are indicative of the sentiments and actions of market participants [6], a factor not inherently considered within the framework of Bollinger Bands. A substantial shift in trading volume can signal an impending change in market direction. An upsurge in volume, attributable to heightened market interest in a stock or the catalyst of significant positive news, may propel the stock price higher. Conversely, a decline in volume, stemming from waning market interest or the impact of negative news, could precipitate a drop in stock prices. By Incorporating the variation in trading volume alongside the mean reversion trend enhances the precision with which stock trends are assessed, the judgment about the trend of stocks will be accurate and it provides stronger support for investment decisions.
The purpose of constructing "reversion-volume Alpha" is to use these market laws and analysis tools to better judge whether different stocks have a mean reversion trend, and then determine whether to go long or short to obtain additional returns in stocks.
Simultaneously, to rigorously evaluate the efficacy of the reversion-volume Alpha, the original theoretical alpha with a time window of 20 is subjected to the same dataset for comparative analysis. It allows for a direct assessment of the performance of the new alpha against the established benchmark, ensuring a fair and comprehensive evaluation of its potential in the context of the given data.
3.1.2. Construction
\( \begin{matrix}X = -log{(CLOSE/(SMA(60)+SD(60)))} \\ Y = -log{(CLOSE/(SMA(60)-SD(60)))} \\ \end{matrix} \) (4)
CLOSE:The closing price of yesterday's trading day
SMA(60):Average trading price over the last 60 days
SD(60):Standard deviation of trading volume in the last 60 days
The mean reversion of stocks generally takes enough time to reflect, usually about 2-4 months, so 60 days is an appropriate time period. The X reflects a relative position of the closing price with respect to the sum value of SMA(60) and SD(60). The Y reflects the relative position of the closing price with respect to this difference value of SMA(60) and SD(60).
\( Raw Alpha = (X×Y \gt 0?(X+Y):0) \) (5)
In this formula, X*Y>0 means that the stock is above or below the Bollingband, and in this interval, the price of these stocks is about to undergo mean reversion. If the product of X and Y is greater than 0, then the value of Raw Alpha is the sum of X and Y; Otherwise, the value of Raw Alpha is 0. This means that the sum of X and Y is calculated as the "Raw Alpha" value only if they are of the same sign (that is, if the closing price has a consistent position relationship with the two calculated values above).
\( Refined Alpha1 = log{(1+|VOLU\_CHANGE|/VOLU\_AVERAGE(60))×Raw Alpha} \) (6)
\( |VOLU\_CHANGE| \) : the difference between the yesterday volume and the day before yesterday volume
\( VOLU\_AVERAGE(60) \) : average volume within 60 days
\( Refined Alpha1 \) amplifies the effect of volume change on the fundation of Raw alpha. According to the change in trading volume, enlarge or reduce the judgment ratio of the mean reversion trend. If the trading volume increases significantly, it means that the market sentiment is relatively strong, and the judgment ratio of the mean reversion trend can be appropriately enlarged, that is, be more inclined to think that the stock will develop in the direction of mean reversion; if the trading volume decreases significantly, it means that the market sentiment is relatively flat, and the judgment ratio of the mean reversion trend can be appropriately reduced, that is, be more cautious about whether the stock will have mean reversion. And finally we make market neutrality.
3.1.3. Comparison and test results analysis
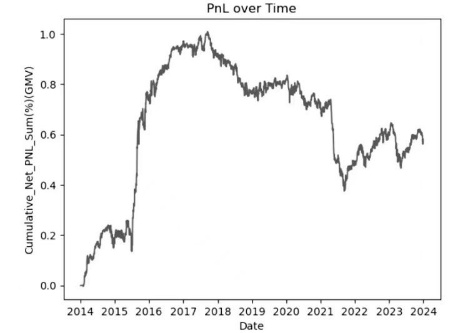
Figure 1: The test outcome of bollinger bands and reversion-volume alpha
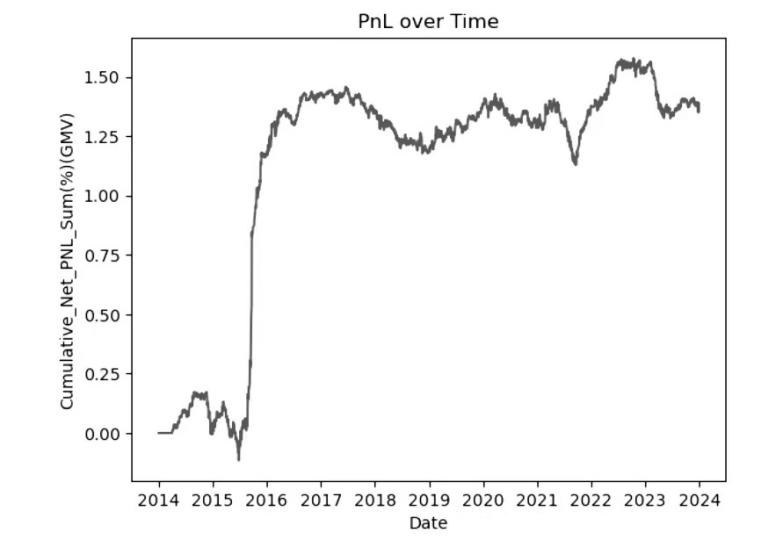
Figure 2: The return rate of 2014 to 2024 after adding the change of trading volume on the original basis
Incorporating the variable of trading volume and extending the window period from 20 to 60 days has significantly enhanced the Reversion-volume Alpha's performance, effectively arresting the decline in cumulative profit and loss (PNL) over the period from 2018 to 2024.
From the aspect of macro environment, between 2015 and 2016, the CSI 300 stocks experienced a notable upsurge, primarily attributed to the government's enhanced regulatory policies, particularly an increase in oversight of shadow banking products. Concurrently, a downturn in the housing market led many investors to redirect their funds from real estate to the stock market, further fulling the upward trend in stocks. Additionally, the People's Bank of China's implementation of targeted easing measures, such as the use of PSL (Pledged Supplementary Lending) tools, played a role in this growth. These factors, combined with strategic investment timing, resulted in a swift increase in PNL. Post-2016, the PNL trend exhibited a relatively stable trajectory until June 2021. It was during this period, following the market's adjustment to the pandemic-induced volatility, that the CSI 300 stocks witnessed another rise. Alongside this, the influence of the Reversion-volume Alpha in the market started to diminish gradually.
Table 2: The three relevant data of 2014 to 2024 after adding the change of trading volume on the original basis
Ann.return | Ann.volatility | IR |
13.79% | 18.66% | 0.74 |
The strategy has achieved an annual return of 13.79%, which is commendable. However, the annual volatility stands at 18.66%, indicating a level of risk that may be considered excessive. Despite this, the Information Ratio (IR) of 0.74 signals a relatively strong performance in risk-adjusted terms. While the overall figures are positive, there is a clear need to enhance the strategy's stability to ensure more consistent outcomes.
3.2. RSI- based reversion alpha
3.2.1. Economic institution
According to the Wilder [7], RSI, or Relative Strength Index, is a momentum indicator used in the field of technical analysis to help investors assess the price momentum of stocks or other assets and the values range from 0 to 100. A high RSI represents optimistic market sentiment which may lead to overvalued prices. In general, an RSI level above the 70 threshold is widely interpreted as a signal of overbought status, indicating that the asset's price may be ready for a potential pullback. Conversely, an RSI level below the benchmark 30 is generally considered to indicate oversold conditions, which may indicate the possibility of a price reversal and subsequent upward movement.
It reflects a situation where buying pressure has been strong and persistent when the RSI rises above 70 and leading to a diminished ability of market participants to push prices higher, indicating a possible over expansion potentially. On the other hand, when the RSI falls below 30, it reflects a situation where selling pressure has become dominant and may reach the point of exhaustion, suggesting that the market may be entering a correction phase. And the formula is:
\( RS = \frac{Avg. Gain(14)}{Avg. Loss(14)} \) (7)
\( Avg. Gain(14) \) :Average earnings over a 14-day window
\( Avg. Loss(14) \) :Average loss over a 14-day window
\( RSI = 100 - (\frac{100}{1+RS}) \) (8)
Since RSI is a technical index and more factors are needed to assist in judgment, the importance of return was taken into consideration, as well as ATR. Meanwhile, drawing on the RSI theory, the RSI threshold is established as a critical reversal point for investment direction selection, amplifying the impact of the RSI threshold on investment strategies.When the RSI indicator falls within the range indicative of a reversal, it suggests that the stock's price may be poised to change direction. In such scenarios, an investment strategy would involve positioning in the opposite direction of the anticipated return; conversely, if no reversal is expected, the strategy would align with the direction of the return. At the same time, ATR, as a technical analysis index used to measure market volatility, can serve to mitigate risks further. A smaller ATR implies lower volatility which leads to greater predictability. The size and sign of the alpha can help to determine the extent and direction of our long positions. According to Panigrahi[8], when the threshold of RSI is set at 60-40, the strategy is better in the short-term return, so in this strategy, the 2 days acts as the return period and RSI time window.
The purpose of constructing RSI-based reversion Alpha is to make use of these market rules and analysis tools to better judge whether there is a reversal in different stocks, so as to decide whether to go long or short in order to obtain additional returns from stocks. When the strategy's predictions are in line with the actual movement of the stock, it is possible to profit from market opportunities by buying low and selling high.
Our research compared the traditional 14-day RSI with the RSI-based regression alpha, which has a 2-day RSI time frame with an added ATR factor to rigorously evaluate the effectiveness of the alpha strategy. This comparative analysis facilitates a direct assessment of the performance of the new alpha relative to the standard benchmark, ensuring a balanced and thorough assessment of its potential in the particular data set under consideration.
3.2.2. Construction
\( \begin{cases} \begin{array}{c} Raw Alpha = -Return(2), (RSI\_dbefore yeday \gt 60 and RSI\_yeday \lt 60) \\ Raw Alpha = -Return(2), (RSI\_ dbefore yeday \lt 40 and RSI\_yeday \gt 40) \\ Raw Alpha = Return(2), (RSI\_ dbefore yeday \gt = 40 and RSI\_yeday \lt = 60) \end{array} \end{cases} \) (9)
\( Return(2) \) : The ratio of the profit or loss to the original investment in 2 days
RSI_ dbefore yeday:RSI_day before yesterday
\( RSI\_yeday \) : \( RSI\_yesterday \)
To reduce the risk of false trading signals that can lead to significant losses during periods of prolonged market optimism, the traditional RSI regression thresholds above 70 and below 30 have been refined. According to Panigrahi[9], the setting of 60 and 40 is more appropriate in volatile markets than the traditional RSI thresholds of 70 and 30. The strategy now is that when the RSI is above 60 and below 60 the previous day, a reversal trade will be initiated to take advantage of a momentum shift. Similarly, if the RSI is below 40 but above 40 the previous day, a reversal trade is executed to capture potential upside. This adaptive approach ensures a more sensitive trading mechanism that is consistent with the dynamic nature of price movements and the RSI comparison cycle, thereby improving the chances of generating profits. The combination of a 2-day return cycle further enhances the flexibility of the strategy, allowing it to quickly adapt to market changes and keep pace with RSI's directional indicators.
\( Refined Alpha = Raw Alpha/ATR \) (10)
Given the inherently risky nature of inversion strategies, the inclusion of the average true Range of Volatility (ATR) as a risk management tool must be strengthened. ATR increases during these periods, indicating high volatility, and it is prudent to lower investment weights to reduce potential risks. On the contrary, when the ATR is low, it indicates that the volatility is low, and the investment weight is increased to make full use of market conditions and ensure the stability of alpha returns. This adaptive approach aligns investment exposure with market dynamics and aims to maintain and improve the performance of the strategy.
3.2.3. Comparison and test results analysis
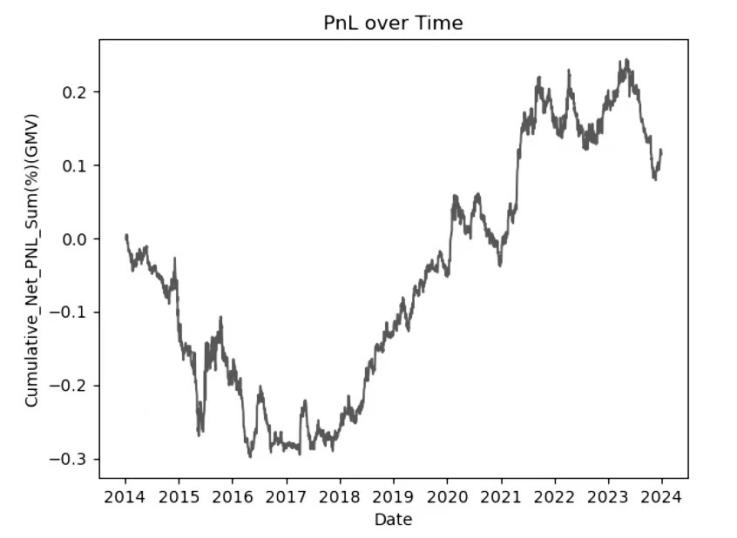
Figure 3: The test outcome of the classical RSI theory
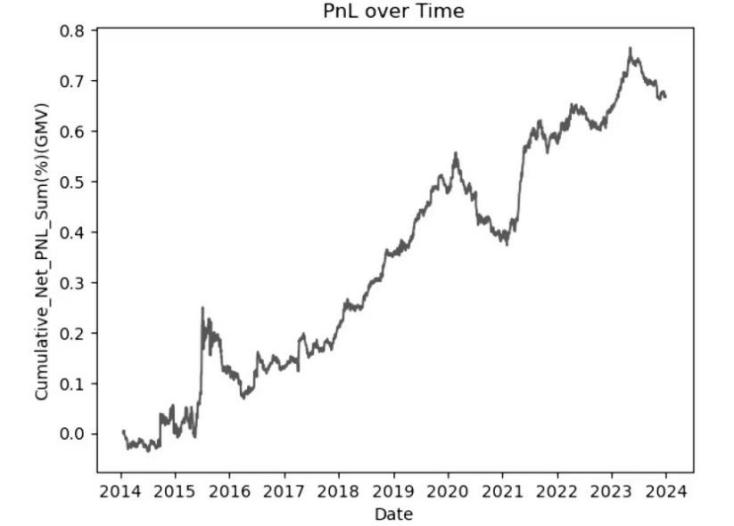
Figure 4: The test outcome of the RSI- based reversion alph
The RSI- based reversion Alpha places a greater emphasis on revenue stability compared to the classical RSI theory. It can better adapt to the volatile market conditions that prevail in the initial phase, resulting in significantly improved overall profit and profit loss performance by adopting a shorter time window. The inclusion of the average true Range of volatility (ATR) is also a crucial element of the methodology at the same time. From a macro point of view, the profit and loss of the Shanghai and Shenzhen 300 index PNL rose rapidly from January to December 2015. This surge can be attributed to the upward trajectory of the Shanghai and Shenzhen stock markets prior to 2015, which has inflated valuations of some stocks. Moreover, regulatory interventions, particularly the authorities' tightening of oversight on margin financing and similar financial activities, played a role in the subsequent market downturn. The increase in the CSI 300 index from the beginning of 2021 to mid-2022 was driven by various elements such as economic rebound, enhanced corporate earnings, favorable government policies, a boost in investor optimism, and a slow but steady improvement in market psychology. RSI- based reversion Alpha capitalized on this upward trend by investing in the stocks that were on the rise, while minimizing investments in those that were declining, thereby incurring fewer losses. At the same time, the government implemented an investment strategy that included a range of policy initiatives—such as tax cuts, fee reductions, and business environment enhancements—that contributed to a rapid increase in PNL.
Table 3: The three relevant data of test outcome of the classical RSI theory and RSI- based reversion alpha
Ann.return | Ann.volatility | IR |
6.67% | 8.18% | 0.81 |
With an Annual Return of 6.67%, the strategy demonstrates a modest annual profit, which, while acceptable, may not be competitive against higher-yielding opportunities or market benchmarks. The Annual Volatility of 8.18% indicates a moderate level of risk, suggesting that the strategy's returns fluctuate within a manageable range, which is a positive sign for stability. However, the Information Ratio of 0.81 suggests that the strategy's risk-adjusted returns are not particularly compelling; it implies that for each unit of risk undertaken, the strategy generates only 0.81 units of excess return over the risk-free rate. This indicates that the RSI- based reversion Alpha strategy may not be generating sufficient returns to justify its risk level, highlighting a need for refinement to enhance its performance and attractiveness to investors.
3.3. Trade strategy -VOLU-reversion-RSI alpha
3.3.1. Economic institution
Reversion-volume Alpha takes into account the functions of Bullinger bands and volume change, and increases the influence of volume change on investment weight. When the change is large, the investment power is significant, but the risk is easily increased, resulting in the rapid rise and fall of PNL, in principle, this strategy is better executed over the long term. It appears to have a large effect in the early stage but a very weak effect in the later stage. Rsi-based reversion Alpha takes RSI and ATR factors into account to help determine the volatility of asset prices to reduce the investment weight of stocks with high volatility, and ensure the stability of returns. In the early stage, return is small and show a downward trend, but in the later stage, they show an upward trend and play a significant role. A new strategy VOLU-Reversion-RSI Alpha is created by combing the two alphas.
3.3.2. Construction
The primary challenge to address is the pronounced volatility associated with the Reversion-volume Alpha. To mitigate this, the risk parity model, as introduced by Qian in 2006, is applied. This model ensures that each alpha in the portfolio contributes equally to the overall portfolio risk, thereby effectively managing the risk profile. By equalizing the risk contribution of the two alphas, the model minimizes the risk of significant losses that could arise from an over-weighted underperforming alpha. Concurrently, when an alpha performs exceptionally well, the risk parity approach ensures that its impact on the portfolio remains within a manageable risk threshold, preventing the introduction of substantial risks that might come with over-concentration.
At the same time, establish a signal comprehensive judgment mechanism, when two strategies send buy or sell signals at the same time, give a higher weight to operate. When the strategy signals are inconsistent, further analysis is needed, such as observing changes in prices and related indicators. If the price continues to move in the favorable direction of Strategy 1, and other indicators support Strategy 1, operating primarily on Strategy 1, while appropriately controlling positions in conjunction with strategy 2 to reduce risk. Dynamically adjust asset allocation ratio according to market conditions and strategy characteristics. When the market is stable and the mean reversion signal of strategy 1 is accurate, the investment proportion of strategy 1 should be increased moderately; When the market fluctuates greatly, the weight of strategy 2 should be increased, and the triggering conditions and amplitude limits of adjustment should be set to avoid the increase of transaction costs caused by frequent or large adjustments. Combined with the risk control characteristics of strategy, strategy one controls the risk by setting the amplitude of price deviation from the mean value and the threshold of trading volume change ratio. Strategy two adjusts the position according to market volatility and win rate changes. When encountering abnormal conditions, take measures such as reducing positions and setting stop losses to protect the value of the portfolio.
\( {w_{1}}=\frac{\frac{1}{{σ_{1}}}}{\frac{1}{{σ_{1}}}+\frac{1}{{σ_{2}}}} \) (11)
\( {w_{1}}=\frac{\frac{1}{{σ_{1}}}}{\frac{1}{{σ_{1}}}+\frac{1}{{σ_{2}}}} \) (12)
VOLU-Reversion-RSI Alpha =
(Reversion-Volume Alpha)* \( {w_{1}} \) + (RSI- based reversion / momentum switch Alpha) * \( {w_{2}} \)
3.3.3. Test results and analysis
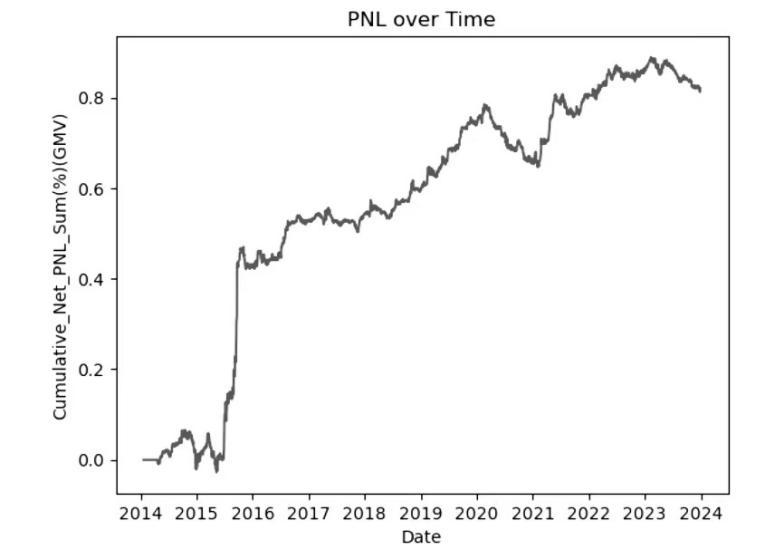
Figure 5: The test outcome of VOLU-reversion-RSI alpha
From June 2015 to early 2016, the CSI 300 experienced a significant surge attributed primarily to shifts in governmental regulatory policies, particularly increased oversight of shadow banking products. Concurrently, a downturn in the housing market led many investors to redirect their funds from real estate to the stock market, further fueling the upward trend. Additionally, the People's Bank of China's implementation of targeted easing measures, such as the use of PSL (Pledged Supplementary Lending), contributed to this growth. During this period, an investment strategy that capitalized on these factors would have seen a rapid increase in profits and losses (PNL). Post-2016, the PNL trend remained relatively stable until June 2021, when, following the market's adjustment to the pandemic's volatility, a resurgence in market sentiment led to another uptick in the CSI 300 stocks.
Table 4: The three relevant data of the test outcome of VOLU-reversion-RSI alpha
Ann.return | Ann.volitality | IR |
8.20% | 7.56% | 1.03 |
The VOLU-Reversion-RSI Alpha demonstrates a commendable risk-adjusted return, with an annualized return of 8.20% and a volatility of 7.56%, indicating a relatively stable performance with lower market risk exposure. In addition, the information ratio of 1.03 indicates that for every unit of tracking error taken, the strategy produces 1.03 units of excess return, which is considered positive because it implies effective performance after adjusting for risk.
4. Conclusion
This research goes deep into the details of Reversion-Volume Alpha, RSI-based reversion Alpha and combination of their models, VOLU-Reversion-RSI Alpha. Looking Back at a Decade of Revenue By plotting the pairwise plasma flows through in and outflow branching, we find that while all models show Rubisco uptake similarly increasing with PAR, resulting in a common plot trajectory, each model demonstrates distinctive performance patterns. The Reversion-Volatiltity Alpha experienced major spikes in revenue over certain points, however it ran into tough patches as well. On the other hand, yield chart of RSI based model display highly erratic waves as below, but somehow with a very clear upward trend. In contrast, by adopting the strengths of its prior type, the hybrid model not only outperformed in various epochs but also performed a steadier overall performance. The results across models were mixed with some great returns but at the cost of more volatility, and others less risk to deliver a smoother return. Finally, the proposed models may provide valuable insights for improving and selecting investment strategies. The final productivity levels of these strategies were somewhat underwhelming, according to the study, however giving scope for improvement. Although that element makes sense, the practical application definitely needs to be adjusted and customized based on a correlation to current market conditions as well as risk tolerance of those who are investing.
References
[1]. Bollinger, J. (2001). Bollinger on Bollinger Bands. McGraw Hill Professional.
[2]. Granville, J. E. (1976). Granville’s New Strategy of Daily stockMarket Timing for Maximum Profit. Simon & Schuster.
[3]. Li, J., Gong, Y., Zhao, Q., Xie, Y., Fong, S., & Yen, J. (2023). Market Sentiment Analysis Based on Social Media and Trading Volume for Asset Price Movement Prediction. In X. Yang, et al. (Eds.), Advanced Data Mining and Applications. ADMA 2023. Lecture Notes in Computer Science, vol 14176 (pp. 1–15). Springer, Cham. https://doi.org/10.1007/978-3-031-46661-8_26
[4]. List of fees charged by China Financial Futures Exchange. China Financial Futures Exchange. August 30, 2024. http://www.cffex.com.cn/zjssf/20190508/23701.html
[5]. Qian, E. Y. (2006). Risk Parity and Diversification. The Journal of Investing, 20(1), 119-127.
[6]. Panigrahi, A. K., Vachhani, K., & Chaudhury, S. K. (2021). Trend identification with the relative strength index (RSI) technical indicator – A conceptual study. Journal of Management Research and Analysis, 8(4), 159–169. https://doi.org/10.18231/j.jmra.2021.033
[7]. Tobocman, W. (1962). Theory of alpha decay. https://doi.org/10.2172/4779058
[8]. Tulchinsky, I. (2019). Finding Alphas. John Wiley & Sons.
[9]. Wilder, J. W. (1978). New Concepts in Technical Trading Systems.
Cite this article
Lin,Y.;Liu,Q.;Zhang,Y. (2025). Exploration of VOLU-Reversion-RSI Alpha: Creation, Analysis and In-Depth Thinking. Applied and Computational Engineering,134,221-230.
Data availability
The datasets used and/or analyzed during the current study will be available from the authors upon reasonable request.
Disclaimer/Publisher's Note
The statements, opinions and data contained in all publications are solely those of the individual author(s) and contributor(s) and not of EWA Publishing and/or the editor(s). EWA Publishing and/or the editor(s) disclaim responsibility for any injury to people or property resulting from any ideas, methods, instructions or products referred to in the content.
About volume
Volume title: Proceedings of the 5th International Conference on Signal Processing and Machine Learning
© 2024 by the author(s). Licensee EWA Publishing, Oxford, UK. This article is an open access article distributed under the terms and
conditions of the Creative Commons Attribution (CC BY) license. Authors who
publish this series agree to the following terms:
1. Authors retain copyright and grant the series right of first publication with the work simultaneously licensed under a Creative Commons
Attribution License that allows others to share the work with an acknowledgment of the work's authorship and initial publication in this
series.
2. Authors are able to enter into separate, additional contractual arrangements for the non-exclusive distribution of the series's published
version of the work (e.g., post it to an institutional repository or publish it in a book), with an acknowledgment of its initial
publication in this series.
3. Authors are permitted and encouraged to post their work online (e.g., in institutional repositories or on their website) prior to and
during the submission process, as it can lead to productive exchanges, as well as earlier and greater citation of published work (See
Open access policy for details).
References
[1]. Bollinger, J. (2001). Bollinger on Bollinger Bands. McGraw Hill Professional.
[2]. Granville, J. E. (1976). Granville’s New Strategy of Daily stockMarket Timing for Maximum Profit. Simon & Schuster.
[3]. Li, J., Gong, Y., Zhao, Q., Xie, Y., Fong, S., & Yen, J. (2023). Market Sentiment Analysis Based on Social Media and Trading Volume for Asset Price Movement Prediction. In X. Yang, et al. (Eds.), Advanced Data Mining and Applications. ADMA 2023. Lecture Notes in Computer Science, vol 14176 (pp. 1–15). Springer, Cham. https://doi.org/10.1007/978-3-031-46661-8_26
[4]. List of fees charged by China Financial Futures Exchange. China Financial Futures Exchange. August 30, 2024. http://www.cffex.com.cn/zjssf/20190508/23701.html
[5]. Qian, E. Y. (2006). Risk Parity and Diversification. The Journal of Investing, 20(1), 119-127.
[6]. Panigrahi, A. K., Vachhani, K., & Chaudhury, S. K. (2021). Trend identification with the relative strength index (RSI) technical indicator – A conceptual study. Journal of Management Research and Analysis, 8(4), 159–169. https://doi.org/10.18231/j.jmra.2021.033
[7]. Tobocman, W. (1962). Theory of alpha decay. https://doi.org/10.2172/4779058
[8]. Tulchinsky, I. (2019). Finding Alphas. John Wiley & Sons.
[9]. Wilder, J. W. (1978). New Concepts in Technical Trading Systems.