


1. Introduction
Since the late 2010s, the global energy sector has started a clear shift to low-carbon systems. This change comes from the need to slow climate change. It also comes from better technology and stronger policies. After 2020, many governments made rules that are more direct and stronger. At the same time, renewable energy grew faster, and more EVs came to the market. For many countries, these rules are not only about the environment. They also try to make energy safer, keep prices stable, and help industry grow.
From 2019 to 2025, renewable energy policies became broader and more linked. There were fiscal incentives, renewable portfolio standards, carbon trading, and big projects for grids and charging stations. These tools work together. Fiscal incentives, like tax credits and subsidies, make clean energy cheaper to start. Market rules, like renewable standards and carbon prices, give signals for long-term change. Also, governments put money into grids, storage, and public charging, so there are no significant physical limits to growth.
Electric vehicles are now a central part of the energy shift. They not only change transport. They also change the way electricity is used. They cut the need for oil and gas in transport. They also add new patterns of electricity use. This affects the grid and prices. Some EVs can send power back to the grid, which is called V2G. This can help balance the ups and downs of wind and solar power. In this way, the transport sector and the energy sector are more linked.
Studies give some ideas on these changes. Some show that renewables can make prices more stable because they cut the link to fossil fuel prices [1,2]. But some show that high use of renewables can still bring big price swings. This can happen when the weather changes a lot and the grid is not flexible enough [3,4]. Renewable portfolio standards can also change wholesale prices and the way companies invest in power plants [5]. Global studies show that the extent to which the power sector cuts carbon depends on the strength of policies and how well they are managed [6].
Research on EVs shows that people buy them for many reasons. These include the quality of the technology, the extent of price drops, the number of charging points, and the type of rules in place [7]. Battery prices have gone down fast in the last ten years. But they still need to drop more, and the energy stored in each battery needs to grow. Studies show that battery electric cars have the lowest carbon footprint of all passenger cars in many clean-energy plans [8]. But there are still problems. Charging points are not everywhere. The grid needs upgrades. There are also fairness issues in who can get clean transport [9].
Many studies focus on one side only. Some look at the supply side, like power plants and prices. Others look at the demand side, like EV use. But there are not many that put both together to see how the whole market changes. The years since 2019 are important for study. They show many new rules, market shocks, and significant technological advancements.
This paper looks at how renewable energy policies from 2019 to 2025 changed the energy market. It looks at three parts. First, it looks at the tools used by the policies, such as fiscal incentives, market rules, and infrastructure plans. Second, it looks at changes in the market, like new renewable companies, old energy companies moving into renewables, and the way EV supply chains link to other sectors. Third, it looks at how technology and costs changed for solar, wind, storage, and EVs, and how these changes affect consumers. The study follows a simple path. Rules shape the market. The market changes how companies act. This then changes what consumers can buy and how they use it. By looking at each step, the study shows how renewable energy policy changes the market.
2. Impact
2.1. Policy framework and pathway
Since 2019, energy policies have experienced significant modifications across various sectors. Currently, there is a combination of policies that encompass financial support, market programs, and infrastructure initiatives. These policies include research and development funding, tax incentives, and programs such as the RPS and ETS. Additionally, there is a pronounced emphasis on enhancing the electric grid and expanding public charging infrastructure. Financial incentives facilitate the initiation of new projects by companies involved in solar, wind, and battery storage. The RPS and ETS establish stable demand and pricing signals, thereby fostering the development of clean energy initiatives. Infrastructure investments enhance grid connectivity and resource accessibility, thereby reducing risks for developers. Consequently, traditional fossil fuels are progressively marginalized, resulting in heightened competition within the clean energy sector [10].
2.2. Major changes in the competitive landscape
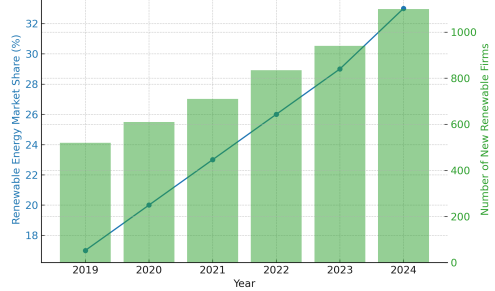
The future looks promising for the growth of new energy companies. In the U.S., large solar firms increased by approximately 45% from 2019 to 2024, while wind power developers' share grew by about 30%. This expansion is changing the electricity sector, impacting prices and shaping investment approaches. Meanwhile, traditional energy firms are also evolving. Increasing carbon regulations and the requirement for emissions reporting are prompting oil and gas firms to invest more in renewables. Since 2021, it’s estimated that international oil companies have allocated roughly 8% to 12% of their budgets to renewable initiatives. This transition blurs the boundaries between conventional and renewable energy sources, leading to greater competition. Table 1 shows the market structure changes of renewable energy and traditional energy industries from 2019 to 2024.
|
Year |
Renewable Energy Market Share (%) |
Number of New Renewable Firms |
Share of Traditional Energy Firms with RE Investments (%) |
|
2019 |
17 |
520 |
15 |
|
2020 |
20 |
610 |
18 |
|
2021 |
23 |
710 |
22 |
|
2022 |
26 |
835 |
26 |
|
2023 |
29 |
940 |
30 |
|
2024 |
33 |
1100 |
34 |
2.3. Cross-industry integration and supply chain collaboration
The new energy landscape demonstrates greater integration across industries. For example, electric vehicles (EVs) connect car manufacturers, battery producers, and power providers. This collaboration strengthens partnerships and improves the supply chain. By 2024, investments in EV-related projects made up about 35% of global growth in battery capacity (Figure 1). For energy providers, participating in the EV supply chain opens new sales opportunities and advances grid technology, including V2G systems.
2.4. Structural results and evidence interpretation
Renewable energy has grown substantially, increasing from 17% to 33%, which has displaced fossil fuels in the energy mix. Additionally, the number of industry players has risen significantly; renewable energy companies have expanded from 520 to 1,100, and the percentage of traditional energy firms investing in renewables has increased from 15% to 34%. This trend introduces a new array of competitors and promotes closer collaboration across supply chains. Regarding pricing and risk, the strong link between fuel costs and the "portfolio-marginal sequence" mechanism aids in price stabilization. The concurrent growth of energy storage and demand response capabilities helps smooth peak demand fluctuations, providing a buffer against market volatility [2,3]. Furthermore, the increased adoption of renewable sources reduces reliance on volatile fossil fuel markets, offering an "insurance value" as a safeguard.
3. Impact of NV policies on technology and costs (2019–2025)
Since 2019, the policy has simultaneously activated three levers. Governments have promoted R&D, markets, and networks collectively. They targeted funding to develop key technologies, employed regulations to maintain consistent demand for clean energy, and invested in grid and charging infrastructure to facilitate access. These measures improved efficiency, reduced costs, and simplified project implementation.
3.1. R&D and technological progress
Public support and tax credits have supported firm-level R&D. High-efficiency solar cells have been improved, and inverter control systems have been enhanced. Wind turbines have increased in size. Storage systems have advanced in areas like cells, thermal management, and power electronics. Practical field experience also contributed, enabling the same sites to generate more electricity using the same land and equipment. As a result, the cost per kilowatt-hour decreases [11].
3.2. Paths to lower cost
No single factor accounts for the decline. Larger factories spread fixed costs, while learning effects improve yield and uptime. Local supply chains reduce shipping and inventory losses. Policy tools—such as investment credits, faster depreciation, and affordable financing—lower the cost of capital. Table 2 illustrates the combined impact. PV module efficiency increases annually. Onshore turbine ratings rise. Battery pack costs decrease from $150 per kWh in 2019 to $110 per kWh in 2024.
3.3. Vehicle-to-grid and second-life use
As charging networks expanded, managed charging became widespread. Clearer standards enabled pilots to use vehicle batteries for backup power and frequency regulation. Public buses, school buses, and city fleets can generate additional income while continuing their regular routes. The power grid benefits from an extra buffer. According to Table 2, V2G capacity will increase from 50 MW to 450 MW by 2025 [12].
3.4. End-user costs and adoption
Purchase subsidies lower the initial cost (Table 2). Tariff discounts and public-charging grants decrease the use-phase expenses. Time-of-use rates and demand response shift charging to cheaper hours. Grid load becomes more stable. The rules remain simple and straightforward, so adoption is faster. The table tracks four metrics—PV module efficiency, onshore wind turbine rating (MW), battery pack cost (USD/kWh), and enrolled V2G capacity (MW). PV efficiency and turbine size rise, battery costs fall, and V2G capacity grows, indicating steady performance gains and broader grid integration.
|
Year |
PV Module Efficiency (%) |
Onshore Wind Turbine Rating (MW) |
Battery Pack Cost (USD/kWh) |
Enrolled V2G Capacity (MW) |
|
2019 |
19.0 |
2.5 |
150 |
50 |
|
2020 |
19.6 |
2.7 |
145 |
90 |
|
2021 |
20.3 |
3.0 |
135 |
140 |
|
2022 |
21.0 |
3.3 |
128 |
220 |
|
2023 |
21.7 |
3.7 |
120 |
320 |
|
2024 |
22.5 |
4.0 |
110 |
450 |
4. The impact of new energy policies on energy consumption
Alleviating distribution network congestion and lowering marginal costs [13]. Adoption rates vary. Income, housing type, and the availability of charging stations at home or work all influence vehicle purchases and charging habits. Therefore, subsidies should be tired based on income, lack of home charging, and participation in managed charging. Community charging should be made available for rental and multi-family homes to improve equity and accessibility. Price performance will also evolve. U.S. wholesale electricity prices in 2024 are expected to be lower than in the previous two years, with reduced volatility. During the same period, prices for solar and wind power will increase, while coal power prices will decrease. This is driven by two factors: first, the direct effect of declining fuel costs; second, the price-lowering impact of changes in energy mix and marginal order, combined with reduced exposure to fossil fuel shocks—the "insurance value" of renewables. Retail bills may not align perfectly. Network costs, taxes, and policy surcharges will fluctuate independently. Europe already experienced a "wholesale-retail divergence" during the natural gas shock. For consumers, price stabilization and protection should go hand in hand: promoting two- or three-stage time-of-use electricity rates, establishing participation-based discounts, providing bill buffers for low-income users, supporting energy-efficient renovations for old homes, and increasing public charging stations in vulnerable areas.
5. Challenge
5.1. Supply chain and critical minerals
Regarding supply chains and critical minerals, the demand for lithium, nickel, cobalt, graphite, and rare earth elements—essential for batteries and electric motors—continues to grow, causing higher prices and supply uncertainties. Mining and refining projects tend to have long lifecycles, high compliance costs, and concentrated resource locations, which raises the risk of supply disruption. Opportunities exist in alternative and diversified material sources: for example, LFP and sodium-ion systems can lessen reliance on nickel and cobalt. Recycling and remanufacturing help recover lithium, nickel, cobalt, copper, and aluminum, reducing dependency on imports and enhancing resource efficiency. Large-scale, localized manufacturing can boost resilience and generate jobs [14].
5.2. Grid stability and system flexibility
Regarding grid stability and system flexibility, a high share of renewable energy raises the likelihood of short-term peaks and congestion; inadequate energy storage and demand response can worsen intraday fluctuations; and slow distributed access and grid connection queues can raise social costs . Opportunities are also evident: electrochemical energy storage, demand response, interregional interconnection, and advanced inverters can offer peak and frequency regulation; managed charging and V2G can turn vehicle batteries into dispatchable resources; and pricing flexibility in capacity and ancillary services can reduce average prices while ensuring reliability [15].
5.3. Policy coordination and market design
Regarding policy coordination and market design, RPS and carbon pricing may weaken each other's signals. Without a price floor or stable reserve, ETS price volatility might reduce long-term investment incentives. Empirical studies also indicate that without causal identification, the combined impacts of fuel and weather fluctuations can produce misleading conclusions. A lack of transparency in grid connection and transmission governance can also harm public acceptance. Opportunities include using competitive bidding and tiered tariff reductions to uncover true costs, linking demand-side subsidies to income levels and adjusting charging conditions to enhance efficiency and fairness. and promoting grid connection queue tiering, cost sharing, and performance assessments to reduce wind and solar curtailment.
5.4. Employment and skills transformation
Regarding employment and skills transformation, regions dependent on fossil fuels and related jobs face pressure to shrink and shift, impacting local finances. The opportunity lies in the rise of a new professional chain: constructing charging stations, transforming distribution networks, and operating and maintaining energy storage all require a range of talents in design, construction, dispatching, and safety management. Vocational education and standardized certification for electrification and digitalization can speed up skill development and improve mobility. Additionally, new materials and recycling industries can help foster localized manufacturing and regional employment.
6. Conclusion
First, both prices and risks are on the decline. US wholesale electricity prices in 2024 were lower than in 2022-2023 and experienced less volatility. During this period, solar and wind power generation grew, while coal-fired output decreased, aligning with falling natural gas prices and an increasing share of zero-marginal-cost sources. Renewable energy acts as an "insurance" against fuel shocks. Retail prices often diverge; network costs and policy add-ons can heavily influence bills. A "wholesale-retail divergence" occurred in Europe during gas shocks. Second, market structure is evolving. De-risking strategies and grid connection reforms have reduced entry barriers, spurring faster growth of independent developers, energy storage, and aggregators. Utilities are diversifying into flexibility and retail services, broadening revenue from "electricity" to "capacity-ancillary services-flexibility” When flexibility is limited, short-term extremities may still happen or intensify. Third, energy consumption continues to grow with notable disparities. In 2023, the global electric vehicle market reached about 14 million units, representing roughly 18% of the total, with further increases expected in 2024. The US has over 180,000 public charging stations, aiming for 500,000 by 2030 Adoption varies depending on income, housing type, and charging station access, with regional and demographic differences.
Flexibility pricing is essential to enable energy storage, demand response, and aggregated electric vehicles to achieve measurable and obtainable returns in energy, capacity, and ancillary services markets. On the demand side, tiered and dynamic subsidies should be introduced, linked with time-of-use or real-time electricity pricing, alongside safeguards to ensure affordability and effective signaling. Coordination between carbon pricing and clean allowances is essential, with measures like price floors or stabilization reserves to prevent conflicting investment signals. The expansion of transmission and distribution networks, along with reforms in grid connection, must be accelerated, using queue tiering, cost sharing, and performance assessments to reduce congestion and wind and solar power curtailment. Additionally, standards for V2G and managed charging—covering technical, communication, and metering aspects—should be improved, integrating decentralized batteries into capacity and ancillary services to better align pricing, reliability, and uptake.
References
[1]. Bistline, J.T., Binsted, M., Blanford, G., Creason, J., Doney, S.C., Fawcett, A.A. and Weyant, J.P. (2025) Policy implications of net-zero emissions: A multimodel analysis of United States emissions and energy system impacts. Energy & Climate Change, 6, 100191.
[2]. Cacciarelli, D., Pinson, P., Panagiotopoulos, F., Dixon, D. and Blaxland, L. (2025) Do we actually understand the impact of renewables on electricity prices? A causal inference approach. arXiv, 2501.10423.
[3]. International Energy Agency (2023) Renewables 2023: Analysis and forecast to 2028. International Energy Agency.
[4]. International Energy Agency (2024) Global EV Outlook 2024. International Energy Agency.
[5]. Knittel, C.R. and Tanaka, S. (2024) Challenges to expanding EV adoption and policy responses. MIT Center for Energy and Environmental Policy Research.
[6]. Lee, K. (2023) Renewable portfolio standards and electricity prices. Energy Economics, 126, 106959.
[7]. Liebensteiner, M., Ocker, F. and Abuzayed, A. (2025) High electricity prices despite expansion in renewables: How market trends shape Germany’s power market in the coming years. Energy Policy, 198, 114448.
[8]. Navia Simon, D. and Díaz Anadón, L. (2025) Power price stability and the insurance value of renewable technologies. Nature Energy, 10, 329–341.
[9]. Pavlík, M., Kurimský, F. and Ševc, K. (2025) Renewable energy and price stability: An analysis of volatility and market shifts in the European electricity sector (2015–2025). Applied Sciences, 15(12), 6397.
[10]. Peng, X., Sun, L., Feng, K., Chen, X. and Zhang, Y. (2024) Extent of global decarbonization of the power sector through energy policies and governance capacity. Communications Earth & Environment, 5, 321.
[11]. Šimaitis, J., Lupton, R., Vagg, C., Bouman, E.A., Hawkes, A. and Staffell, I. (2025) Battery-electric vehicles show the lowest carbon footprints among passenger cars across 1.5–3 °C decarbonisation pathways. Communications Earth & Environment, 6, 476.
[12]. Vehicle-to-Grid Integration Assessment Report. (2025) U.S. Department of Energy.
[13]. U.S. wholesale electricity prices were lower and less volatile in 2024. (2025) U.S. Energy Information Administration.
[14]. Wang, G., Sbai, E., Wen, L. and Sheng, M.S. (2024) The impact of renewable energy on extreme volatility in wholesale electricity prices: Evidence from OECD countries. Journal of Cleaner Production, 484, 144343.
[15]. Zaino, R., Ahmed, V., Alhammadi, A.M. and Alghoush, M. (2024) Electric vehicle adoption: A comprehensive systematic review of technological, environmental, organizational, and policy impacts. World Electric Vehicle Journal, 15(8), 375.
Cite this article
Liu,Z. (2025). Market Impacts of New Energy Policies: Prices, Competition, and Consumer Adoption. Advances in Economics, Management and Political Sciences,220,72-79.
Data availability
The datasets used and/or analyzed during the current study will be available from the authors upon reasonable request.
Disclaimer/Publisher's Note
The statements, opinions and data contained in all publications are solely those of the individual author(s) and contributor(s) and not of EWA Publishing and/or the editor(s). EWA Publishing and/or the editor(s) disclaim responsibility for any injury to people or property resulting from any ideas, methods, instructions or products referred to in the content.
About volume
Volume title: Proceedings of ICFTBA 2025 Symposium: Data-Driven Decision Making in Business and Economics
© 2024 by the author(s). Licensee EWA Publishing, Oxford, UK. This article is an open access article distributed under the terms and
conditions of the Creative Commons Attribution (CC BY) license. Authors who
publish this series agree to the following terms:
1. Authors retain copyright and grant the series right of first publication with the work simultaneously licensed under a Creative Commons
Attribution License that allows others to share the work with an acknowledgment of the work's authorship and initial publication in this
series.
2. Authors are able to enter into separate, additional contractual arrangements for the non-exclusive distribution of the series's published
version of the work (e.g., post it to an institutional repository or publish it in a book), with an acknowledgment of its initial
publication in this series.
3. Authors are permitted and encouraged to post their work online (e.g., in institutional repositories or on their website) prior to and
during the submission process, as it can lead to productive exchanges, as well as earlier and greater citation of published work (See
Open access policy for details).
References
[1]. Bistline, J.T., Binsted, M., Blanford, G., Creason, J., Doney, S.C., Fawcett, A.A. and Weyant, J.P. (2025) Policy implications of net-zero emissions: A multimodel analysis of United States emissions and energy system impacts. Energy & Climate Change, 6, 100191.
[2]. Cacciarelli, D., Pinson, P., Panagiotopoulos, F., Dixon, D. and Blaxland, L. (2025) Do we actually understand the impact of renewables on electricity prices? A causal inference approach. arXiv, 2501.10423.
[3]. International Energy Agency (2023) Renewables 2023: Analysis and forecast to 2028. International Energy Agency.
[4]. International Energy Agency (2024) Global EV Outlook 2024. International Energy Agency.
[5]. Knittel, C.R. and Tanaka, S. (2024) Challenges to expanding EV adoption and policy responses. MIT Center for Energy and Environmental Policy Research.
[6]. Lee, K. (2023) Renewable portfolio standards and electricity prices. Energy Economics, 126, 106959.
[7]. Liebensteiner, M., Ocker, F. and Abuzayed, A. (2025) High electricity prices despite expansion in renewables: How market trends shape Germany’s power market in the coming years. Energy Policy, 198, 114448.
[8]. Navia Simon, D. and Díaz Anadón, L. (2025) Power price stability and the insurance value of renewable technologies. Nature Energy, 10, 329–341.
[9]. Pavlík, M., Kurimský, F. and Ševc, K. (2025) Renewable energy and price stability: An analysis of volatility and market shifts in the European electricity sector (2015–2025). Applied Sciences, 15(12), 6397.
[10]. Peng, X., Sun, L., Feng, K., Chen, X. and Zhang, Y. (2024) Extent of global decarbonization of the power sector through energy policies and governance capacity. Communications Earth & Environment, 5, 321.
[11]. Šimaitis, J., Lupton, R., Vagg, C., Bouman, E.A., Hawkes, A. and Staffell, I. (2025) Battery-electric vehicles show the lowest carbon footprints among passenger cars across 1.5–3 °C decarbonisation pathways. Communications Earth & Environment, 6, 476.
[12]. Vehicle-to-Grid Integration Assessment Report. (2025) U.S. Department of Energy.
[13]. U.S. wholesale electricity prices were lower and less volatile in 2024. (2025) U.S. Energy Information Administration.
[14]. Wang, G., Sbai, E., Wen, L. and Sheng, M.S. (2024) The impact of renewable energy on extreme volatility in wholesale electricity prices: Evidence from OECD countries. Journal of Cleaner Production, 484, 144343.
[15]. Zaino, R., Ahmed, V., Alhammadi, A.M. and Alghoush, M. (2024) Electric vehicle adoption: A comprehensive systematic review of technological, environmental, organizational, and policy impacts. World Electric Vehicle Journal, 15(8), 375.