


1. Introduction
Air pollution, particularly PM2.5 (floating particles of size ≤ 2.5 μg/m³), is always considered harmful to public health and urban sustainability. In Shanghai, rapid industrialization and population growth have been associated with increased carbon emissions, leading to elevated levels of air pollutants, including PM2.5, PM10, and other hazardous gases. As shown in previous work, many cities in China, including Shanghai, have been suffering from one of the worst levels of air pollution in the world for the past ten years [1].
Long-term exposure to PM2.5 has been linked to elevated risks of respiratory and cardiovascular diseases [2].
So far, existing air pollution prediction models face two key challenges: (1) temporal complexity—PM2.5/PM10 levels exhibit seasonality and abrupt changes due to weather shifts; (2) data granularity—most studies rely on hourly data but ignore spatial correlations between monitoring stations. While some studies employ hybrid models (e.g., SVM with wavelet transforms), their computational costs limit real-world deployment.
This study aims to develop a deep learning framework based on LSTM (Long Short-Term Memory) and GRU (Gated Recurrent Unit) networks to predict daily PM2.5/PM10 concentrations in Shanghai within 60 days. The primary objectives are to compare the performance of LSTM and GRU in handling PM2.5’s and PM10’s temporal dynamics and to evaluate model robustness under extreme weather conditions (e.g., missing data in rainy days).
2. Theoretical background
Research on air quality prediction has evolved significantly over the past two decades, moving from traditional statistical models to advanced deep learning approaches. Autoregressive Integrated Moving Average (ARIMA) models have been widely applied to capture temporal trends but were found to struggle with nonlinear dynamics in atmospheric data [3]. Subsequently, machine learning methods such as Support Vector Machines (SVM) and Random Forests were employed to enhance nonlinear modeling capabilities, yet limitations in capturing long-term dependencies persisted [4].
With the rise of deep learning, Recurrent Neural Networks (RNN) introduced by Bengio, became prominent for air quality forecasting. RNNs introduced the capability to capture sequential dependencies, but it’s always difficult for them to handle vanishing gradients, which could result in poor predictions in long-range programs [5]. To overcome these limitations, Long Short-Term Memory (LSTM) networks were introduced by Hochreiter & Schmidhuber, together with explicit memory cells and a gating mechanism, allowing models to capture long-term dependencies effectively [6]. Similarly, Gated Recurrent Units (GRUs) were proposed as a streamlined alternative, achieving comparable accuracy with reduced parametric complexity and enabling faster training times for specific applications [7].
It is noted that recent studies have begun to apply these approaches to environmental forecasting. For instance, LSTM networks have demonstrated superior accuracy in predicting PM2.5 concentrations in Beijing compared to traditional machine learning models such as Random Forest [8]. Meanwhile, GRU-based models have exhibited notable efficiency in large-scale forecasting tasks, including flood and typhoon prediction, particularly under computational constraints [9].
However, most existing studies only focus on evaluating a single or a composite model rather than conducting direct comparisons under consistent conditions. More precisely, there is a lack of systematic, empirical comparisons between LSTM and GRU architectures with the same training dataset and interval of air pollution prediction, especially on accuracy, training efficiency, and generalization ability. This study aims to fill this gap by rigorously evaluating and contrasting the performance of LSTM and GRU models for predicting PM2.5 levels using a unified experimental framework. The findings will provide practical insights into model selection for environmental forecasting applications.
3. Methodology
This section details the methodology employed to compare the performance of LSTM and GRU models for air pollution prediction in Shanghai. The aim is to provide a clear and systematic explanation of the research process, enabling readers to understand the research logic and potentially reproduce the methods.
3.1. Problem formulation
The objective of this study is to develop and compare LSTM and GRU models for forecasting PM2.5/PM10 concentrations in Shanghai. The models were trained on historical data from January 1, 2014, to November 30, 2020, with the goal of predicting PM2.5 and PM10 concentrations from December 1, 2020, to January 30, 2021. The input data consists of historical PM2.5 concentrations, PM10 concentrations, meteorological data (temperature, humidity, wind speed, wind direction, and temporal features. The output is the predicted PM2.5 and PM10 concentrations for the subsequent time step. Key variables include, but are not limited to:
• PM2.5: PM2.5 concentration each day (μg/m³)
• PM10: PM10 concentration each day (μg/m³)
• Temperaturet: Average temperature each day (°C)
• Humidityt: Relative humidity each day (%)
• WindSpeedt: Average wind speed each day (m/s)
• WindDirectiont: Average wind direction each day (degrees)
The system assumes that PM2.5 and PM10 concentrations are influenced by past air quality levels, meteorological conditions, and temporal patterns.
3.2. Mathematical model / algorithm design
Two recurrent neural network architectures, LSTM and GRU, were employed for PM2.5 and PM10 prediction. Both models share a similar overall structure, each comprising three core recurrent layers and six total learnable layers (including dense layers). The key difference lies in the type of recurrent unit used; the single, crucial line that changes between the two models is the class used for the recurrent layers.
The LSTM model and GRU model are built with the following layers, respectively:
|
LayerType |
LSTM |
GRU |
Notes |
|
Input Layer |
Input Layer |
Input Layer |
|
|
Recurrent Layer 1 |
LSTM (256units) |
GRU (256units) |
Returns sequences (necessary to feed into the next recurrent layer) |
|
Recurrent Layer 2 |
LSTM (128units) |
GRU (128units) |
Returns sequences (necessary to feed into the next recurrent layer) |
|
Recurrent Layer 3 |
LSTM (64 units) |
GRU (64 units) |
Does not return sequences (outputs a single vector for the entire sequence) |
|
Dense (Hidden)1 |
Dense (32units) |
Dense (32units) |
Standard fully connected layer for further processing |
|
Dense (Hidden)2 |
Dense (16units) |
Dense (16units) |
Standard fully connected layer for further processing |
|
Output Layer |
Dense (2 units) |
Dense (2 units) |
Predicts two values:PM2.5 and PM10 |
|
Key Characteristic |
LSTM cells |
GRU cells |
GRUs are generally faster to train than LSTMs due to a simpler internal structure. |
As shown in Table 1, the only difference between the types of recurrent neural network architectures constitutes a perfectly controlled experiment. Any difference in performance (accuracy, training speed, final metrics) between the two resulting models can be attributed primarily to the inherent characteristics of the GRU and LSTM architectures themselves, rather than different architectures, data, or training procedures.
3.3. Data and parameters
The data used in this study were obtained from Kaggle, which is a prominent online platform for data science resources (Shanghai_air_pollution and weather 2014-2021) between January 1, 2014, and November 30, 2020 [10]. The goal of this is to predict PM2.5 and PM10 concentrations from December 1, 2020, to January 30, 2021, and compare them with the real values also provided by Kaggle.
Data Preprocessing: Missing values were handled using the time interpolation method. All input features were scaled to a range between 0 and 1 using the MinMaxScaler.
The Adam optimizer was used with a learning rate of 0.001 and a batch size of 64. The model was trained for 100 epochs, and early stopping was implemented with a patience of 10 epochs to prevent overfitting.
3.4. Implementation details
The LSTM and GRU models were implemented using Python 3.8 with the TensorFlow (2.17.0) and Keras (3.11.0) libraries. All experiments were conducted on a workstation with an Intel Core i7 processor and an NVIDIA GeForce RTX 2080 Ti GPU. The models were developed based on code files LSTM.py and GRU.py, respectively.
3.5. Evaluation metric and validation
The performance of the LSTM and GRU models was evaluated based on the following metrics:
|
Symbol of Indicator |
Equation of the Indicator |
Explanation of Indicators |
|
RMSE |
|
RMSE measures the average magnitude of the error, giving more weight to larger errors because errors are squared before averaging [11]. |
|
MAE |
|
MAE also measures the average magnitude of the error but treats all errors equally [11]. |
|
R² |
|
R2 measures the proportion of the variance in the actual data that is explained by the model. It tells how good the model is compared to just using the average [12]. |
4. Results
|
RMSE |
MAE |
MAPE |
R2 |
Bias |
Model |
Pollutant |
|
83.279 |
76.791 |
84.941 |
0.003 |
75.239 |
GRU |
PM2.5 |
|
49.269 |
40.903 |
48.103 |
0.003 |
35.275 |
LSTM |
PM2.5 |
|
31.977 |
28.584 |
75.031 |
0.060 |
26.265 |
GRU |
PM10 |
|
24.740 |
20.904 |
56.040 |
0.008 |
15.728 |
LSTM |
PM10 |
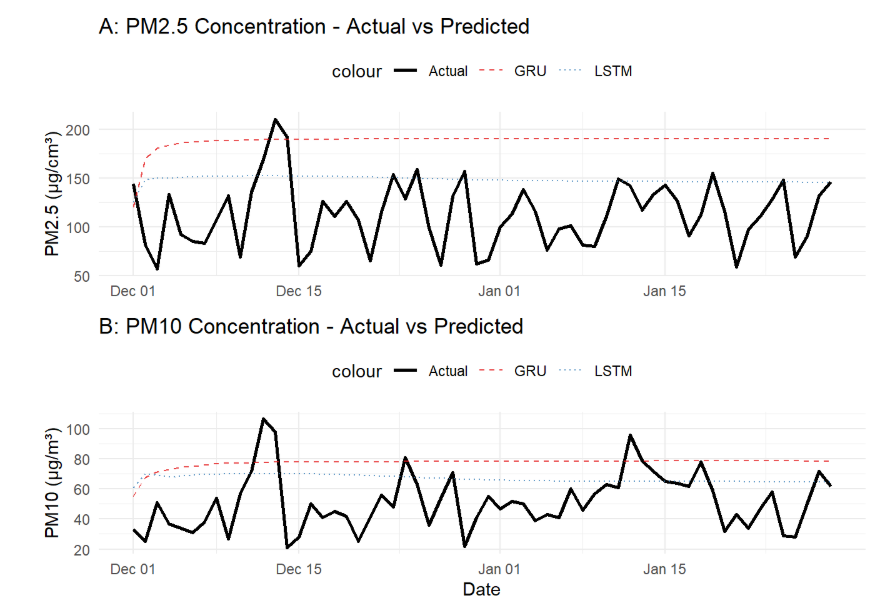
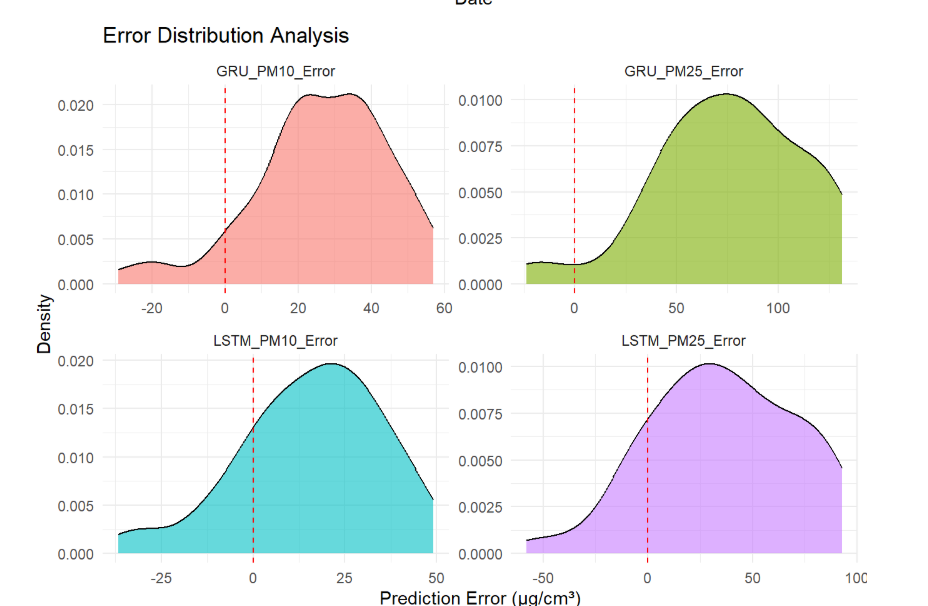
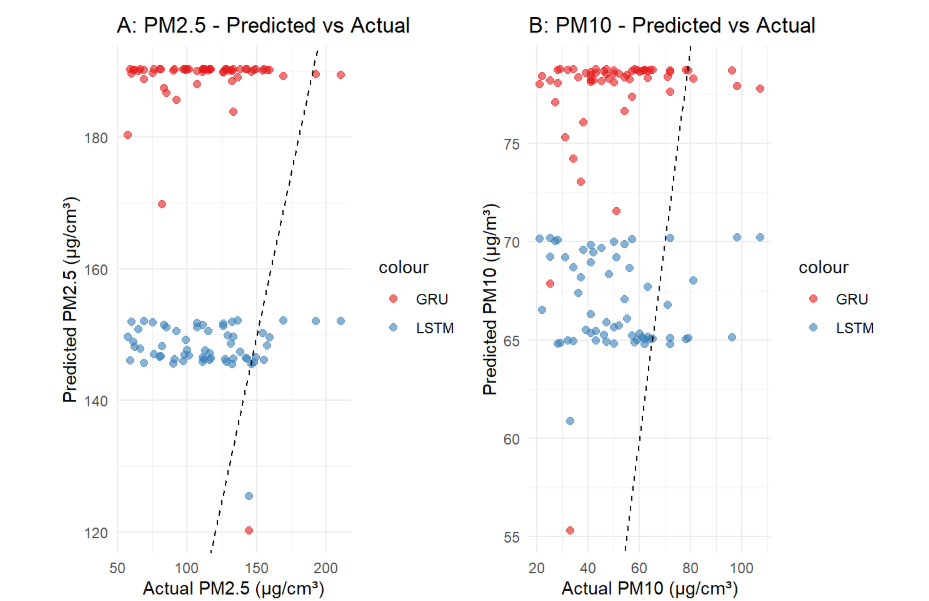
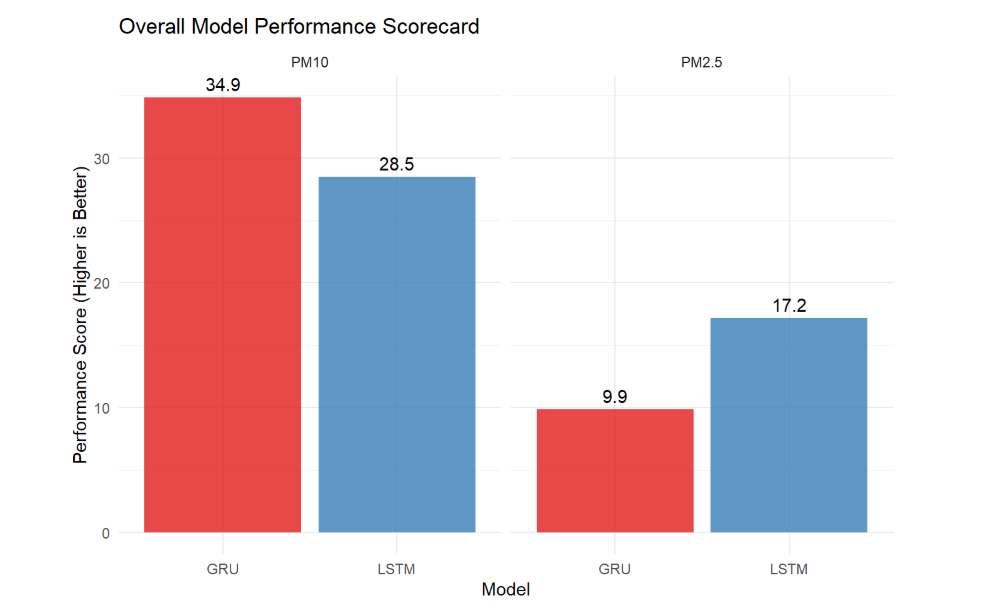
For air quality prediction in Shanghai, the LSTM model consistently outperforms the GRU model. As shown in Figure 1, LSTM predictions better capture the overall trends of actual pollution levels, while Figure 2 illustrates its more favorable error distribution with fewer extreme outliers. When examining the scatter plots in Figure 3, LSTM outputs are more concentrated along the 1:1 line, indicating predictions closer to reality, and this superiority is further reflected in the evaluation metrics of Figure 4, where LSTM achieves better performance for both PM2.5 and PM10. Using the error evaluation formulas in Table 2, the quantitative comparison in Table 3 demonstrates that reductions in RMSE and MAE achieved by LSTM are statistically significant, suggesting tangible benefits for early-warning systems and public health.
5. Discussion
The comparative analysis between GRU and LSTM models for air quality prediction in Shanghai reveals several important insights with broader implications for environmental forecasting. These findings demonstrate that LSTM architectures consistently outperform GRU models across multiple evaluation metrics, particularly in handling the complex temporal dependencies present in pollution data. This superiority can be attributed to LSTM's more sophisticated gating mechanism and separate cell state, which better captures long-range dependencies in atmospheric patterns—a finding consistent with recent studies on time series forecasting in environmental applications.
The systematic overprediction observed in both models, especially for lower concentration values, suggests current architectures struggle with the high variability and non-linear interactions characteristic of urban air pollution systems. This limitation highlights the need for more sophisticated feature engineering that incorporates real-time meteorological data, traffic patterns, and industrial activity indicators. Furthermore, the potential risk of underfitting to rare but critical scenarios could happen when models show difficulty in predicting extreme pollution events, which is a common challenge in environmental forecasting.
Within this predicting task, the LSTM model actually overperforms the GRU model, and here is a reasonable assumption of the reason. A key characteristic of urban air quality data is the presence of long-term dependencies and seasonal cycles, and PM2.5/PM10 concentrations are influenced by multi-day meteorological patterns (e.g., sustained periods of high pressure leading to stagnation), seasonal shifts in energy consumption (e.g., winter heating), and even transboundary transport of pollutants over several days. The LSTM model dedicated memory cell state, which acts as a constant-error carousel, is explicitly designed to preserve information over extended periods. This allows the LSTM to learn and remember these long-range, seasonal influencers more coherently.
In contrast, while the GRU is a powerful and efficient architecture, its simpler, combined gating mechanism (lacking a separate memory cell) may be more prone to losing subtle long-term signals amidst the noise of high-frequency, short-term fluctuations in the data (e.g., hourly wind shifts or traffic patterns). The GRU model’s strength lies in capturing shorter-term patterns, but for forecasting pollutants with strong seasonal and multi-day inertia, the LSTM model’s ability to decouple the cell state from the hidden state provides a distinct advantage in modeling these complex, long-range temporal dependencies.
Moreover, several promising research directions emerge from these findings. Hybrid approaches combining the temporal modeling capabilities of LSTMs with attention mechanisms could better capture both short-term fluctuations and seasonal patterns in pollution data. Additionally, integrating meteorological forecasting models with deep learning architectures might improve prediction accuracy during transitional weather conditions. The integration of explainable AI techniques would also be valuable for identifying key contributing factors to pollution events, providing actionable insights for urban planning and policy interventions.
So far, possible limitations within this study include the models' reliance on historical data without adequate consideration of real-time emission sources and the narrow geographical focus on Shanghai. Therefore, future research should explore transfer learning approaches to adapt these models to different urban environments. Moreover, it is also important to keep pushing comprehensive pollution monitoring every day to enrich the air pollution database.
6. Conclusion
This study has presented a comprehensive comparative analysis of LSTM and GRU neural network architectures, primarily judging by the different performance of predicting PM2.5 and PM10 concentrations in Shanghai, addressing a critical need for accurate air quality forecasting in urban environments. The research demonstrates the significant potential of deep learning approaches in capturing the complex temporal dynamics of atmospheric pollutants, in order to highlight the importance of architectural considerations for environmental forecasting applications.
The key finding of this work unequivocally establishes the superior performance of LSTM models over simplified GRU models, with a specific focus on air quality prediction tasks. This superiority, evidenced across multiple evaluation metrics including RMSE, MAE, and R-squared, can be attributed to LSTM's more sophisticated gating mechanism and separate cell state design, which better captures the long-range dependencies characteristic of atmospheric pollution patterns. Nevertheless, the systematic overprediction tendency observed in both models, particularly for lower concentration values, underscores the challenges in modeling the high variability and non-linear interactions inherent in composite air pollution systems.
Several important research gaps and future directions emerge from this work. The current models' reliance on historical data without adequate incorporation of real-time emission sources represents a significant limitation. Future research should explore several promising avenues, including: (1) the integration of meteorological prediction models to account for weather-pollution interactions; (2) the incorporation of spatial correlation data from multiple monitoring stations to capture urban pollution diffusion patterns; (3) multi-modal data fusion techniques that combine satellite remote sensing imagery with ground-level monitoring data for comprehensive spatial-temporal coverage. Additionally, the development of hybrid architectures that combine the temporal modeling capabilities of LSTM with attention mechanisms, graph neural networks (for modeling spatial dependencies), and transfer learning approaches could enhance model performance across diverse urban environments. The implementation of explainable AI techniques would further bridge the gap between predictive accuracy and actionable insights for environmental policy and urban planning decisions.
This study contributes to the growing body of literature on intelligent environmental monitoring systems and provides a foundation for developing more robust air quality forecasting frameworks that can be adapted to various urban contexts worldwide.
References
[1]. Han S, Sun B. Impact of population density on PM2.5 concentrations: A case study in Shanghai, China. Sustainability. 2019; 11(7): 1968. doi: 10.3390/su11071968.
[2]. Guo J, et al. Long-term exposure to particulate matter on cardiovascular and respiratory diseases in low- and middle-income countries: A systematic review and meta-analysis. Front Public Health. 2023; 11: 1134341. doi: 10.3389/fpubh.2023.1134341.
[3]. Agarwal A, Sahu M. Forecasting PM2.5 concentrations using statistical modeling for Bengaluru and Delhi regions. Environ Monit Assess. 2023; 195(4): 502. doi: 10.1007/s10661-023-11045-8. PMID: 36949261.
[4]. Pozo-Luyo CA, Cruz-Duarte JM, Amaya I, Ortiz-Bayliss JC. Forecasting PM2.5 concentration levels using shallow machine learning models on the Monterrey Metropolitan Area in Mexico. Atmos Pollut Res. 2023; 14(11): 101898. doi: 10.1016/j.apr.2023.101898.
[5]. Bengio Y, Simard P, Frasconi P. Learning long-term dependencies with gradient descent is difficult. IEEE Trans Neural Netw. 1994; 5(2): 157-66. doi: 10.1109/72.279181.
[6]. Hochreiter S, Schmidhuber J. Long short-term memory. Neural Comput. 1997; 9(8): 1735-80. doi: 10.1162/neco.1997.9.8.1735. PMID: 9377276.
[7]. Cho K, van Merriënboer B, Gulcehre C, Bahdanau D, Bougares F, Schwenk H, Bengio Y. Learning phrase representations using RNN encoder–decoder for statistical machine translation. arXiv. 2014. arXiv: 1406.1078.
[8]. Li X, Peng L, Yao X, Cui S, Hu Y, You C, Chi T. Long short-term memory neural network for air pollutant concentration predictions: Method development and evaluation. Environ Pollut. 2017; 231(Pt 1): 997-1004. doi: 10.1016/j.envpol.2017.08.114.
[9]. Chen C, Li B, Zhang H, Zhao M, Liang Z, Li K, An X. Performance enhancement of deep learning model with attention mechanism and FCN model in flood forecasting. J Hydrol. 2025; 658: 133221. doi: 10.1016/j.jhydrol.2025.133221.
[10]. Kaggle. Shanghai Air Pollution and Weather Dataset (2014–2021) [Dataset]. Retrieved August 1, 2025, from https: //www.kaggle.com/datasets/meetnagadia/shanghai-air-pollution-and-weather
[11]. Hodson T O. Root-mean-square error (RMSE) or mean absolute error (MAE): when to use them or not. Geoscientific Model Development. 2022; 15: 5481–5487. doi: 10.5194/gmd-15-5481-2022.
[12]. Gao J. R-Squared (R2) – How much variation is explained? Research Methods in Medicine & Health Sciences. 2023; 5(4): 104-109. doi: 10.1177/26320843231186398
Cite this article
Ren,Y. (2025). Comparative Analysis of LSTM and GRU Models for Air Pollution Prediction in Shanghai. Advances in Economics, Management and Political Sciences,224,14-22.
Data availability
The datasets used and/or analyzed during the current study will be available from the authors upon reasonable request.
Disclaimer/Publisher's Note
The statements, opinions and data contained in all publications are solely those of the individual author(s) and contributor(s) and not of EWA Publishing and/or the editor(s). EWA Publishing and/or the editor(s) disclaim responsibility for any injury to people or property resulting from any ideas, methods, instructions or products referred to in the content.
About volume
Volume title: Proceedings of ICFTBA 2025 Symposium: Data-Driven Decision Making in Business and Economics
© 2024 by the author(s). Licensee EWA Publishing, Oxford, UK. This article is an open access article distributed under the terms and
conditions of the Creative Commons Attribution (CC BY) license. Authors who
publish this series agree to the following terms:
1. Authors retain copyright and grant the series right of first publication with the work simultaneously licensed under a Creative Commons
Attribution License that allows others to share the work with an acknowledgment of the work's authorship and initial publication in this
series.
2. Authors are able to enter into separate, additional contractual arrangements for the non-exclusive distribution of the series's published
version of the work (e.g., post it to an institutional repository or publish it in a book), with an acknowledgment of its initial
publication in this series.
3. Authors are permitted and encouraged to post their work online (e.g., in institutional repositories or on their website) prior to and
during the submission process, as it can lead to productive exchanges, as well as earlier and greater citation of published work (See
Open access policy for details).
References
[1]. Han S, Sun B. Impact of population density on PM2.5 concentrations: A case study in Shanghai, China. Sustainability. 2019; 11(7): 1968. doi: 10.3390/su11071968.
[2]. Guo J, et al. Long-term exposure to particulate matter on cardiovascular and respiratory diseases in low- and middle-income countries: A systematic review and meta-analysis. Front Public Health. 2023; 11: 1134341. doi: 10.3389/fpubh.2023.1134341.
[3]. Agarwal A, Sahu M. Forecasting PM2.5 concentrations using statistical modeling for Bengaluru and Delhi regions. Environ Monit Assess. 2023; 195(4): 502. doi: 10.1007/s10661-023-11045-8. PMID: 36949261.
[4]. Pozo-Luyo CA, Cruz-Duarte JM, Amaya I, Ortiz-Bayliss JC. Forecasting PM2.5 concentration levels using shallow machine learning models on the Monterrey Metropolitan Area in Mexico. Atmos Pollut Res. 2023; 14(11): 101898. doi: 10.1016/j.apr.2023.101898.
[5]. Bengio Y, Simard P, Frasconi P. Learning long-term dependencies with gradient descent is difficult. IEEE Trans Neural Netw. 1994; 5(2): 157-66. doi: 10.1109/72.279181.
[6]. Hochreiter S, Schmidhuber J. Long short-term memory. Neural Comput. 1997; 9(8): 1735-80. doi: 10.1162/neco.1997.9.8.1735. PMID: 9377276.
[7]. Cho K, van Merriënboer B, Gulcehre C, Bahdanau D, Bougares F, Schwenk H, Bengio Y. Learning phrase representations using RNN encoder–decoder for statistical machine translation. arXiv. 2014. arXiv: 1406.1078.
[8]. Li X, Peng L, Yao X, Cui S, Hu Y, You C, Chi T. Long short-term memory neural network for air pollutant concentration predictions: Method development and evaluation. Environ Pollut. 2017; 231(Pt 1): 997-1004. doi: 10.1016/j.envpol.2017.08.114.
[9]. Chen C, Li B, Zhang H, Zhao M, Liang Z, Li K, An X. Performance enhancement of deep learning model with attention mechanism and FCN model in flood forecasting. J Hydrol. 2025; 658: 133221. doi: 10.1016/j.jhydrol.2025.133221.
[10]. Kaggle. Shanghai Air Pollution and Weather Dataset (2014–2021) [Dataset]. Retrieved August 1, 2025, from https: //www.kaggle.com/datasets/meetnagadia/shanghai-air-pollution-and-weather
[11]. Hodson T O. Root-mean-square error (RMSE) or mean absolute error (MAE): when to use them or not. Geoscientific Model Development. 2022; 15: 5481–5487. doi: 10.5194/gmd-15-5481-2022.
[12]. Gao J. R-Squared (R2) – How much variation is explained? Research Methods in Medicine & Health Sciences. 2023; 5(4): 104-109. doi: 10.1177/26320843231186398