


1. Introduction
Ocean warming, a critical aspect of global climate change, results from anthropogenic greenhouse gas emissions, bearing profound implications for marine biodiversity and ecosystem services [1]. The Intergovernmental Panel on Climate Change (IPCC) reports a notable rise in Earth’s surface temperature, now surpassing 1.1°C above pre-industrial levels, with far-reaching effects on the climate system [2]. This concerning temperature elevation extends beyond higher temperatures, significantly impacting various aspects of the climate system [3,4].
The increase in sea surface temperature (SST) by approximately +0.7°C has triggered more frequent marine heatwaves, disrupting ocean circulation and contributing to a loss of marine biodiversity [5-8]. Furthermore, ocean warming drives rising sea levels, heightening vulnerabilities for coastal areas, with the global mean sea level presently experiencing an acceleration of about 0.084 mm per year squared [1]. Marine ecosystems confront challenges from ocean heatwaves’ risingthe heightened frequency, intensity, and duration of ocean heatwaves [6,9]. These heatwaves have prompted shifts in species towards polar regions and are projected to reduce tropical diversity [1]. These changes, coupled with ocean acidification and deoxygenation, present severe threats to marine organisms, altering physiological traits, compromising habitat viability, and reshaping species distributions [10-12].
Understanding marine organisms’ response to warming is vital for mitigating impacts on marine ecosystems [13], necessitating a comprehensive understanding of physical and biogeochemical processes within the marine environment. The Nutrient-Phytoplankton-Zooplankton-Detritus (NPZD) models serve as crucial predictive tools [14-16].
NPZD models form the fundamental framework for comprehending interactions and feedback between biotic and abiotic components in the marine ecosystem [16]. Nutrient dynamics, phytoplankton productivity, zooplankton energy transfer, and detritus’ role in nutrient recycling are vital for the health and resilience of marine ecosystems [17, 18]. Phytoplankton constitute the foundation of marine food webs and play a crucial role in carbon sequestration through photosynthesis [19]. Zooplankton, consuming phytoplankton, are pivotal in transferring energy from primary producers to higher trophic levels [20]. Furthermore, detritus, organic matter produced when phytoplankton dies and sinks to deeper ocean layers, aids in nutrient recycling through bacterial utilization and dissolved organic nitrogen degradation [19]. However, warming poses a threat to these components, potentially disrupting the equilibrium of marine ecosystems [5].
The Coupled Model Intercomparison Project Phase 6 (CMIP6) aims to comprehend the Earth system’s response to external forces and assess forthcoming climate changes in diverse scenarios [21]. It has introduced an advanced framework for climate projections by integrating new shared socioeconomic pathways (SSP) and enhancing model resolutions [21]. These scenarios offer valuable insights into plausible climate and socioeconomic trajectories, contributing to our comprehension of future climate radiative forcing levels [21]. Compared to its precursor, CMIP5, CMIP6 represents a notable advancement, showcasing enhanced spatial resolution and refined physical parameterizations [22]. Projections from CMIP6 indicate increased climate sensitivity, resulting in more pronounced warming compared to previous CMIP5 models under equivalent radiative forcing conditions [5,23].
In this study, we utilize the CMIP6 framework to forecast and interpret the repercussions of climate-related factors on marine ecosystems, employing NPZD model variables as a focal point. Our analysis endeavors to elucidate how climate drivers influence marine ecosystems, providing insights into the potential ecological consequences of global warming. Subsequent sections will delineate the methodologies utilized, present our findings, and delve into the broader implications for conserving marine biodiversity.
2. Methods
To comprehensively assess model performance, we utilized two advanced models: the Community Earth System Model version 2 with Whole Atmosphere Community Climate Model (CESM2-WACCM) and the Geophysical Fluid Dynamics Laboratory Earth System Model version 4 (GFDL-ESM4). Both models integrate NPZD variables crucial for understanding marine ecosystem responses to environmental shifts. Our analysis encompassed a range of physical and biogeochemical variables to identify potential drivers influencing oceanic impacts on marine ecosystems under varying radiative forcing scenarios.
For a thorough evaluation of global ocean spatial patterns, we divided the spatial domain into four major regions: the North Pacific (30ºN–70ºN, 140ºE–120ºW), the North Atlantic (30ºN–70ºN, 60ºW–0ºE), the Tropical Ocean (10ºS–10ºN, 180ºE–80ºW), and the Southern Ocean (70ºS–30ºS, 0ºE–0ºW). This regional segmentation was designed to reflect distinct geographic characteristics and enhance the assessment of model performance in simulating crucial ecosystem variables within the upper ocean strata (0-100 m). The selection accounts for biological carbon pump regions, particularly focusing on areas with significant chlorophyll a presence.
For the analysis of long-term trends, we conducted a comparative study using historical model outputs compared against present conditions and future projections. Our examination spanned three distinct time frames: the historical pre-industrial baseline (1891–1910), a contemporary reference period (1995–2014), and two future projections (2081–2100) aligned with the Shared Socioeconomic Pathways (SSPs) — SSP1-2.6, indicating a low-warming scenario, and SSP5-8.5, representing a high-warming scenario.
Table 1. Comparison of Parameters Used in Oceanic Simulations by the CESM2-WACCM and GFDL-ESM4 Models.
Model | Physical | Nutrient | Phytoplankton | Zooplankton | Detritus | Simulations |
CESM2-WACCM | SST, pH, Delta PCO2 | Iron, Nitrate, Phosphorus, Ammonium, Silicon | Total Phytoplankton Chlorophyll,Diatom Chlorophyll,Primary Carbon Production by Phytoplankton | Zooplankton Carbon Concentration | Dissolved Organic Carbon, Downward Flux of Particle Organic Carbon | Historical, SSP 1-2.6, SSP 5-8.5 |
GFDL-ESM4 | SST, pH, Delta PCO2 | Iron, Nitrate, Phosphorus, Ammonium, Silicon | Total Phytoplankton Chlorophyll,Diatom Chlorophyll,Primary Carbon Production by Phytoplankton | Zooplankton Carbon Concentration | Dissolved Organic Carbon, Downward Flux of Particle Organic Carbon | Historical, SSP 1-2.6, SSP 5-8.5 |
3. Results
3.1. Climatological State
A comprehensive assessment of the CESM2-WACCM and GFDL-ESM4 models has revealed intricate interplays between marine biogeochemical and physical processes. The simulation data unequivocally illustrate the substantial impact of global climate changes on oceanic physicochemical properties and biological productivity. As illustrated in Figure 1, both models delineate contrasting trends in oceanic parameters from 1850 to 2100, reflecting distinct global warming scenarios.
Both the CESM2-WACCM and GFDL-ESM4 models predict an escalation in sea surface temperature (SST), with a more pronounced rise under the SSP5-8.5 scenario compared to the SSP1-2.6 scenario. Specifically, the CESM2-WACCM model indicates an SST increase of 11.03% under SSP1-2.6 and 26.36% under SSP5-8.5. Conversely, the GFDL-ESM4 model forecasts a more moderate SST increase of 5.97% for SSP1-2.6 and 16.52% for SSP5-8.5.
Both scenarios predict a decline in surface pH levels, signaling heightened ocean acidification. This reduction is quantified at 1.97% for both models under SSP1-2.6 and at 6.22% for CESM2-WACCM and 6.09% for GFDL-ESM4 under SSP5-8.5.
Nitrate (NO3) concentrations are expected to decrease under warming scenarios. The CESM2-WACCM model predicts reductions of 19.62% under SSP1-2.6 and 26.38% under SSP5-8.5, while the GFDL-ESM4 model projects decrease of 9.27% and 17.30% for the respective scenarios. Additionally, the models exhibit varying trends for iron (Fe) concentrations. CESM2-WACCM anticipates a 0.87% reduction under SSP1-2.6 and a 4.66% increase under SSP5-8.5. Conversely, GFDL-ESM4 consistently projects increase of 0.87% and 11.00% across the scenarios. These discrepancies highlight potential uncertainties within the models, particularly concerning the iron cycle.
Both models project a decrease in phytoplankton populations, with more pronounced reductions under SSP5-8.5: 16.91% in CESM2-WACCM and 17.93% in GFDL-ESM4. For SSP1-2.6, CESM2-WACCM predicts a 4.29% decrease, while GFDL-ESM4 anticipates a 7.55% decline. Similarly, zooplankton carbon is expected to decrease, with CESM2-WACCM and GFDL-ESM4 estimating reductions of 7.48% and 18.42% under SSP5-8.5, respectively. Under SSP1-2.6, these reductions are more moderate, at 1.35% for CESM2-WACCM and 7.31% for GFDL-ESM4. Projections for primary production (PP) show divergent trends between the models, with CESM2-WACCM expecting slight increases of 2.04% for SSP1-2.6 and a marginal rise of 0.18% for SSP5-8.5. Conversely, GFDL-ESM4 projects a substantial decrease of 16.09% under SSP5-8.5.
The downward flux of particulate organic carbon (epc100) is also anticipated to decline across various scenarios: 1.03% for CESM2-WACCM and 6.80% for GFDL-ESM4 under SSP1-2.6, and 5.80% and 16.71%, respectively, under SSP5-8.5. These projections underscore the potential adverse effects of global warming on marine ecosystems. The results highlight the critical necessity to comprehend variations in nutrient cycles, marine productivity, and plankton dynamics in response to climate change.

Figure 1. Temporal trend of oceanic parameters under various climate change scenarios from the CESM and GFDL models. (a) Sea surface temperature (SST), (b) pH, (c) Nitrate (NO3) concentration, (d) Iron (Fe) concentration, (e) Phytoplankton biomass, (f) Primary Production (PP), (g) Zooplankton carbon, and (h) Down flux of particle organic carbon concentration. Solid and dashed lines represent the predictions from the CESM and GFDL models, respectively, with different color coding for various warming scenarios. The solid and dotted vertical line represents the historical pre-industrial era (1910) and the recent year (2014). Units are ℃, mol/m3, mol/m3, mol/m3/s, mol/m3, mol/m2/s.
3.2. Physiochemical Environment
Both the CESM2-WACCM and GFDL-ESM4 models exhibit consistent spatial patterns of warming, as illustrated in Figure 2. This figure delineates the geographic trends of annual average temperature changes across the global upper oceans during three critical periods. Notably, the CESM2-WACCM model projects a more pronounced increase in sea surface temperature (SST) compared to the GFDL-ESM4, particularly under the SSP5-8.5 scenario. For the North Pacific (NP) and Tropical Ocean (TO) regions, the warming scenarios indicate the most substantial temperature rises. Under the SSP1-2.6 scenario, there’s an average SST rise of 1.81°C (CESM) and 1.30°C (GFDL) in NP, and 2.35°C (CESM) and 1.94°C (GFDL) in TO. Conversely, the more intense SSP5-8.5 scenario suggests greater warming, with increases of approximately 5.18°C (CESM) and 3.30°C (GFDL) in NP, and 6.26°C (CESM) and 4.25°C (GFDL) in TO. These translate to growth rates of 40.22% and 27.84% in NP, and 23.79% and 16.29% in TO, respectively.
In contrast to the general warming patterns observed in other oceanic regions, the North Atlantic (NA) presents a more subdued warming trend. Under the SSP1-2.6 scenario, the CESM model indicates a decrease of 0.21°C, equivalent to a 1.48% reduction, while the GFDL model projects an increase of 0.60°C (4.62%). For the SSP5-8.5 scenario, the CESM model suggests a relatively modest increase of 3.42°C, or 23.82%, and the GFDL model forecasts a 2.44°C increase, representing an 18.76% enhancement. The NA region is affected by the “warming hole” phenomenon, where cooling trends are observed due to a decline in the Atlantic meridional overturning circulation, resulting in reduced ocean heat transport to this area [24].
In the Southern Ocean (SO), steady warming trends prevail across both models, notably pronounced in CESM under SSP5-8.5, with projections indicating a rise of nearly 4.48°C from the 1910 benchmark, a significant 52.39% increase. CESM SSP1-2.6 forecasts a 2.15°C increase (25.15%), while GFDL SSP1-2.6 anticipates 0.95°C (10.62%), and GFDL SSP5-8.5 foresees a 2.71°C rise (30.33%).
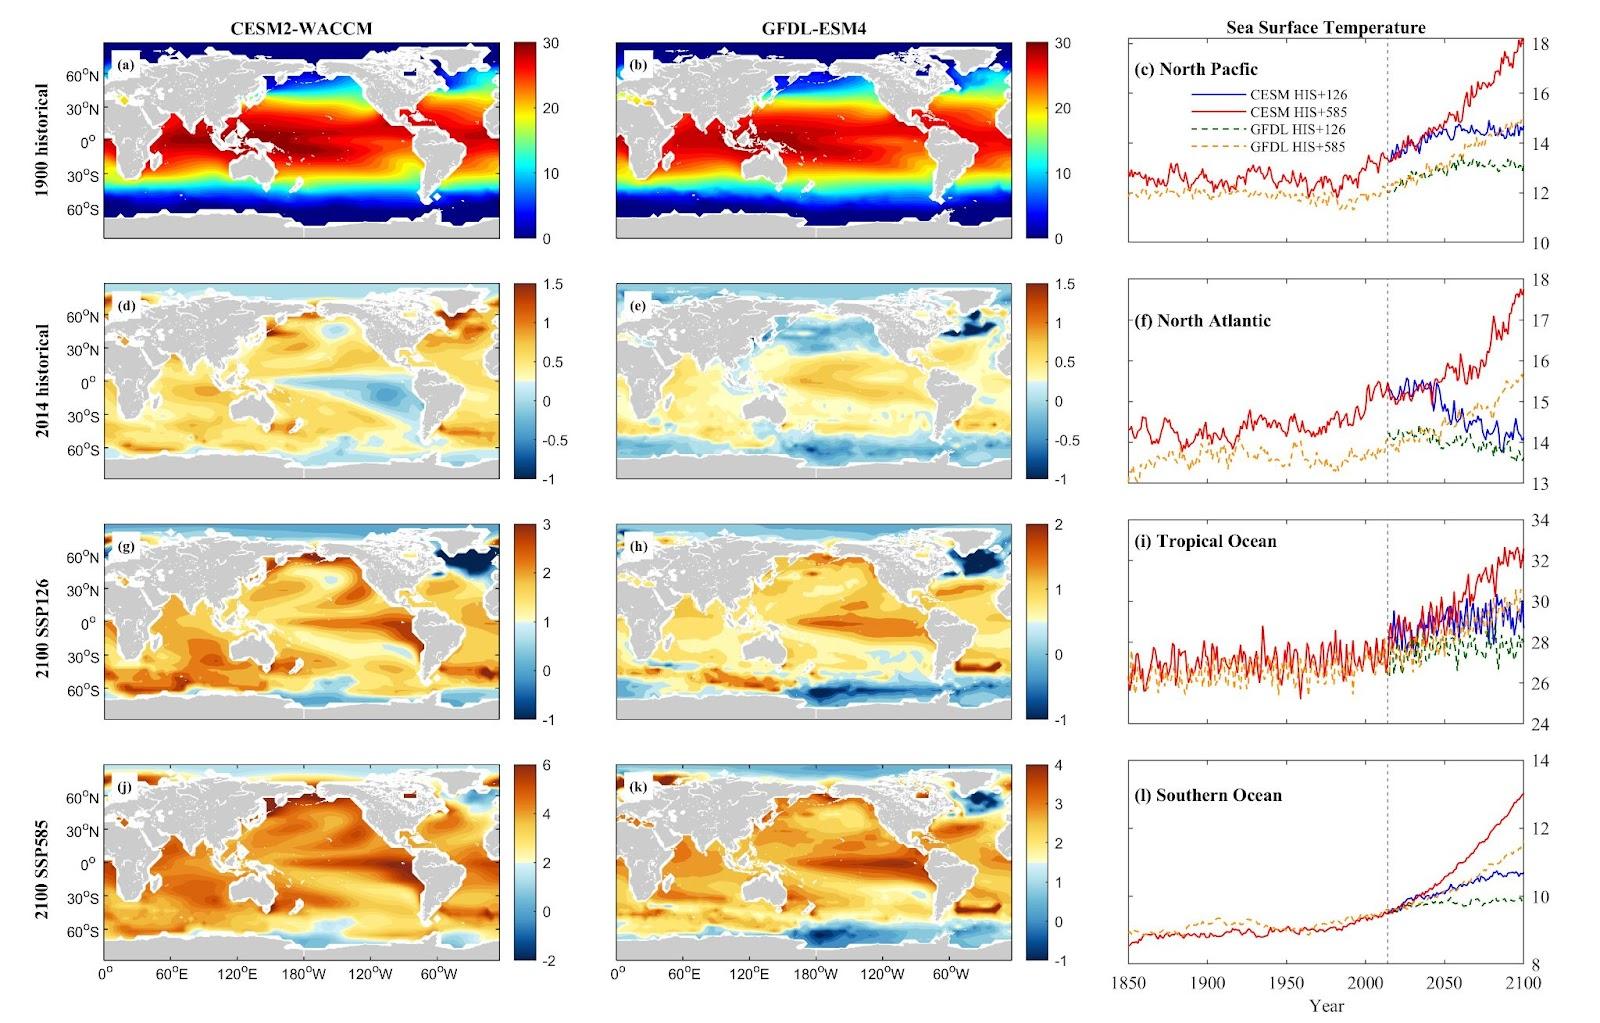
Figure 2. Mean projected changes of sea surface temperature (SST) from CESM2-WACCM and GFDL-ESM4 climate models. Units are ℃.
Surface pH levels across all four major oceanic regions are projected to decrease. Both models exhibit similar reduction patterns, with multi-model average pH declines ranging from approximately 0.14 to 0.19 units for the SSP1-2.6 scenario (1.68% to 2.32%) and 0.44 to 0.55 units for the SSP5-8.5 scenario (5.44% to 6.76%). The most significant decrease is observed in the NA region, where the CESM SSP5-8.5 model predicts a decline of 0.55 units (6.76%) and the GFDL SSP5-8.5 model indicates a 0.53-unit decrease (6.43%). Conversely, the TO region shows the smallest decline, with both SSP1-2.6 and SSP5-8.5 scenarios from both models projecting decreases of 0.14 units and 0.44 units, respectively (1.68% and 5.44%).

Figure 3. Mean projected changes of surface pH levels from CESM2-WACCM and GFDL-ESM4 climate models.
Delta PCO2 (ΔpCO2) across the four major ocean regions display diverse responses to distinct climate scenarios. In the NP, both CESM and GFDL simulations consistently depict a decrease in ΔpCO2 across all scenarios, notably more pronounced under SSP5-8.5. Specifically, CESM SSP1-2.6 shows a decrease of 16.97%, while GFDL SSP1-2.6 indicates an 8.77% drop. This downward trend intensifies remarkably under SSP5-8.5, with CESM displaying a significant decrease of 123.80% and GFDL presenting a remarkable reduction of 424.91%.
In TO, the CESM model demonstrates a decline in both scenarios, with a decrease of 4.30% for SSP1-2.6 and a substantial drop of 117.12% for SSP5-8.5. Conversely, the GFDL model shows a mixed response, with a slight increase of 3.39% for SSP1-2.6 and an 86.63% decrease for SSP5-8.5.
The NA, stands out with an increasing trend in ΔpCO2. CESM SSP1-2.6 indicates a 37.97% increase, and GFDL SSP1-2.6 exhibits a 46.18% increase. The rise in ΔpCO2 in NA under SSP1-2.6 is expected to be more substantial compared to SSP5-8.5. CESM SSP5-8.5 shows a minimal rise of 1.55%, while GFDL SSP5-8.5 predicts a decrease of 36.47%. The SO experiences the most significant reductions in ΔpCO2 across all scenarios, with a 577.82% reduction under the CESM SSP5-8.5 model.

Figure 4. Mean projected changes of Delta PCO2 from CESM2-WACCM and GFDL-ESM4 climate models. Units are Pa.
3.3. Nutrients and Trace Elements
Nutrient concentrations, including nitrate (NO3), phosphate (PO4), silicon (Si), and ammonium (NH4), vary by nutrient type and area in the North Pacific (NP), North Atlantic (NA), Tropical Ocean (TO), and Southern Ocean (SO). CESM simulations generally predict a more substantial decrease in dissolved inorganic nutrient concentrations across these oceanic zones compared to GFDL simulations. In the NP, both CESM and GFDL models forecast a downward trend for NO3, PO4, and Si, with more significant decreases under the SSP5-8.5 scenario compared to SSP1-2.6. However, NH4 concentrations deviate from this pattern, showing an increase of 5.60% projected under SSP5-8.5 in CESM simulations.
In NA and TO, marked reductions in NO3 and PO4 are observed in both models. Si exhibits a more distinct decrease in CESM than in GFDL. NH4 shows divergent trends, with GFDL predicting an increase (29.43% under SSP5-8.5) in NA, while CESM projects a decrease (37.07% under SSP1-2.6). In TO, both models forecast a decrease in NH4 levels under warmer scenarios. The SO demonstrates more pronounced reductions in NO3, PO4, and Si concentrations, while NH4 shows an increasing trend.
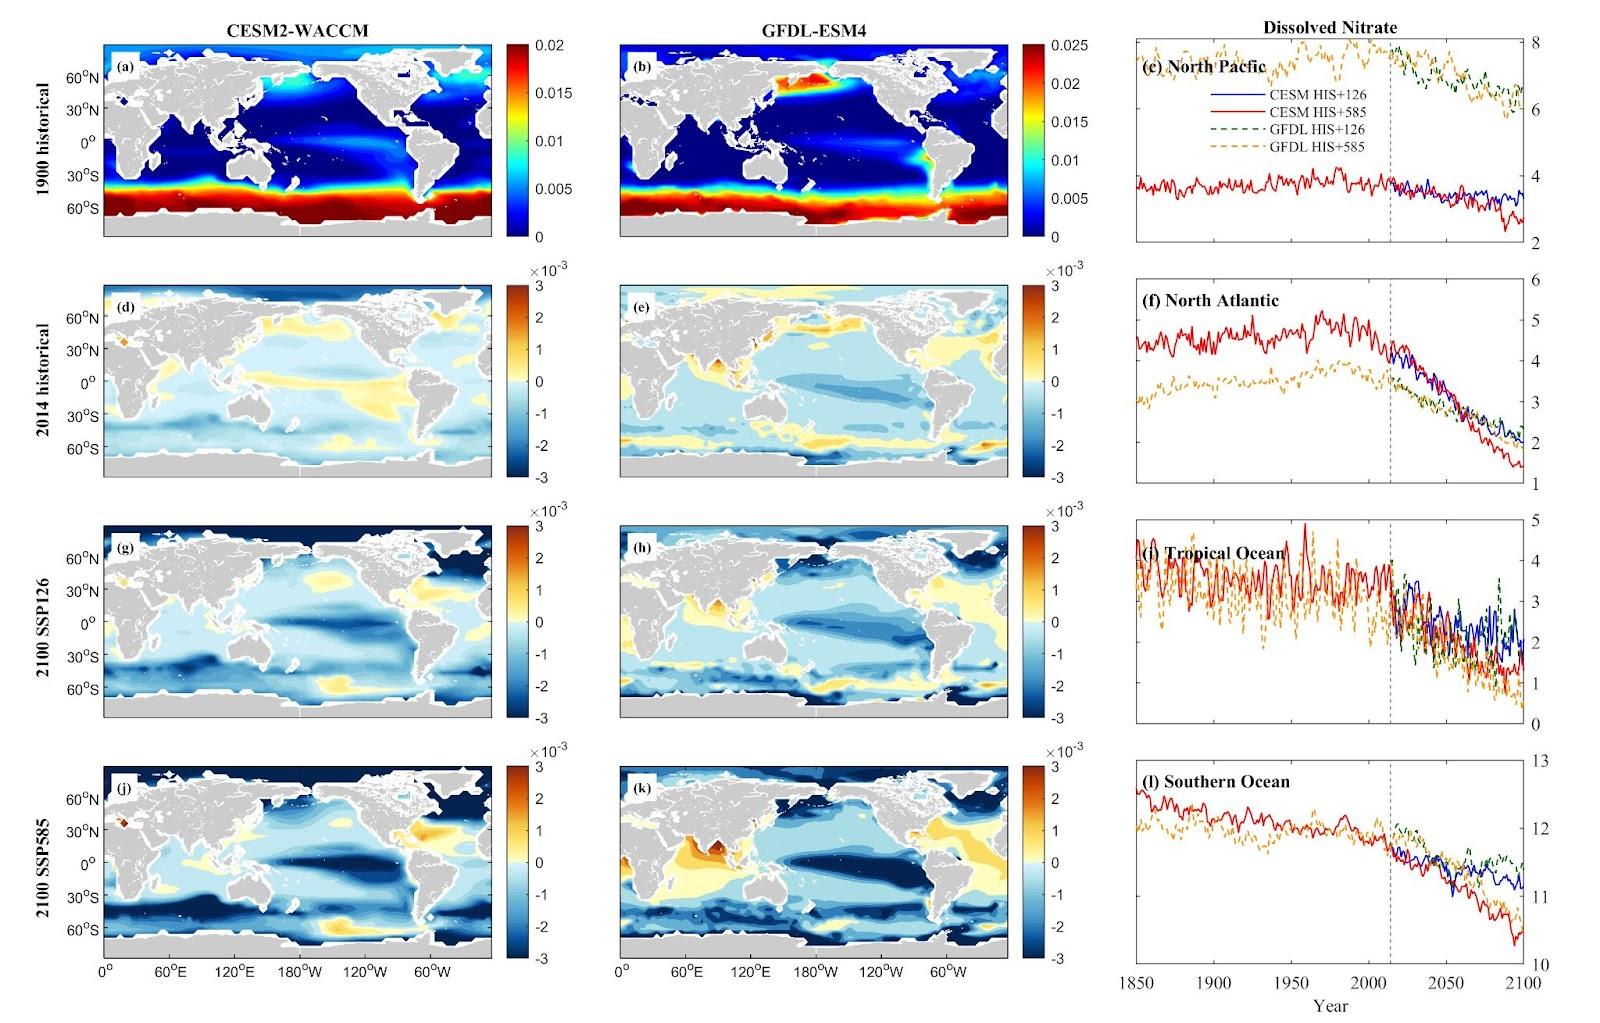
Figure 5. Mean projected changes of dissolved inorganic nitrate concentration from CESM2-WACCM and GFDL-ESM4 climate models. Units are mol/m3.
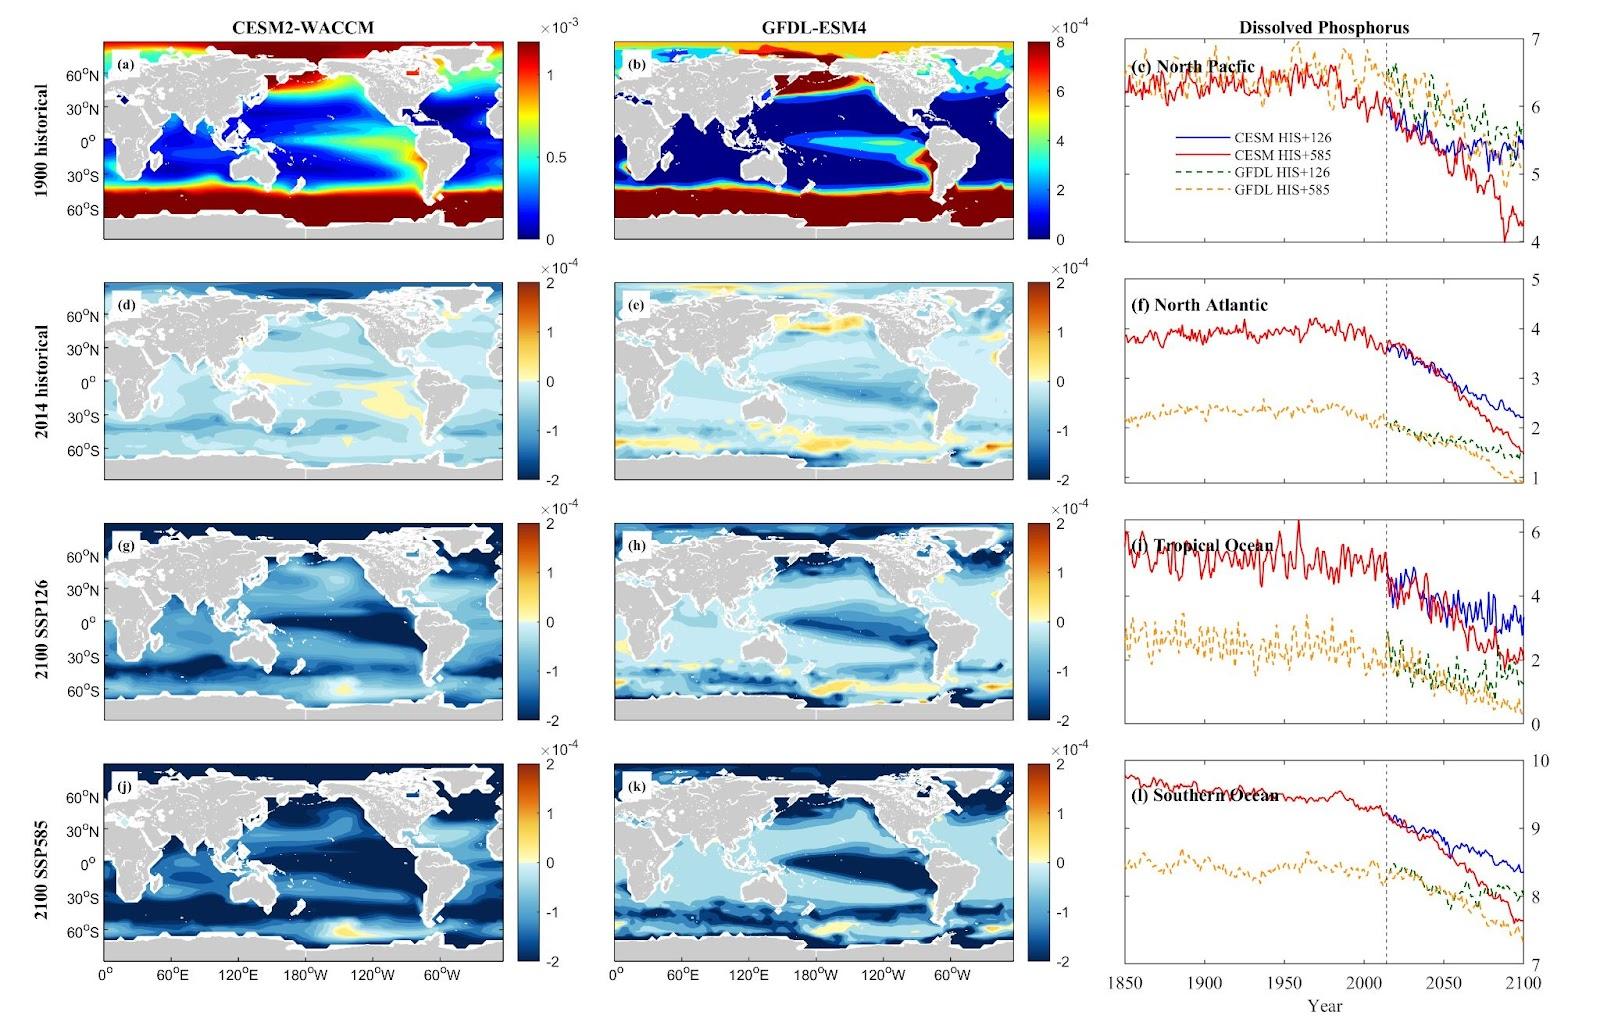
Figure 6. Mean projected changes of dissolved inorganic phosphorus concentration from CESM2-WACCM and GFDL-ESM4 climate models. Units are mol/m3.

Figure 7. Mean projected changes of dissolved inorganic silicon concentration from CESM2-WACCM and GFDL-ESM4 climate models. Units are mol/m3.
Figure 8. Mean projected changes of dissolved inorganic ammonium concentration from CESM2-WACCM and GFDL-ESM4 climate models. Units are mol/m3.
Iron (Fe) concentrations, as projected by the CESM model, are generally higher across most regions, suggesting anticipation of increased iron levels in these oceanic areas under the specified scenarios. The trends in iron concentration changes in the northern hemisphere exhibit fluctuations within a specific range. Iron concentrations in NP are anticipated to rise, with CESM projecting increases of 0.32% under SSP 1-2.6 and 6.56% under SSP 5-8.5, while GFDL forecasts a 1.03% increase under SSP 1-2.6 and a 0.75% decrease under SSP 5-8.5. In NA, iron concentrations are projected to decrease, with CESM indicating a decline of 0.69% under SSP 1-2.6 and 1.92% under SSP 5-8.5. GFDL projects a 0.66% decrease under SSP 1-2.6 and a 3.28% increase under SSP 5-8.5. TO and SO are expected to undergo substantial increases in iron levels. Notably, the TO demonstrates the most considerable increase, with both CESM and GFDL models projecting remarkable rises of 66.35% and 87.58%, respectively, under the SSP5-8.5 scenario. These nutrient and iron trends are more accentuated under the SSP5-8.5 scenario in the CESM model, highlighting the model’s heightened sensitivity to changing environmental conditions.
Figure 9. Mean projected changes of dissolved inorganic iron concentration from CESM2-WACCM and GFDL-ESM4 climate models. Units are mol/m3.
3.4. Plankton Communities
Both the CESM and GFDL models project a consistent pattern of regional decline in the spatial distribution of phytoplankton biomass, particularly at higher latitudes. In the NP and NA, significant decreases in phytoplankton biomass are anticipated. CESM projects a 7.73% decrease under SSP 1-2.6 and a 19.09% decrease under SSP 5-8.5 in NP, while GFDL forecasts a slight increase of 1.17% under SSP 1-2.6 and 0.72% under SSP 5-8.5 in the same region. In the NA, CESM anticipates a dramatic 61.59% decrease under SSP 1-2.6 and a 75.43% decrease under SSP 5-8.5, whereas GFDL suggests an 18.84% decrease under SSP 1-2.6 and a 36.67% decrease under SSP 5-8.5.
In the TO and SO, variability exists. The CESM model occasionally predicts increases in phytoplankton biomass in these regions, with notable variations. For instance, CESM forecasts a 55.28% increase under SSP 1-2.6 in TO but a 25.59% decrease under SSP 5-8.5. In contrast, GFDL generally forecasts a decrease, showing a 10.72% decrease under SSP 1-2.6 and a 39.89% decrease under SSP 5-8.5 in TO. For the SO, CESM projects increases of 14.65% under SSP 1-2.6 and 23.25% under SSP 5-8.5, while GFDL shows a negligible 0.04% decrease under SSP 1-2.6 and a 4.34% decrease under SSP 5-8.5.
Figure 10. Mean projected changes of phytoplankton chlorophyll concentration from CESM2-WACCM and GFDL-ESM4 climate models. Units are mol/m3.
Regarding diatom biomass in the NP and NA, both models indicate reductions, aligning with the declining trend of phytoplankton. However, in the TO and SO, the CESM model occasionally indicates an increase in diatom biomass, showing significant variations. For instance, CESM forecasts an 84.87% increase under SSP 1-2.6 in TO but a 41.96% decrease under SSP 5-8.5. Conversely, GFDL suggests a 22.68% decrease under SSP 1-2.6 and a 53.09% decrease under SSP 5-8.5 in TO. In the SO, CESM projects a 24.91% increase under SSP 1-2.6 and a 49.31% increase under SSP 5-8.5, while GFDL forecasts a slight 0.09% decrease under SSP 1-2.6 and a 1.09% decrease under SSP 5-8.5.
Figure 11. Mean projected changes of diatom chlorophyll concentration from CESM2-WACCM and GFDL-ESM4 climate models. Units are mol/m3.
The regional differences between high and low latitudes further emphasize the disparity in primary production change ratios. The NA and NP witness a decline in primary production, SO demonstrates an increasing trend in primary production. In the NP, the CESM model projects a decrease of 2.84% under SSP 1-2.6 and 2.10% under SSP 5-8.5, while the GFDL model indicates an increase of 3.81% under SSP 1-2.6 and 8.63% under SSP 5-8.5. Contrarily, the NA experiences a significant decrease in primary production according to the CESM model, showing a 51.43% decrease under SSP 1-2.6 and a 64.16% decrease under SSP 5-8.5. The GFDL model also predicts a decrease, albeit less severe, with a 21.08% decrease under SSP 1-2.6 and a 42.91% decrease under SSP 5-8.5. In the TO, the CESM model forecasts a 41.32% increase under SSP 1-2.6 and a 6.63% increase under SSP 5-8.5. In contrast, the GFDL model projects a 5.34% decrease under SSP 1-2.6 and a 30.43% decrease under SSP 5-8.5. Meanwhile, the SO experiences a CESM model increase of 16.77% under SSP 1-2.6 and 29.26% under SSP 5-8.5, while the GFDL model shows a 2.88% increase under SSP 1-2.6 and a 1.94% decrease under SSP 5-8.5.

Figure 12. Mean projected changes of primary production from CESM2-WACCM and GFDL-ESM4 climate models. Units are mol/m3/s.
Zooplankton carbon trends, though less pronounced compared to phytoplankton biomass, remain notably significant. In both the NP and NA, substantial declines are predicted by both models. However, TO and SO display considerable variability. The CESM model shows fluctuations in the TO, with a 9.32% increase under SSP 1-2.6 but a 7.21% decrease under SSP 5-8.5. Conversely, the GFDL model indicates more consistent decreases, with a 9.51% decline under SSP 1-2.6 and a steeper 32.57% decrease under SSP 5-8.5 in the TO. In the SO, the CESM model forecasts a 3.89% increase under SSP 1-2.6 and a 3.60% increase under SSP 5-8.5, while the GFDL model anticipates a 0.42% increase under SSP 1-2.6 and a 5.92% decrease under SSP 5-8.5.
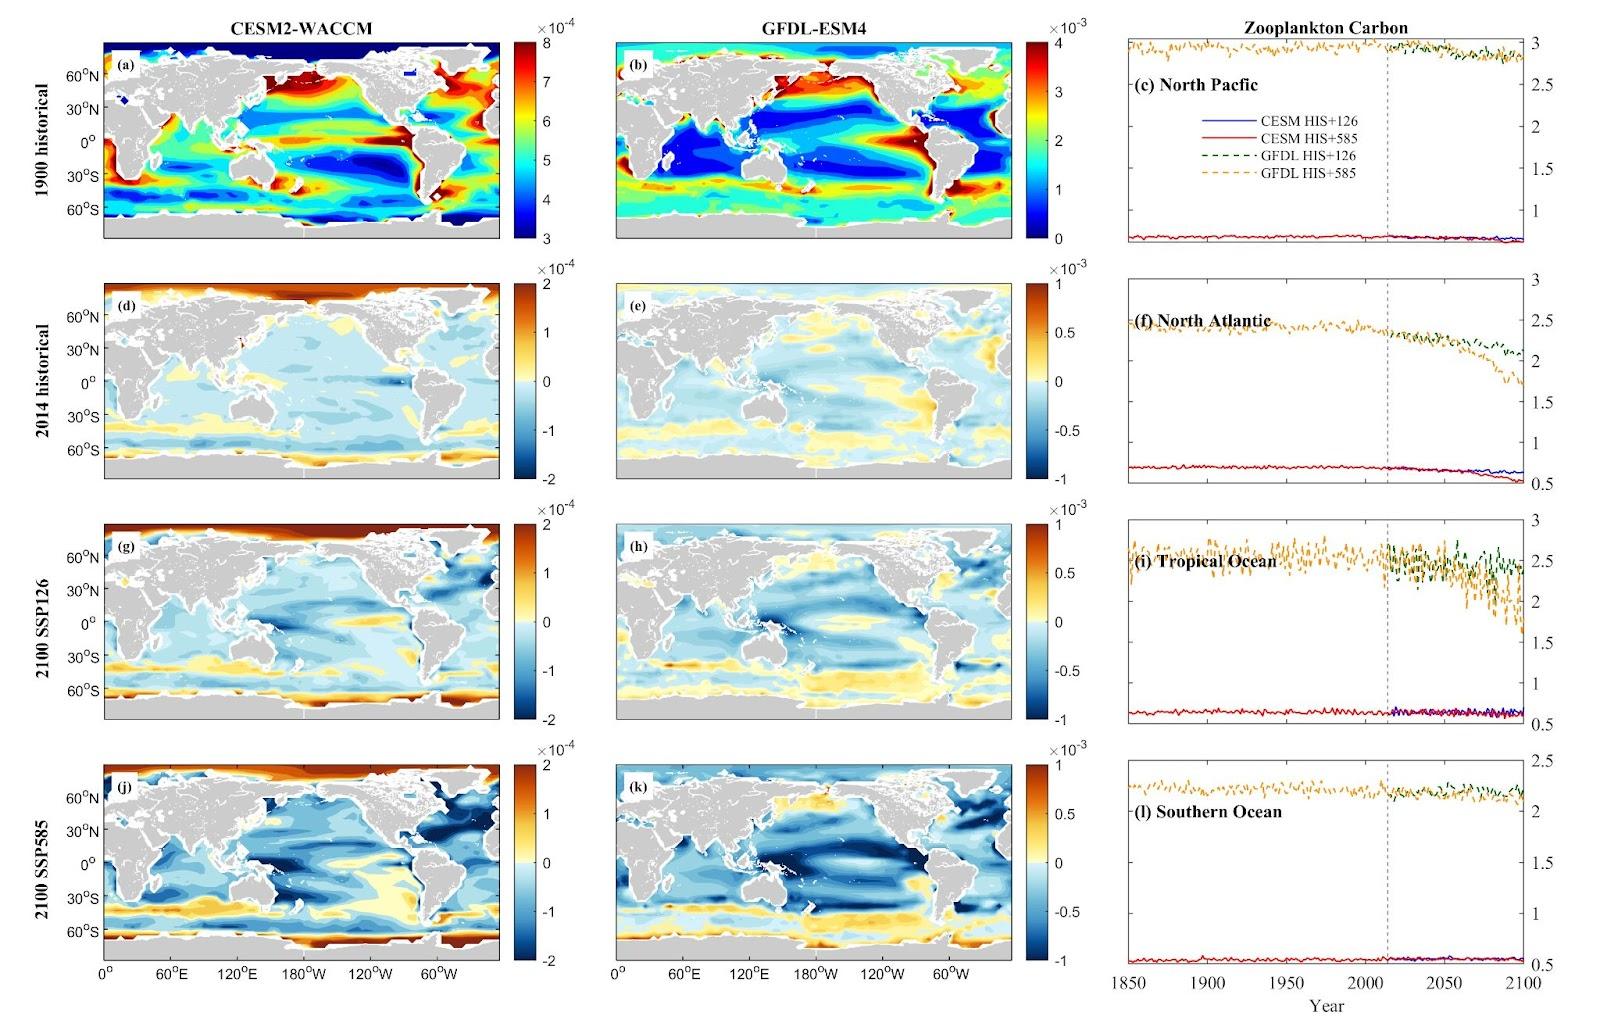
Figure 13. Mean projected changes of zooplankton carbon from CESM2-WACCM and GFDL-ESM4 climate models. Units are mol/m3.
3.5. Detritus
The CMIP6 models’ projections for Dissolved Organic Carbon (DOC) and particle organic carbon flux (detritus) illustrate distinct spatial responses across oceanic regions. In the North Pacific and Tropical Ocean, consistent increases in DOC are observed. The CESM model projects rises of 2.76% and 10.25% for SSP1-2.6 and SSP5-8.5 in the NP, and 6.35% and 17.67% in the TO. Meanwhile, the GFDL model forecasts increases of 0.38% and 5.33% for the NP, and 4.65% and 2.77% for TO under the same scenarios. However, the North Atlantic presents a contrasting trend, with the CESM indicating increases of 2.17% and 5.93%, while the GFDL suggests a decrease of 4.18% and an increase of 2.77% under SSP1-2.6 and SSP5-8.5, respectively. The Southern Ocean displays the most significant increases in DOC, with the CESM projecting rises of 6.52% and 12.34%, and the GFDL indicating 3.34% and 10.37% increases for SSP1-2.6 and SSP5-8.5, respectively. Notably, CESM demonstrates more evident changes than GFDL.
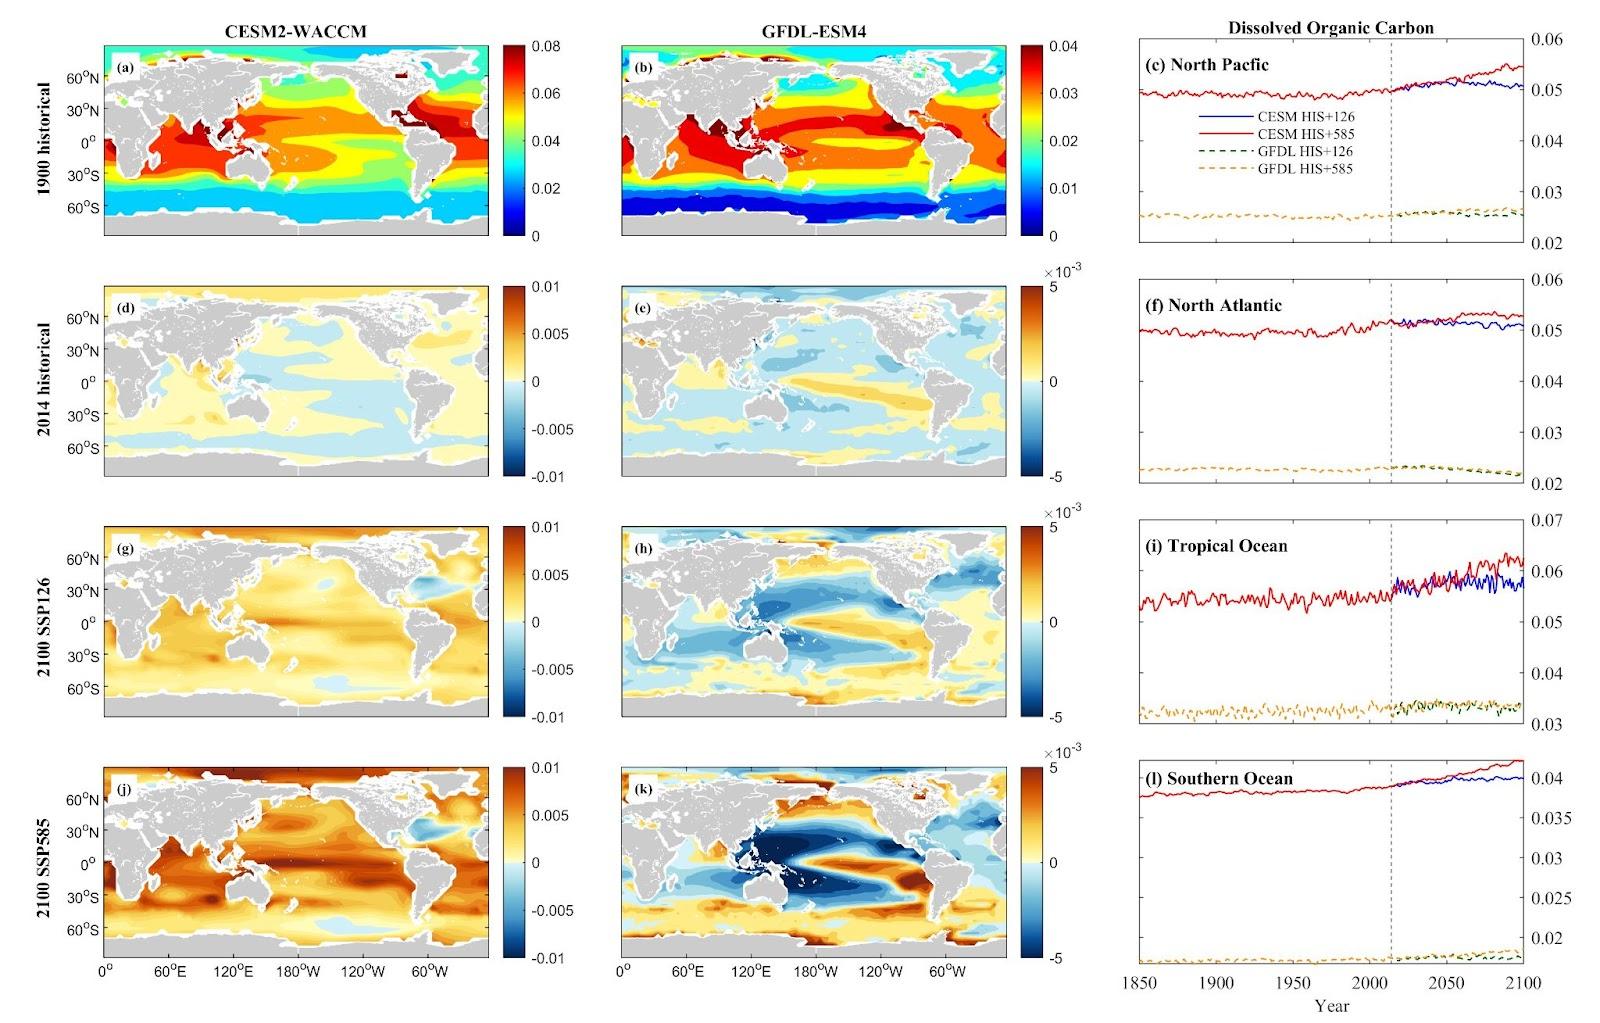
Figure 14. Mean projected changes of dissolved organic carbon concentration from CESM2-WACCM and GFDL-ESM4 climate models. Units are mol/m3.
The downward flux of particle organic carbon (epc 100) exhibits varied trends across regions. In the NP and NA, declines are anticipated. CESM projects decreases of 1.77% and 5.63% in NP, and 40.11% and 52.30% in NA for SSP1-2.6 and SSP5-8.5, respectively. GFDL predicts reductions of 1.28% and 4.52% in NP, and 21.20% and 35.03% in NA under the respective scenarios. The TO displays variability between models and scenarios. CESM suggests a 24.34% increase in TO under SSP1-2.6 but a 2.62% decrease under SSP5-8.5, while GFDL anticipates decreases of 7.26% and 25.78%. Conversely, the epc 100 shows an increase in the SO, with CESM forecasting rises of 11.63% and 18.35%, whereas GFDL expects a decrease of 0.80% under SSP1-2.6 and a 7.89% decrease under SSP5-8.5.
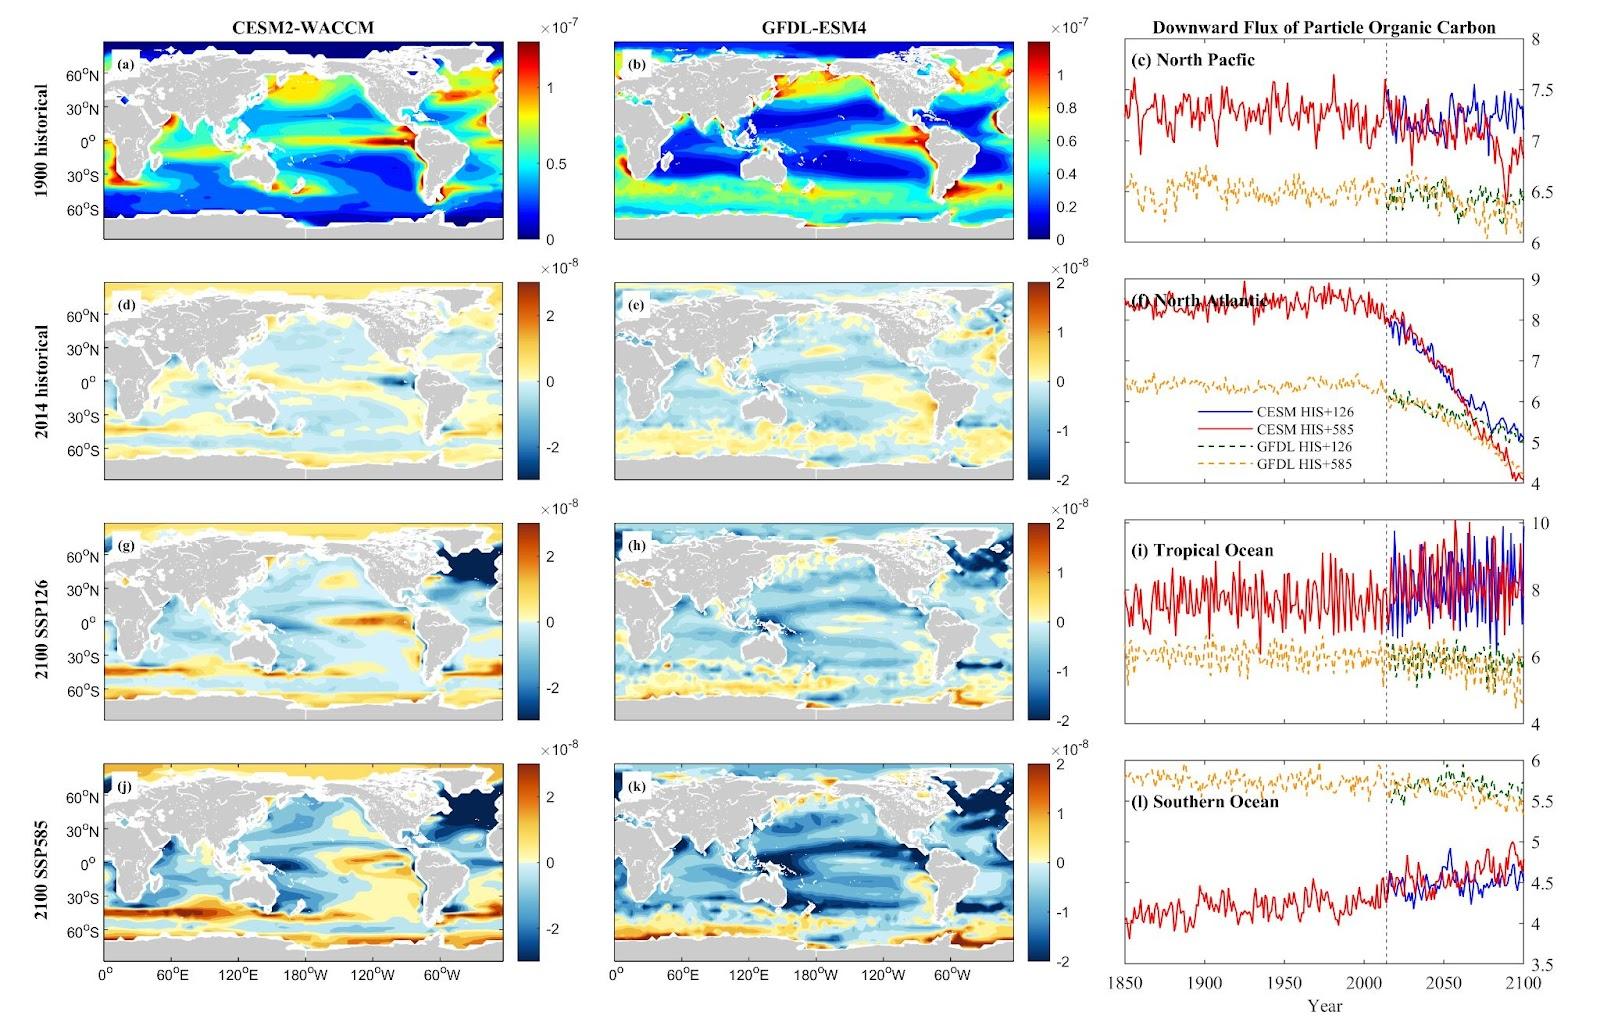 Figure 15. Mean projected changes of down flux of particle organic carbon concentration from CESM2-WACCM and GFDL-ESM4 climate models. Units are mol/m2/s.
These diverse patterns in DOC and detritus flux among regions emphasize the intricate interactions between climate change scenarios and oceanic carbon cycles, signaling potential ramifications for nutrient recycling and carbon sequestration processes, notably in the NA and SO regions.
4. Discussion
Our study reveals the significant impact of climate change on the climatology, physiochemical environment, and plankton communities of the world’s oceans. Various studies have indicated an accelerating rate of SST increase. While all regions experience effects, the nature and extent of changes vary. The North Pacific and Tropical Ocean are projected to experience substantial temperature rises, contrasting with the North Atlantic, which might cool due to the “warming hole” phenomenon. Notably, the overall SST change in the Atlantic, Pacific, and Indian Oceans from 1950 to 2009 ranged around 0.3–0.6 °C as per AR5 Climate Change 2014: Impacts, Adaptation, and Vulnerability [25]. Forecasts suggest an SST increase of 0.5°C until 2030, surpassing 1°C by 2050 compared to the 1995-2014 increase [26]. In contrast, the North Atlantic experiences minimal warming trends in SST attributed to the decline in Atlantic Meridional Overturning Circulation [27]. Recent reports [28,29] have also warned of swift SST warming’s detrimental impact on aquatic life. Our analysis emphasizes the intricate and region-specific responses of global warming to SST, aligning with previous literature. It can be inferred that global warming will manifest rapidly and heterogeneously across diverse oceanic regions.
Across the four major oceanic regions, projections indicate a decline in key nutrients like nitrate, phosphate, and silicon, while ammonium exhibits an increasing trend, notably in the Southern Ocean. Expectations generally point toward a reduction in phytoplankton biomass and primary production, with the North Atlantic potentially experiencing the most significant impact. The Tropical Ocean, however, might encounter more variability and fluctuations in this regard. Interestingly, the Southern Ocean anticipates an increase in phytoplankton, potentially propelled by rising ammonium levels despite an overall decrease in nutrients. Predictions suggest detritus trends will parallel those of phytoplankton biomass and zooplankton carbon, decreasing in the North Atlantic and increasing in the Southern Ocean. However, the models show less clarity regarding changes in zooplankton, emphasizing the necessity for further research to comprehensively comprehend these dynamics. These observed contrasting responses in high-latitude zones and the Southern Ocean, coupled with the Tropical Ocean’s variability, underscore the intricate and diverse nature of oceanic ecosystems and their susceptibility to environmental changes.
Across these regions, nutrients like nitrate, phosphate, and silicon are expected to decline due to ocean surface warming induced by global warming, leading to stratification and reduced nutrient supply [30]. This stratification inhibits ocean upwelling, preventing nutrient-rich cold water from reaching the ocean surface, thereby reducing nitrate, phosphate, and silicon levels [31,32]. Notably, ammonium concentrations are on the rise in the Southern Ocean, accumulating at the ocean surface due to increased heterotrophic ammonium production and higher nitrification rates [33,34]. Iron concentration exhibits more variability across regions, showing increased levels in the Tropical Ocean due to the macronutrient’s limitation on phytoplankton growth, causing decreased biological iron uptake [35,36].
Anticipations suggest a general decline in phytoplankton biomass and primary production, with the North Atlantic potentially facing the most substantial impact. Phytoplankton growth heavily relies on nutrient concentration. [37] observed a fivefold increase in phytoplankton growth by elevating nitrogen concentration. Additionally, [38] demonstrated an enhanced growth rate of phytoplankton by augmenting the concentration of limiting nutrients, regardless of surface irradiation. The expected nutrient deficiency might lead to reduced phytoplankton biomass and primary production. However, the Tropical Ocean could encounter more variability and fluctuations. Conversely, the Southern Ocean anticipates an increase in phytoplankton, possibly due to elevated ammonium levels despite an overall nutrient reduction.
Detritus trends are forecasted to align with variations in plankton abundance and distribution, decreasing in the North Atlantic and increasing in the Southern Ocean. Alterations in phytoplankton abundance and distribution can significantly influence detritus processes. Phytoplankton serve as major CO2 sinks, absorbing nearly one-third of anthropogenic CO2 into their cellular structure and converting it into organic carbon [39]. The organic matter produced by phytoplankton either sustains higher trophic levels or is transported to deeper ocean layers through processes such as vertical sinking [40]. Changes in community composition impact the rate at which particles sink, thereby affecting the amount of carbon transported to the deep ocean [41].
The models exhibit fewer discernible changes in zooplankton, emphasizing the necessity for further research to comprehensively understand these dynamics. The observed contrasting responses in high-latitude areas and the Southern Ocean, coupled with the Tropical Ocean’s variability, underscore the intricate and diverse nature of oceanic ecosystems and their susceptibility to environmental changes.
The escalating SST, widespread ocean acidification, and shifts in nutrient concentrations serve as pivotal elements reshaping marine ecosystems [42]. These changes trigger a cascade effect on the biomass of phytoplankton and zooplankton, fundamental components of marine food webs [43]. The diversity in responses observed across various oceanic regions emphasizes the need for customized conservation and adaptation strategies. Furthermore, alterations in plankton communities and nutrient cycling could carry extensive implications for fisheries and global food security.
In essence, enhancing the resilience of marine ecosystems and safeguarding the multitude of species reliant on these habitats necessitate a comprehensive, coordinated strategy encompassing conservation practices, sustainable methodologies, and international collaboration [44]. It remains crucial for the global community to persist in curbing greenhouse gas emissions to limit the extent of global warming and its consequential impact on marine ecosystems. The insights gleaned from this study underscore the pressing need for swift, decisive actions to sustain the vitality and well-being of our oceans. Leveraging the CMIP6 framework in this research augments our comprehension of the intricate, interrelated processes within marine ecosystems. Future studies should incorporate multiple models to consider variations in the high climate sensitivity observed in CMIP6, which can impact projected ocean warming levels [5, 23]. Furthermore, there is a need for more extensive research into the effects of stratification on upper-ocean nutrient cycling and carbon flux to achieve a comprehensive understanding of these complex processes within marine ecosystems. Addressing these challenges collectively enables us to strive toward a more sustainable, resilient future for our oceans and the diverse array of life they harbor [45].
5. Conclusion
This study conducted a comprehensive analysis employing the CMIP6 model to underscore the intricate and region-specific responses of surface marine ecosystems to climate change. The SSP5-8.5 scenario, in alignment with previous projections, demonstrates a more pronounced impact than SSP1-2.6. Lower-warming scenarios mitigate the severity of warming and acidification, highlighting the critical role of mitigation efforts in safeguarding marine ecosystems [5]. Both CESM2-WACCM and GFDL-ESM4 models consistently project a warming trend and changes in biogeochemical variables, notably with CESM simulations indicating more noticeable regional variations compared to GFDL simulations. Anticipated are a global increase in sea surface temperature and a substantial decrease in pH levels. Furthermore, the study predicts a decline in key nutrient concentrations, including nitrate, phosphate, silicon, and varying levels of ammonium and iron. This expected nutrient depletion is likely to result in reduced phytoplankton populations and primary production, consequently impacting zooplankton consumption. Consequently, the reduction in detritus, or particulate organic carbon, is expected due to the decreased biomass of phytoplankton and zooplankton across the ecosystem.
References
[1]. Garcia-Soto, C., Cheng, L., Caesar, L., Schmidtko, S., Jewett, E. B., Cheripka, A., Rigor, I., Caballero, A., Chiba, S., Báez, J. C., Zielinski, T., & Abraham, J. P. (2021). An Overview of Ocean Climate Change Indicators: Sea surface temperature, Ocean Heat Content, Ocean pH, Dissolved Oxygen Concentration, Arctic Sea Ice Extent, Thickness and Volume, Sea Level and Strength of the AMOC (Atlantic Meridional Overturning Circulation). Frontiers in Marine Science, 8, 642372.
[2]. Masson-Delmotte, V., Zhai, P., Pirani, S., Connors, C., Péan, S., Berger, N., . . . Scheel Monteiro, P. M. (2021). Ipcc, 2021: Summary for policymakers. in: Climate change 2021: The physical science basis. contribution of working group i to the sixth assessment report of the intergovernmental panel on climate change.
[3]. Doney, S. C., Ruckelshaus, M., Emmett Duffy, J., Barry, J. P., Chan, F., English, C. A., Galindo, H. M., Grebmeier, J. M., Hollowed, A. B., Knowlton, N., Polovina, J., Rabalais, N. N., Sydeman, W. J., & Talley, L. D. (2012). Climate Change Impacts on Marine Ecosystems. Annual Review of Marine Science, 4(1), 11–37.
[4]. Harley, C. D. G., Anderson, K. M., Demes, K. W., Jorve, J. P., Kordas, R. L., Coyle, T. A., & Graham, M. H. (2012). EFFECTS OF CLIMATE CHANGE ON GLOBAL SEAWEED COMMUNITIES. Journal of Phycology, 48(5), 1064–1078.
[5]. Kwiatkowski, L., Torres, O., Bopp, L., Aumont, O., Chamberlain, M., Christian, J. R., Dunne, J. P., Gehlen, M., Ilyina, T., John, J. G., Lenton, A., Li, H., Lovenduski, N. S., Orr, J. C., Palmieri, J., Santana-Falcón, Y., Schwinger, J., Séférian, R., Stock, C. A., … Ziehn, T. (2020). Twenty-first century ocean warming, acidification, deoxygenation, and upper-ocean nutrient and primary production decline from CMIP6 model projections. Biogeosciences, 17(13), 3439–3470.
[6]. Oliver, E. C. J., Donat, M. G., Burrows, M. T., Moore, P. J., Smale, D. A., Alexander, L. V., Benthuysen, J. A., Feng, M., Sen Gupta, A., Hobday, A. J., Holbrook, N. J., Perkins-Kirkpatrick, S. E., Scannell, H. A., Straub, S. C., & Wernberg, T. (2018). Longer and more frequent marine heatwaves over the past century. Nature Communications, 9(1), 1324–12.
[7]. Iskandar, M. R., Ismail, M. F. A., Arifin, T., & Chandra, H. (2021). Marine heatwaves of sea surface temperature off south Java. Heliyon, 7(12), e08618–e08618.
[8]. Rodrigues, R. R., Taschetto, A. S., Sen Gupta, A., & Foltz, G. R. (2019). Common cause for severe droughts in South America and marine heatwaves in the South Atlantic. Nature Geoscience, 12(8), 620–626.
[9]. Ainsworth, T. D., Hurd, C. L., Gates, R. D., & Boyd, P. W. (2020). How do we overcome abrupt degradation of marine ecosystems and meet the challenge of heat waves and climate extremes? Global Change Biology, 26(2), 343–354.
[10]. Gazeau, F., Parker, L. M., Comeau, S., Gattuso, J.-P., O’Connor, W. A., Martin, S., . . . Ross, P. M. (2013). Impacts of ocean acidification on marine shelled molluscs. Marine biology, 160, 2207-2245.
[11]. Dutkiewicz, S., Morris, J. J., Follows, M. J., Scott, J., Levitan, O., Dyhrman, S. T., & Berman-Frank, I. (2015). Impact of ocean acidification on the structure of future phytoplankton communities. Nature Climate Change, 5(11), 1002–1006.
[12]. Stramma, L., & Schmidtko, S. (2019). Global evidence of ocean deoxygenation: IUCN.
[13]. Henson, S. A., Beaulieu, C., Ilyina, T., John, J. G., Long, M., Séférian, R., Tjiputra, J., & Sarmiento, J. L. (2017). Rapid emergence of climate change in environmental drivers of marine ecosystems. Nature Communications, 8(1), 14682–14682.
[14]. Bonan, G. B., & Doney, S. C. (2018). Climate, ecosystems, and planetary futures: The challenge to predict life in Earth system models. Science, 359(6375), eaam8328.
[15]. Gruber, N. (2011). Warming up, turning sour, losing breath: ocean biogeochemistry under global change. Philosophical Transactions of the Royal Society A: Mathematical, Physical and Engineering Sciences, 369(1943), 1980-1996.
[16]. Schuchert, K., Kregting, L., Pritchard, D., Savidge, G., & Elsäßer, B. (2018). Using Coupled Hydrodynamic Biogeochemical Models to Predict the Effects of Tidal Turbine Arrays on Phytoplankton Dynamics. Journal of Marine Science and Engineering, 6(2), 58.
[17]. Bristow, L. A., Mohr, W., Ahmerkamp, S., & Kuypers, M. M. (2017). Nutrients that limit growth in the ocean. Current Biology, 27(11), R474-R478.
[18]. Buitenhuis, E. T., Vogt, M., Moriarty, R., Bednarsek, N., Doney, S. C., Leblanc, K., Quere, Cl., Luo, Y.-W., O’Brien, C., & O’Brien, T. (2013). MAREDAT: towards a world atlas of MARine Ecosystem DATa. Earth System Science Data, 5(2), 227–239.
[19]. Bopp, L., Resplandy, L., Orr, J. C., Doney, S. C., Dunne, J. P., Gehlen, M., . . . Seferian, R. (2013). Multiple stressors of ocean ecosystems in the 21st century: projections with CMIP5 models. Biogeosciences, 10(10), 6225-6245.
[20]. Boersma, M., & Meunier, C. L. (2020). Zooplankton-phytoplankton interactions in a changing world Zooplankton Ecology (pp. 28-52): CRC Press.
[21]. Eyring, Bony, S., Meehl, G. A., Senior, C. A., Stevens, B., Stouffer, R. J., & Taylor, K. E. (2016). Overview of the Coupled Model Intercomparison Project Phase 6 (CMIP6) experimental design and organization. Geoscientific Model Development, 9(5), 1937–1958.
[22]. Derek P. Tittensor,Camilla Novaglio,Cheryl S. Harrison,Ryan F. Heneghan,Nicolas Barrier,Daniele Bianchi,Laurent Bopp,Andrea Bryndum-Buchholz,Gregory L. Britten,Matthias Büchner,William W. L. Cheung,Villy Christensen,Marta Coll,John Dunne,Tyler D. Eddy,Jason D. Everett,Jose A. Fernandes-Salvador,Elizabeth A. Fulton,Eric D. Galbraith,Didier Gascuel,Jérôme Guiet,Jasmin G. John,Jason S. Link,Heike K. Lotze,Olivier Maury,Kelly Ortega-Cisneros,Juliano Palacios-Abrantes,Colleen M. Petrik,Hubert du Pontavice,Jonathan Rault,Anthony J. Richardson,Lynne J. Shannon,Yunne-Jai Shin,Jeroen Steenbeek,Charles A. Stock, & Julia L. Blanchard (2021). Next-generation ensemble projections reveal higher climate risks for marine ecosystems. Nature Climate Change, 11 (11), 973-981.
[23]. Fan, Duan, Q., Shen, C., Wu, Y., & Xing, C. (2020). Global surface air temperatures in CMIP6: historical performance and future changes. Environmental Research Letters, 15(10), 104056.
[24]. Keil, P., Mauritsen, T., Jungclaus, J., Hedemann, C., Olonscheck, D., & Ghosh, R. (2020). Multiple drivers of the North Atlantic warming hole. Nature Climate Change.
[25]. IPCC, A. (2014). IPCC Fifth Assessment Report—Synthesis Report. IPPC Rome, Italy.
[26]. Alexander, M. A., Scott, J. D., Friedland, K. D., Mills, K. E., Nye, J. A., Pershing, A. J., & Thomas, A. C. (2018). Projected sea surface temperatures over the 21st century: Changes in the mean, variability and extremes for large marine ecosystem regions of Northern Oceans. Elem Sci Anth, 6, 9.
[27]. Caesar, L., Rahmstorf, S., Robinson, A., Feulner, G., and Saba, V. (2018). Observed fingerprint of a weakening Atlantic Ocean overturning circulation. Nature, 556:191.
[28]. Cheng, L., Abraham, J., Hausfather, Z., & Trenberth, K. E. (2019). How fast are the oceans warming?. Science, 363(6423), 128-129.
[29]. Cheng, L., von Schuckmann, K., Abraham, J. P., Trenberth, K. E., Mann, M. E., Zanna, L., . . . Yu, Y. (2022). Past and future ocean warming. Nature Reviews Earth & Environment, 3(11), 776-794.
[30]. Gao, K., Beardall, J., Häder, D.-P., Hall-Spencer, J. M., Gao, G., & Hutchins, D. A. (2019). Effects of ocean acidification on marine photosynthetic organisms under the concurrent influences of warming, UV radiation, and deoxygenation. Frontiers in Marine Science, 6, 322.
[31]. Taylor, S. F., Roberts, M. J., Milligan, B., & Ncwadi, R. (2019). Measurement and implications of marine food security in the Western Indian Ocean: an impending crisis?. Food Security, 11, 1395-1415.
[32]. Smith Jr, K., Ruhl, H., Bett, B., Billett, D., Lampitt, R., & Kaufmann, R. (2009). Climate, carbon cycling, and deep-ocean ecosystems. Proceedings of the National Academy of Sciences, 106(46), 19211-19218.
[33]. Smith, S., Altieri, K. E., Mdutyana, M., Walker, D. R., Parrott, R. G., Gallie, S., Spence, K. A. M., Burger, J. M., and Fawcett, S. E.(2021). Biogeochemical controls on ammonium accumulation in the surface layer of the Southern Ocean. Biogeosciences, 19, 715–741
[34]. Bianchi, M., Feliatra, F., Tréguer, P., Vincendeau, M., & Morvan, J. (1997). Nitrification rates, ammonium and nitrate distribution in upper layers of the water column and in sediments of the Indian sector of the Southern Ocean. Deep-sea Research Part Ii-topical Studies in Oceanography, 44, 1017-1032.
[35]. Misumi, K., Lindsay, K., Moore, J., Doney, S., Bryan, F., Tsumune, D., & Yoshida, Y. (2014). The iron budget in ocean surface waters in the 20th and 21st centuries: projections by the Community Earth System Model version 1. Biogeosciences, 11(1), 33-55.
[36]. Moore, J. K., Lindsay, K., Doney, S. C., Long, M. C., & Misumi, K. (2013). Marine ecosystem dynamics and biogeochemical cycling in the Community Earth System Model [CESM1 (BGC)]: Comparison of the 1990s with the 2090s under the RCP4. 5 and RCP8. 5 scenarios. Journal of Climate, 26(23), 9291-9312.
[37]. Kumar, B. S. K., Bhaskararao, D., Krishna, P., Lakshmi, C. N. V., Surendra, T., & Krishna, R. M. (2022). Impact of nutrient concentration and composition on shifting of phytoplankton community in the coastal waters of the Bay of Bengal. Regional Studies in Marine Science, 51, 102228.
[38]. Örnólfsdóttir, E. B., Lumsden, S. E., & Pinckney, J. L. (2004). Phytoplankton community growth-rate response to nutrient pulses in a shallow turbid estuary, Galveston Bay, Texas. Journal of plankton research, 26(3), 325-339.
[39]. Falkowski, P. G., Barber, R. T., & Smetacek, V. (1998). Biogeochemical controls and feedbacks on ocean primary production. Science, 281(5374), 200-206.
[40]. Buesseler, K. O. (1998). The decoupling of production and particulate export in the surface ocean. Global Biogeochemical Cycles, 12(2), 297-310.
[41]. Foltz, G. R., Brandt, P., Richter, I., Rodríguez-Fonseca, B., Hernandez, F., Dengler, M., . . . Lefèvre, N. (2019). The tropical Atlantic observing system. Frontiers in Marine Science, 6, 206.
[42]. Abirami, B., Radhakrishnan, M., Kumaran, S., & Wilson, A. (2021). Impacts of global warming on marine microbial communities. Science of The Total Environment, 791, 147905.
[43]. Papantoniou, G., Giannoulaki, M., Stoumboudi, M. T., Lefkaditou, E., & Tsagarakis, K. (2021). Food web interactions in a human dominated Mediterranean coastal ecosystem. Marine Environmental Research, 172, 105507.
[44]. Bennett, N. J. (2018). Navigating a just and inclusive path towards sustainable oceans. Marine Policy, 97, 139-146.
[45]. Claudet, J., Bopp, L., Cheung, W. W., Devillers, R., Escobar-Briones, E., Haugan, P., . . . Miloslavich, P. (2020). A roadmap for using the UN decade of ocean science for sustainable development in support of science, policy, and action. One Earth, 2(1), 34-42.
Cite this article
Song,Z. (2024). Projected impacts of global warming scenarios on marine ecosystems: Insights from the CMIP6 model. Theoretical and Natural Science,37,163-183.
Data availability
The datasets used and/or analyzed during the current study will be available from the authors upon reasonable request.
Disclaimer/Publisher's Note
The statements, opinions and data contained in all publications are solely those of the individual author(s) and contributor(s) and not of EWA Publishing and/or the editor(s). EWA Publishing and/or the editor(s) disclaim responsibility for any injury to people or property resulting from any ideas, methods, instructions or products referred to in the content.
About volume
Volume title: Proceedings of the 2nd International Conference on Environmental Geoscience and Earth Ecology
© 2024 by the author(s). Licensee EWA Publishing, Oxford, UK. This article is an open access article distributed under the terms and
conditions of the Creative Commons Attribution (CC BY) license. Authors who
publish this series agree to the following terms:
1. Authors retain copyright and grant the series right of first publication with the work simultaneously licensed under a Creative Commons
Attribution License that allows others to share the work with an acknowledgment of the work's authorship and initial publication in this
series.
2. Authors are able to enter into separate, additional contractual arrangements for the non-exclusive distribution of the series's published
version of the work (e.g., post it to an institutional repository or publish it in a book), with an acknowledgment of its initial
publication in this series.
3. Authors are permitted and encouraged to post their work online (e.g., in institutional repositories or on their website) prior to and
during the submission process, as it can lead to productive exchanges, as well as earlier and greater citation of published work (See
Open access policy for details).
References
[1]. Garcia-Soto, C., Cheng, L., Caesar, L., Schmidtko, S., Jewett, E. B., Cheripka, A., Rigor, I., Caballero, A., Chiba, S., Báez, J. C., Zielinski, T., & Abraham, J. P. (2021). An Overview of Ocean Climate Change Indicators: Sea surface temperature, Ocean Heat Content, Ocean pH, Dissolved Oxygen Concentration, Arctic Sea Ice Extent, Thickness and Volume, Sea Level and Strength of the AMOC (Atlantic Meridional Overturning Circulation). Frontiers in Marine Science, 8, 642372.
[2]. Masson-Delmotte, V., Zhai, P., Pirani, S., Connors, C., Péan, S., Berger, N., . . . Scheel Monteiro, P. M. (2021). Ipcc, 2021: Summary for policymakers. in: Climate change 2021: The physical science basis. contribution of working group i to the sixth assessment report of the intergovernmental panel on climate change.
[3]. Doney, S. C., Ruckelshaus, M., Emmett Duffy, J., Barry, J. P., Chan, F., English, C. A., Galindo, H. M., Grebmeier, J. M., Hollowed, A. B., Knowlton, N., Polovina, J., Rabalais, N. N., Sydeman, W. J., & Talley, L. D. (2012). Climate Change Impacts on Marine Ecosystems. Annual Review of Marine Science, 4(1), 11–37.
[4]. Harley, C. D. G., Anderson, K. M., Demes, K. W., Jorve, J. P., Kordas, R. L., Coyle, T. A., & Graham, M. H. (2012). EFFECTS OF CLIMATE CHANGE ON GLOBAL SEAWEED COMMUNITIES. Journal of Phycology, 48(5), 1064–1078.
[5]. Kwiatkowski, L., Torres, O., Bopp, L., Aumont, O., Chamberlain, M., Christian, J. R., Dunne, J. P., Gehlen, M., Ilyina, T., John, J. G., Lenton, A., Li, H., Lovenduski, N. S., Orr, J. C., Palmieri, J., Santana-Falcón, Y., Schwinger, J., Séférian, R., Stock, C. A., … Ziehn, T. (2020). Twenty-first century ocean warming, acidification, deoxygenation, and upper-ocean nutrient and primary production decline from CMIP6 model projections. Biogeosciences, 17(13), 3439–3470.
[6]. Oliver, E. C. J., Donat, M. G., Burrows, M. T., Moore, P. J., Smale, D. A., Alexander, L. V., Benthuysen, J. A., Feng, M., Sen Gupta, A., Hobday, A. J., Holbrook, N. J., Perkins-Kirkpatrick, S. E., Scannell, H. A., Straub, S. C., & Wernberg, T. (2018). Longer and more frequent marine heatwaves over the past century. Nature Communications, 9(1), 1324–12.
[7]. Iskandar, M. R., Ismail, M. F. A., Arifin, T., & Chandra, H. (2021). Marine heatwaves of sea surface temperature off south Java. Heliyon, 7(12), e08618–e08618.
[8]. Rodrigues, R. R., Taschetto, A. S., Sen Gupta, A., & Foltz, G. R. (2019). Common cause for severe droughts in South America and marine heatwaves in the South Atlantic. Nature Geoscience, 12(8), 620–626.
[9]. Ainsworth, T. D., Hurd, C. L., Gates, R. D., & Boyd, P. W. (2020). How do we overcome abrupt degradation of marine ecosystems and meet the challenge of heat waves and climate extremes? Global Change Biology, 26(2), 343–354.
[10]. Gazeau, F., Parker, L. M., Comeau, S., Gattuso, J.-P., O’Connor, W. A., Martin, S., . . . Ross, P. M. (2013). Impacts of ocean acidification on marine shelled molluscs. Marine biology, 160, 2207-2245.
[11]. Dutkiewicz, S., Morris, J. J., Follows, M. J., Scott, J., Levitan, O., Dyhrman, S. T., & Berman-Frank, I. (2015). Impact of ocean acidification on the structure of future phytoplankton communities. Nature Climate Change, 5(11), 1002–1006.
[12]. Stramma, L., & Schmidtko, S. (2019). Global evidence of ocean deoxygenation: IUCN.
[13]. Henson, S. A., Beaulieu, C., Ilyina, T., John, J. G., Long, M., Séférian, R., Tjiputra, J., & Sarmiento, J. L. (2017). Rapid emergence of climate change in environmental drivers of marine ecosystems. Nature Communications, 8(1), 14682–14682.
[14]. Bonan, G. B., & Doney, S. C. (2018). Climate, ecosystems, and planetary futures: The challenge to predict life in Earth system models. Science, 359(6375), eaam8328.
[15]. Gruber, N. (2011). Warming up, turning sour, losing breath: ocean biogeochemistry under global change. Philosophical Transactions of the Royal Society A: Mathematical, Physical and Engineering Sciences, 369(1943), 1980-1996.
[16]. Schuchert, K., Kregting, L., Pritchard, D., Savidge, G., & Elsäßer, B. (2018). Using Coupled Hydrodynamic Biogeochemical Models to Predict the Effects of Tidal Turbine Arrays on Phytoplankton Dynamics. Journal of Marine Science and Engineering, 6(2), 58.
[17]. Bristow, L. A., Mohr, W., Ahmerkamp, S., & Kuypers, M. M. (2017). Nutrients that limit growth in the ocean. Current Biology, 27(11), R474-R478.
[18]. Buitenhuis, E. T., Vogt, M., Moriarty, R., Bednarsek, N., Doney, S. C., Leblanc, K., Quere, Cl., Luo, Y.-W., O’Brien, C., & O’Brien, T. (2013). MAREDAT: towards a world atlas of MARine Ecosystem DATa. Earth System Science Data, 5(2), 227–239.
[19]. Bopp, L., Resplandy, L., Orr, J. C., Doney, S. C., Dunne, J. P., Gehlen, M., . . . Seferian, R. (2013). Multiple stressors of ocean ecosystems in the 21st century: projections with CMIP5 models. Biogeosciences, 10(10), 6225-6245.
[20]. Boersma, M., & Meunier, C. L. (2020). Zooplankton-phytoplankton interactions in a changing world Zooplankton Ecology (pp. 28-52): CRC Press.
[21]. Eyring, Bony, S., Meehl, G. A., Senior, C. A., Stevens, B., Stouffer, R. J., & Taylor, K. E. (2016). Overview of the Coupled Model Intercomparison Project Phase 6 (CMIP6) experimental design and organization. Geoscientific Model Development, 9(5), 1937–1958.
[22]. Derek P. Tittensor,Camilla Novaglio,Cheryl S. Harrison,Ryan F. Heneghan,Nicolas Barrier,Daniele Bianchi,Laurent Bopp,Andrea Bryndum-Buchholz,Gregory L. Britten,Matthias Büchner,William W. L. Cheung,Villy Christensen,Marta Coll,John Dunne,Tyler D. Eddy,Jason D. Everett,Jose A. Fernandes-Salvador,Elizabeth A. Fulton,Eric D. Galbraith,Didier Gascuel,Jérôme Guiet,Jasmin G. John,Jason S. Link,Heike K. Lotze,Olivier Maury,Kelly Ortega-Cisneros,Juliano Palacios-Abrantes,Colleen M. Petrik,Hubert du Pontavice,Jonathan Rault,Anthony J. Richardson,Lynne J. Shannon,Yunne-Jai Shin,Jeroen Steenbeek,Charles A. Stock, & Julia L. Blanchard (2021). Next-generation ensemble projections reveal higher climate risks for marine ecosystems. Nature Climate Change, 11 (11), 973-981.
[23]. Fan, Duan, Q., Shen, C., Wu, Y., & Xing, C. (2020). Global surface air temperatures in CMIP6: historical performance and future changes. Environmental Research Letters, 15(10), 104056.
[24]. Keil, P., Mauritsen, T., Jungclaus, J., Hedemann, C., Olonscheck, D., & Ghosh, R. (2020). Multiple drivers of the North Atlantic warming hole. Nature Climate Change.
[25]. IPCC, A. (2014). IPCC Fifth Assessment Report—Synthesis Report. IPPC Rome, Italy.
[26]. Alexander, M. A., Scott, J. D., Friedland, K. D., Mills, K. E., Nye, J. A., Pershing, A. J., & Thomas, A. C. (2018). Projected sea surface temperatures over the 21st century: Changes in the mean, variability and extremes for large marine ecosystem regions of Northern Oceans. Elem Sci Anth, 6, 9.
[27]. Caesar, L., Rahmstorf, S., Robinson, A., Feulner, G., and Saba, V. (2018). Observed fingerprint of a weakening Atlantic Ocean overturning circulation. Nature, 556:191.
[28]. Cheng, L., Abraham, J., Hausfather, Z., & Trenberth, K. E. (2019). How fast are the oceans warming?. Science, 363(6423), 128-129.
[29]. Cheng, L., von Schuckmann, K., Abraham, J. P., Trenberth, K. E., Mann, M. E., Zanna, L., . . . Yu, Y. (2022). Past and future ocean warming. Nature Reviews Earth & Environment, 3(11), 776-794.
[30]. Gao, K., Beardall, J., Häder, D.-P., Hall-Spencer, J. M., Gao, G., & Hutchins, D. A. (2019). Effects of ocean acidification on marine photosynthetic organisms under the concurrent influences of warming, UV radiation, and deoxygenation. Frontiers in Marine Science, 6, 322.
[31]. Taylor, S. F., Roberts, M. J., Milligan, B., & Ncwadi, R. (2019). Measurement and implications of marine food security in the Western Indian Ocean: an impending crisis?. Food Security, 11, 1395-1415.
[32]. Smith Jr, K., Ruhl, H., Bett, B., Billett, D., Lampitt, R., & Kaufmann, R. (2009). Climate, carbon cycling, and deep-ocean ecosystems. Proceedings of the National Academy of Sciences, 106(46), 19211-19218.
[33]. Smith, S., Altieri, K. E., Mdutyana, M., Walker, D. R., Parrott, R. G., Gallie, S., Spence, K. A. M., Burger, J. M., and Fawcett, S. E.(2021). Biogeochemical controls on ammonium accumulation in the surface layer of the Southern Ocean. Biogeosciences, 19, 715–741
[34]. Bianchi, M., Feliatra, F., Tréguer, P., Vincendeau, M., & Morvan, J. (1997). Nitrification rates, ammonium and nitrate distribution in upper layers of the water column and in sediments of the Indian sector of the Southern Ocean. Deep-sea Research Part Ii-topical Studies in Oceanography, 44, 1017-1032.
[35]. Misumi, K., Lindsay, K., Moore, J., Doney, S., Bryan, F., Tsumune, D., & Yoshida, Y. (2014). The iron budget in ocean surface waters in the 20th and 21st centuries: projections by the Community Earth System Model version 1. Biogeosciences, 11(1), 33-55.
[36]. Moore, J. K., Lindsay, K., Doney, S. C., Long, M. C., & Misumi, K. (2013). Marine ecosystem dynamics and biogeochemical cycling in the Community Earth System Model [CESM1 (BGC)]: Comparison of the 1990s with the 2090s under the RCP4. 5 and RCP8. 5 scenarios. Journal of Climate, 26(23), 9291-9312.
[37]. Kumar, B. S. K., Bhaskararao, D., Krishna, P., Lakshmi, C. N. V., Surendra, T., & Krishna, R. M. (2022). Impact of nutrient concentration and composition on shifting of phytoplankton community in the coastal waters of the Bay of Bengal. Regional Studies in Marine Science, 51, 102228.
[38]. Örnólfsdóttir, E. B., Lumsden, S. E., & Pinckney, J. L. (2004). Phytoplankton community growth-rate response to nutrient pulses in a shallow turbid estuary, Galveston Bay, Texas. Journal of plankton research, 26(3), 325-339.
[39]. Falkowski, P. G., Barber, R. T., & Smetacek, V. (1998). Biogeochemical controls and feedbacks on ocean primary production. Science, 281(5374), 200-206.
[40]. Buesseler, K. O. (1998). The decoupling of production and particulate export in the surface ocean. Global Biogeochemical Cycles, 12(2), 297-310.
[41]. Foltz, G. R., Brandt, P., Richter, I., Rodríguez-Fonseca, B., Hernandez, F., Dengler, M., . . . Lefèvre, N. (2019). The tropical Atlantic observing system. Frontiers in Marine Science, 6, 206.
[42]. Abirami, B., Radhakrishnan, M., Kumaran, S., & Wilson, A. (2021). Impacts of global warming on marine microbial communities. Science of The Total Environment, 791, 147905.
[43]. Papantoniou, G., Giannoulaki, M., Stoumboudi, M. T., Lefkaditou, E., & Tsagarakis, K. (2021). Food web interactions in a human dominated Mediterranean coastal ecosystem. Marine Environmental Research, 172, 105507.
[44]. Bennett, N. J. (2018). Navigating a just and inclusive path towards sustainable oceans. Marine Policy, 97, 139-146.
[45]. Claudet, J., Bopp, L., Cheung, W. W., Devillers, R., Escobar-Briones, E., Haugan, P., . . . Miloslavich, P. (2020). A roadmap for using the UN decade of ocean science for sustainable development in support of science, policy, and action. One Earth, 2(1), 34-42.