


1 Introduction
Sports analytics has witnessed remarkable growth due to the availability of extensive sports datasets and the successful implementation of data mining techniques. These advancements have given rise to sports data prediction methods that extract hidden knowledge with profound implications for the sports industry. Machine Learning (ML) and Deep Learning (DL) methods have become increasingly popular for managing athletes and optimizing training programs. Among the various areas of focus within sports analytics, predicting the outcomes of specific basketball athletes has garnered significant attention for its potential to revolutionize coaching strategies, team management, and fan engagement.
Driven by a profound interest in college and NBA basketball matches, alongside a keen observation of the evolving coaching strategies in athlete management, this research aims to contribute to the expanding field of sports analytics. This enthusiasm for basketball was further fueled by firsthand observations of innovative methods during a baseball game at City Field in New York. These personal experiences, combined with the broader trend of data-driven decision-making in sports management, underscore the relevance and importance of this research endeavor.
To achieve this objective, we curated data from various sources, including published essays and the renowned online platform Kaggle. Subsequently, we meticulously evaluated several prominent machine learning models, including Linear Regression, K-Nearest Neighbors (KNN), Gradient Boosting, Elastic Net, and Lasso. The goal was to determine the models' effectiveness in predicting the performance of specific basketball players. Through rigorous analysis and comparison, we discovered that Linear Regression and Gradient Boosting exhibited superior predictive capabilities compared to the other models considered. This thorough selection process forms the cornerstone of our research methodology, highlighting the precision and rigor with which our conclusions are derived.
2 Literature review
Sports games vary from one to another, with the development of Machine Learning and Deep Learning, the perception of the game and prediction of the results become the main interest to coaches, media, fans and etc. [1] Machine learning, a potent methodology for classification and prediction, exhibits promise in sports prediction, a crucial domain given substantial betting stakes, with club managers seeking accurate models to comprehend and strategize for match-winning outcomes [2]. It is often seen as one of the methods of Sports Analytics. The emergence of Sports Analytics as a research area, its diverse applications in predicting performance, estimating talent and market value, and foreseeing injuries, which highlights the increasing adoption of analytics tools by teams and coaches for tactical improvement, reviews existing literature, and introduces a new predictive approach [3].
Machine learning plays a crucial role in sports predictions, encompassing the analysis of individual performance data to team dynamics. Whether assessing the impact of individual actions on winning rates or considering the collective influence of team behavior, machine learning can predict trends across various dimensions. Firstly, identifying rising stars, individuals with the potential for imminent popularity, is valuable across various domains, aiding organizations in decision-making; this concept has been successfully employed to pinpoint emerging figures in research, telecommunications management, and cricket players, offering strategic insights for recognizing and nurturing talent, according to Zafar Mahmood (2021) [4]. The reason why finding rising stars is so important for a team or a club (no matter team sports or individual ones) is related not only to the success rate, but also the commercial value. Star players play a pivotal role in enhancing their team's brand, translating on-field excellence into tangible equity that boosts team awareness, captures public attention, and facilitates entry into new markets, underscoring the profound impact of athletes with notable performances on a franchise's overall standing in the league.) [5].
What’s more, this can raise the probability of the accuracy of a certain team victories, with the accurate tactics, for example the National Basketball Association (NBA) of the United States, where machine learning and deep learning are applicable to forecasting the outcome of an NBA game using historical data [6].Since effective placement of players in team sports is crucial for tactical success, as an improper formation can directly result in match losses; teams may adjust player formations during specific match phases. Soccer, for instance, involves considering internal and external parameters, enabling tactical inferences and predictions based on a comprehensive analysis during the game [7]. Now back to basketball, a lot of methods and algorithms are used to predict the phenomenon and the output of a game, but some of them can be proved as wrong. Research explores the efficiency of machine learning algorithms in predicting NBA events, focusing on All-Star prediction, Playoff prediction, and investigating the Hot Streak Fallacy, finding that advanced statistics outperform elementary ones in Playoff prediction and lacking evidence to support the 'Hot Streak Phenomenon.' Different techniques used in a particular sport may show difference in their efficiency, according to the study by Nguyen Nguyen et.al. (2020) uses data analysis techniques in basketball, finding that gradient boosting machines are effective for predicting players' future performance, and balanced under-sampling random forest outperforms other algorithms in predicting All-Star game selection, employing the CRISP-DM methodology [8].Based on this, they also explores data analysis techniques in basketball, and finds that, despite applying both traditional Machine Learning and Deep Learning, scoring remains the most crucial factor in predicting players' future performance and All-Star game selection [9] .Notice that, the All-Star game in the most often predicted area of basketball with the most number of data, interests of the public, and profits [10] .
In addition, Sports superstars not only propel team victories but also enhance fanbase, league revenue, and media coverage, with historical data illustrating their lasting economic impact across eras, even benefiting opposing teams [11].The performance of a single star can cause negative output to a team, too, which is stated in a study that machine-learning methods and points-prediction simulation can explore the impact of performance changes, revealing general trends in how a drop in performance correlates with real-world outcomes, with variations based on team performance levels [12].Except the result prediction of the game, there are other aspects which Machine Learning plays an important role in. More and more clubs and coaches have noticed that health arrangement and potential risk prevention of the athletes is a critical issue, which lead to whether an athlete can be sustainable in long time consideration [13]. Thus, different models for motion tracking and risk avoiding have been introduced. Preventing sports injuries in basketball teaching is crucial due to the frequent physical movements players engage in during the game, placing a strain on their bodies and increasing the risk of injuries. A team of researchers state that the basketball motion capture and can preserve the motion posture information of the player in 3-dimension graph, largely reduce the risk of serious injuries [14]. What’s more, since basketball is a high-intensity game, the real-time monitoring of players' sports status is essential to promptly detect and prevent injuries, presenting a pressing concern for both athletes and coaches. Besides the above method called 3-dimension graph, another motion capture system called CNN sensor is released in order to monitor the athletes’ motion state simultaneously [15].
The medicine and health prediction in sports using Machine Learning is general these days, no matter in basketball field or others. Physicians aspire to optimize individual patient outcomes, but the challenge lies in accurately predicting results at the individual level. For instance, the amalgamation of machine learning algorithms with extensive data sourced from the knee ligament registry holds substantial promise in markedly enhancing predictive precision. This approach has considerable potential in transformative decision-making processes and optimizing outcomes within the realm of sports medicine. Its applicability is particularly pertinent when scrutinizing the recuperation of athletes' physical well-being [16]. In addition, machine learning is used to identify some other kind of recovery in athletes. Yan Chu, et.al. (2022), investigate the efficacy of machine-learning algorithms in modeling clinical concussion data to predict recovery time and protracted recovery, recognizing the complexity of numerous clinical measures that traditional methods may not effectively address [17].
Mental problem is also a serious one among athletes, as well as it is among general individuals, especially among those star players. Considering there is an increase in the rate of mental problems being detected by the hospitals these days, using traditional health administration systems to detect that can be ineffective, comparing with the approach in online detection of mental illness. Without face-to-face communication, that can even find those earlier, based on the historical data and large-scale of input evidences [18].
3 Methods
In what follows, we use 5 machine learning models to deal with the sports dataset which we downloaded from kaggle.
3.1 Linear regression
Linear regression is a statistical method used to model the relationship between a dependent variable and one or more independent variables. It assumes a linear relationship between the dependent variable and the independent variables, where the dependent variable can be predicted as a linear combination of the independent variables.Linear regression can be used to predict the value of the dependent variable based on the values of the independent variables. In this research, we use Linear Regression model to combine all the variables together for the final prediction.The representative formula is:
\( \hat{y}=w_{0}+w_{1}x_{1}+w_{2}x_{2}+...+w_{n}x_{n} \) (1)
where \( \hat{y} \) is the predicted value, \( w_{0},w_{1},..,w_{n} \) are the model parameters, and \( x_{1},x_{2},..,x_{n} \) are the input features.
The loss function is usually the Mean Squared Error (MSE):
\( MSE=\frac{1}{m}\sum_{i=1}^{m}(y_{i}-\hat{y_{i}})^{2} \) (2)
3.2 K-Nearest neighbors
The K-Nearest Neighbors algorithm is a non-parametric and lazy learning method used for classification and regression tasks. In KNN, the output is predicted based on the majority vote for classification or the average for regression of the "k" nearest data points in the feature space.KNN works with the following steps: For a given test point, the distances to all training points are calculated using a distance metric like Euclidean distance. And the "k" training points with the smallest distances to the test point are selected as its nearest neighbors. Also, for classification, the class of the test point is determined by a majority vote among its nearest neighbors. For regression, the predicted value is the average of the values of its nearest neighbors.Since KNN is non-parametric, it can handle complex decision boundaries and doesn't make assumptions about the underlying data distribution, so it can be used in this topic.
The representative formula is:
\( \hat{y}=\frac{1}{k}\sum_{i=1}^{k}y_{neighbor_{i}} \) (3)
where \( \hat{y} \) is the predicted value, k is the number of nearest neighbors, and \( y_{neighbor_{i}} \) is the label of the ith nearest neighbor.
The loss function is typically the Squared Euclidean Distance:
\( \sum_{j=1}^{n}(x_{test_{j}}-x_{train_{j}})^{2} \) (4)
3.3 Gradient boosting
Gradient Boosting is a machine learning technique used for both regression and classification problems. It is an ensemble learning method that combines the predictions of several base estimators, typically decision trees, in a sequential manner. Each new estimator corrects the errors made by the previous ones, leading to a strong overall model.The algorithm starts with an initial prediction, often the mean for regression or a simple class distribution for classification. In each iteration, a new estimator is added to the ensemble to correct the errors of the existing ensemble. This is done by fitting the new estimator to the residuals of the previous iteration.The predictions of all estimators are combined to make the final prediction. In regression, this is often the sum of the predictions from all estimators, while in classification, it can be the class with the highest sum of votes. Gradient Boosting is a powerful tool for sports result prediction, especially when dealing with complex and non-linear relationships between predictors and outcomes, which can be seen in this research and data with such features [19].
3.4 Support vector machine
Support Vector Machine (SVM) is a supervised machine learning model used for classification and regression tasks. In classification, SVMs find the hyperplane that best separates the classes in the feature space, maximizing the margin between the classes. This hyperplane is the decision boundary used to classify new data points. SVMs can handle both linear and non-linear data by using different kernel functions to map the data into higher-dimensional spaces where it can be separated linearly. For regression, SVMs are used to fit a function that predicts continuous values. The goal is to find the function that has the maximum margin while minimizing the error between the predicted and actual values. SVMs are known for their ability to handle high-dimensional data and their effectiveness in cases where the number of dimensions is greater than the number of samples, which is quite necessary for the exact topic about result prediction and dealing with large sum of data [20].
3.5 Elastic Net and Lasso
Elastic Net is a regularization technique used in regression tasks, especially when dealing with datasets where there are many potentially correlated independent variables. It combines the penalties of both L1 and L2 regularization methods to overcome some of their limitations. Elastic Net minimizes the sum of two terms in its objective function: the L1 penalty, which encourages sparsity by adding the absolute values of the coefficients, and the L2 penalty, which discourages large coefficients by adding the squares of the coefficients. The relative importance of these two penalties is controlled by a parameter. By using both L1 and L2 penalties, Elastic Net can select variables like Lasso while also handling correlated predictors like Ridge. It has two main parameters that need to be tuned: the mixing parameter between L1 and L2 penalties, and the regularization parameter which controls the overall strength of regularization [21].
The Lasso model is a regression analysis method that is a part of the Elastic Net model, only taking one parameter to be turned in during its prediction about our given data [22].
3.6 Problem solving
In what follows, we aim to predict basketball player performance by analyzing various machine learning models. The process begins with data loading and cleaning, including converting the 'Min' column to a numerical format. Feature selection is then conducted to identify the most relevant features for predicting points scored. A new DataFrame is constructed with these selected features and the target variable. Player performance is analyzed by aggregating statistics over time to capture trends. The data is split into training and test sets for model evaluation, and features are standardized to improve model performance. Five models – Linear Regression, Support Vector Machine (SVM), K-Nearest Neighbors (KNN), Gradient Boosting, Elastic Net, and Lasso – are trained on the standardized data to predict points scored by players. Model performance is evaluated using mean squared error, and a comparison graph is presented to assess the effectiveness of each model.
Firstly, we begin by loading the dataset containing the relevant data for our analysis. Once the data is loaded, we employ data cleaning methods to preprocess it according to our specific requirements. As part of this process, we convert the 'Min' column, which represents playing time in minutes, into a numerical format suitable for analysis, typically as a floating-point number.
Secondly, we proceed with feature selection, where we carefully choose the features that are most relevant to our goal of predicting the points scored by players in a game. This step involves identifying and selecting the features that have the strongest predictive power and are most likely to contribute to the accuracy of our model.
Following feature selection, we construct a new DataFrame containing only the selected features, which will serve as the basis for our predictive modeling. In this DataFrame, the target variable, which is the points scored by players in a game, is identified as the variable we aim to predict.
Subsequently, we aggregate statistics for each player over time to capture their performance trends and patterns. This aggregation enables us to analyze player performance in a more comprehensive manner, considering their historical data.
Once the data is prepared, we divide it into training and test sets to facilitate model evaluation. This division ensures that our models are trained on a subset of the data and tested on another independent subset, helping us assess their performance accurately.
Before training our models, we standardize the features to ensure that they have a mean of zero and a standard deviation of one.
Standardization is essential for models like linear regression and KNN, as it can improve their convergence and performance.
Finally, we proceed with the training of our predictive models. In this project, we plan to utilize five different models, including Linear Regression, Support Vector Machine (SVM), K-Nearest Neighbors (KNN), Gradient Boosting, Elastic Net, and Lasso. These models are trained on the standardized training data to learn the relationships between the selected features and the target variable, allowing us to make accurate predictions based on new input data. We can finally reach to the following graph which shows the model performance comparison by given the comparison of the mean squared error of each 6 models.
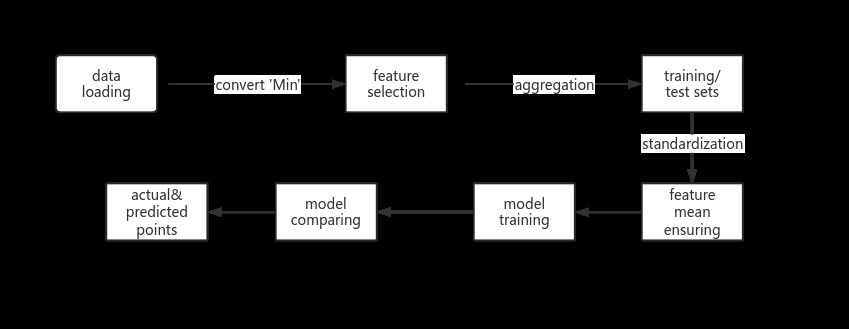
Figure 1. Workflow
The formulas using here are:
the Mean Squared Error (MSE):
\( MSE=\frac{1}{m}\sum_{i=1}^{m}(y_{i}-\hat{y_{i}})^{2} \) (5)
which has been mentioned in the first section in methods part.
StandardScaler:
\( z=\frac{x-μ}{σ} \) (6)
where z is the standardized value. x is the original value.μ is the mean of the feature values in the training set. σ is the standard deviation of the feature values in the training set.
Linear Regression formula:
\( \hat{y}=w_{0}+w_{1}x_{1}+w_{2}x_{2}+...+w_{n}x_{n} \) (7)
4 Results
4.1 Description of datasets
The data for this project was sourced from the Kaggle website. During the training phase, we utilized the following features: MIN, FGM, FGA, FG3M, FG3A, FTM, FAT, REB, AST, STL, BLK, TO, and PF. Initially, we conducted data cleaning on the 'ID' feature. Our target feature for prediction is 'PTS'. This dataset provides a comprehensive set of features that capture various aspects of basketball player performance, including minutes played, field goals made and attempted, three-point field goals made and attempted, free throws made and attempted, rebounds, assists, steals, blocks, turnovers, and personal fouls. These features are essential for modeling player performance and predicting points scored, which is crucial for understanding player contributions and team success in basketball games.
4.2 Workflow
The workflow includes data cleaning, feature selection, data standardization, model training, and performance evaluation.
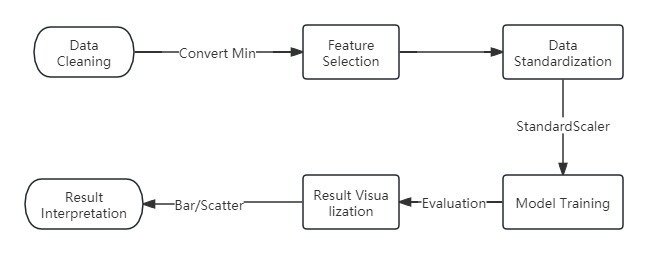
Figure 2. Workflow 2
For feature selection, I opted for game time, field goals made/attempts, 3-point field goals made/attempts, free throws made/attempts, rebounds, assists, steals, blocks, turnovers, and personal fouls. The models trained for performance comparison were Linear Regression, K-Nearest Neighbors, Gradient Boosting, Support Vector Machine (with a linear kernel), Elastic Net, and Lasso. Mean Squared Error (MSE) served as the performance metric. The primary focus of the analysis was comparing these models in predicting basketball player points scored. Evaluation involved comparing the MSE of each model and examining the scatter plot to assess prediction accuracy.
The parameters for different models are set as follows:
Table 1. Model and Parameters
Model |
Parameters |
K-Nearest Neighbors (KNN) |
Default parameters,n_neighbors=5 |
Support Vector Machine (SVM) |
Default (RBF kernel), C=1.0, epsilon=0.1 |
Gradient Boosting (GBDT) |
Default parameters |
Linear Regression |
Default parameters |
Elastic Net |
alpha=1.0, l1_ratio=0.5 |
Lasso |
alpha=1.0 |
The model assumes that there is a certain linear or nonlinear relationship between the selected features and player points scored, the model's predictive performance can be measured by mean squared error, and the performance of the model on a subset of samples can represent its overall performance.
4.3 Analysis of results
The analysis of the graph depicting the mean squared errors of various predictive models offers valuable insights into their performance. Firstly, the observation that the Linear Regression model and the Support Vector Machine model achieve the lowest mean squared error of 0.0 indicates that this model perfectly fits the data points in the training set. This exceptional performance suggests that both of these models may have effectively captured the underlying patterns in the data, resulting in highly accurate predictions.
Secondly, the Gradient Boosting model, while not achieving the same perfect fit as the Linear Regression model, still demonstrates a relatively low mean squared error of 0.05. Wiyohen considering a margin of 0.5 percentages error, which could be a practical threshold for acceptable prediction accuracy in this context, both the Linear Regression and Gradient Boosting models exhibit comparable performance. This implies that both models are capable of making predictions with a high degree of precision, as their errors fall within this small margin.
In contrast, the notable disparity of 1.44 between the Gradient Boosting and KNN models highlights a substantial difference in their predictive accuracy. This suggests that the Gradient Boosting model outperforms the KNN model by a significant margin in terms of its ability to make accurate predictions. This difference in performance underscores the importance of selecting the most appropriate model for a given predictive task, as choosing the wrong model could lead to significantly less accurate predictions.
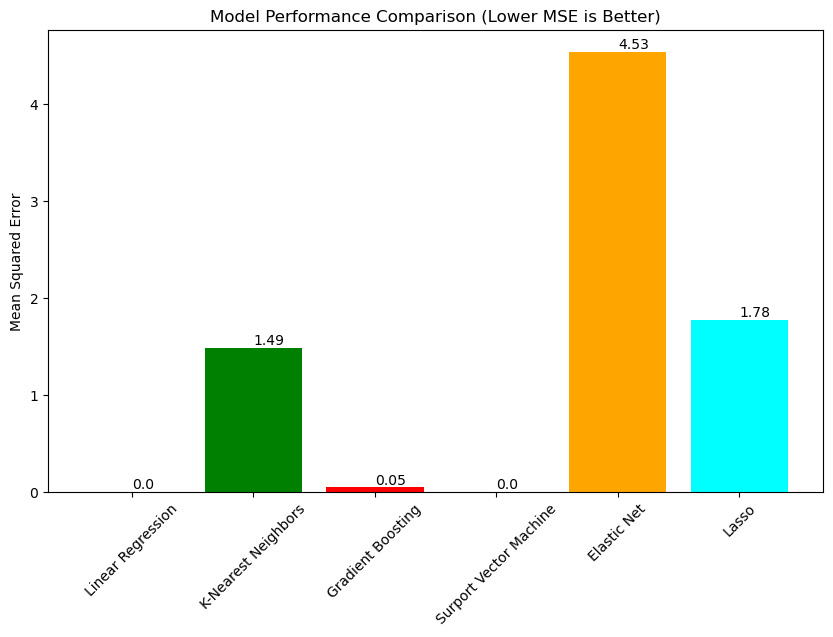
Figure 3. MSE Graph
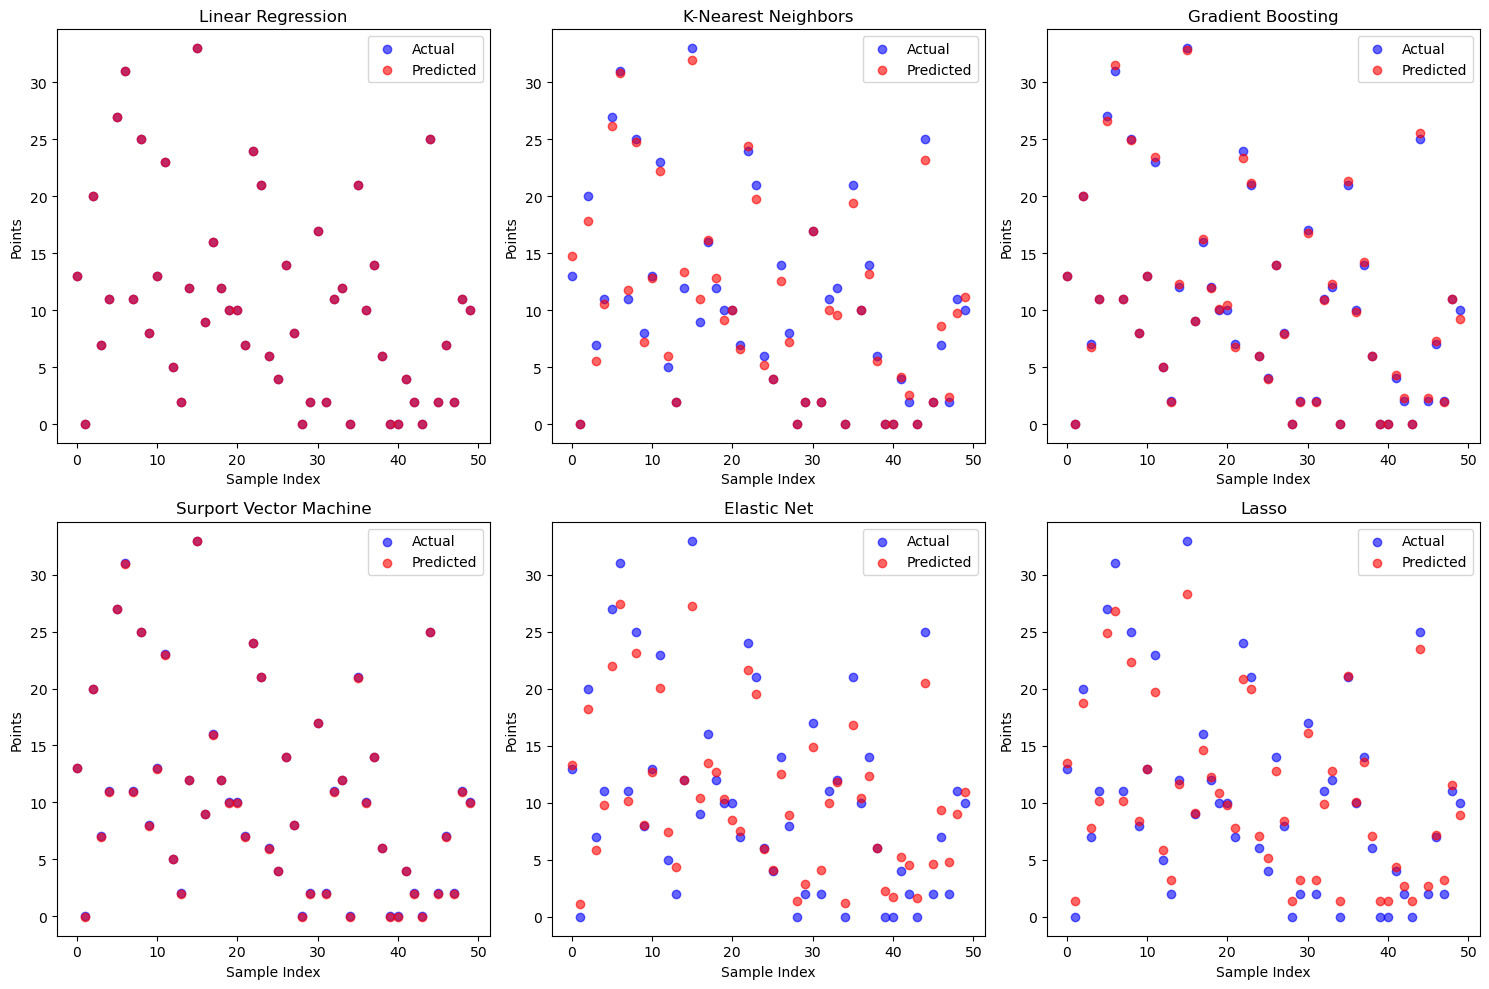
Figure 4. Scatter Plot Graph
Based on these observations, it is reasonable to conclude that both the Linear Regression and Gradient Boosting models are well-suited for predicting the specific player's performance. Their demonstrated precision and accuracy make them the most suitable choices among the models considered in this analysis. Additionally, the fact that these models outperform the other three models further reinforces their effectiveness in this predictive task.
Also, by comparing the scatter plot graph of different models, we can be inferred that the result may be the same.The scatter plot analysis reveals that in the Linear Regression model, the actual and predicted points are closely aligned, similar to the performance of the SVM model. This alignment indicates a good fit of the model to the data, enabling accurate prediction of actual values. In contrast, the predicted points of the Elastic Net and Lasso models are further away from the actual points, suggesting a certain level of bias in these two models' predictions. Among these two models, Lasso performs better in terms of overlap with some intermediate points, which could be attributed to Lasso's use of only L1 regularization, while Elastic Net uses both L1 and L2 regularizations, leading to more prediction bias. The predictions of the KNN model and Gradient Boosting Machine are in an intermediate position, indicating their prediction abilities lie between the above-mentioned models. In conclusion, the scatter plot results show differences in the prediction performance of different models, with Linear Regression and SVM performing well, while Elastic Net and Lasso perform poorly.
Additionally, the scatter plot results provide insights into the performance ranking of the models. Based on the relationship between the actual and predicted points, the models can be ranked in terms of prediction performance from best to worst as follows: Linear Regression > SVM > Gradient Boosting > KNN > Lasso > Elastic Net. This ranking is consistent with the previously calculated MSE results, further validating the differences in model performance.
Showing in the graph below, there is quite common points of views with the research done by Nguyen Hoang Nguyen, et. al. In 'The application of machine learning and deep learning in sport: predicting NBA players' performance and popularity' . Based on the analysis presented in the essay, the top-performing models on the training set, as assessed through 10-fold cross-validation, are gradient boosting, neural net, and poly svm, demonstrating notably lower mean or range values for RMSE and MAE. Specifically, these models exhibit an MAE range of 1.53 to 1.62 and an RMSE mean ranging approximately from 2.12 to 2.15, with the RMSE's MAE ranges falling within [1.47, 1.70] and [2, 2.27]. Subsequent evaluation of seven candidate models using effective data reaffirms gradient boosting, neural net, and poly svm as the top three algorithms. However, it is noteworthy that, in terms of the RMSE metric, the performance of neural net and poly svm falls below the median of the CV on the training set. In contrast, gradient boosting maintains stable results, exhibiting only a marginal increase of RMSE by 0.02 and MAE by 0.01. A comparative analysis of this study's MSE and Scatter Plot with those of another article reveals that both indicate Gradient Boosting as the optimal solution. Nonetheless, concerning the error values between the predicted plot and the actual plot, the linear regression model and the Gradient Boosting Machine Model in this study demonstrate greater precision, with a more pronounced discrepancy compared to other models.
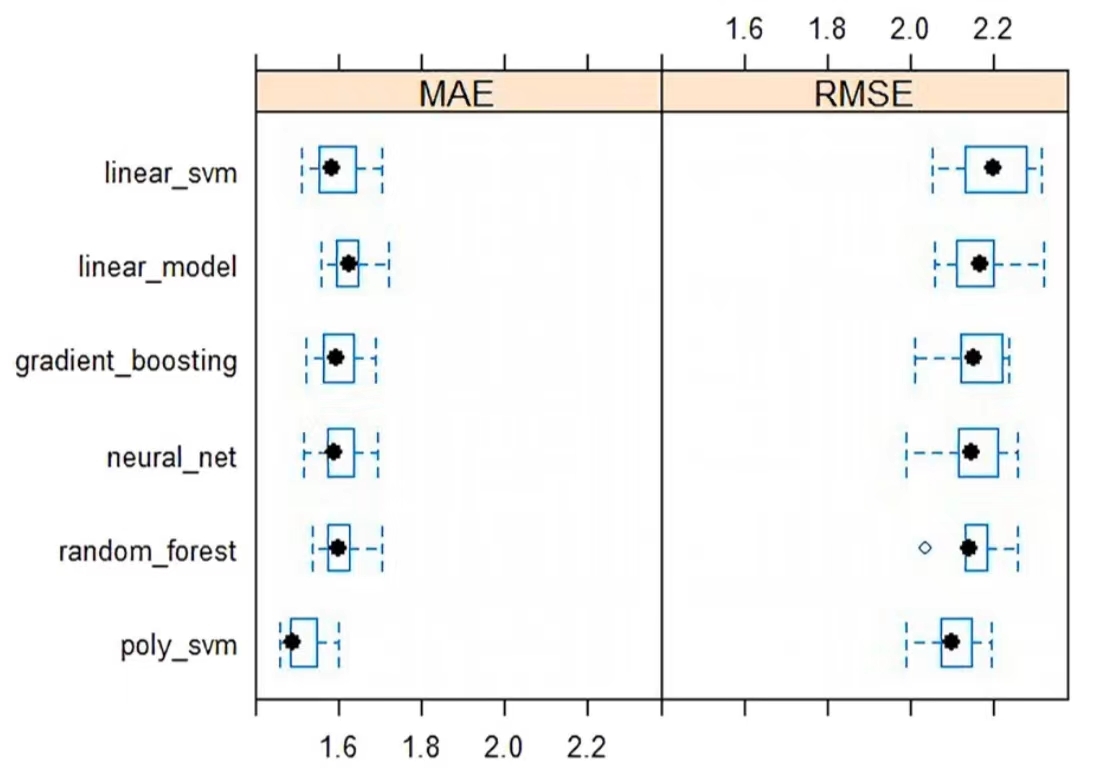
Figure 5. Comparison
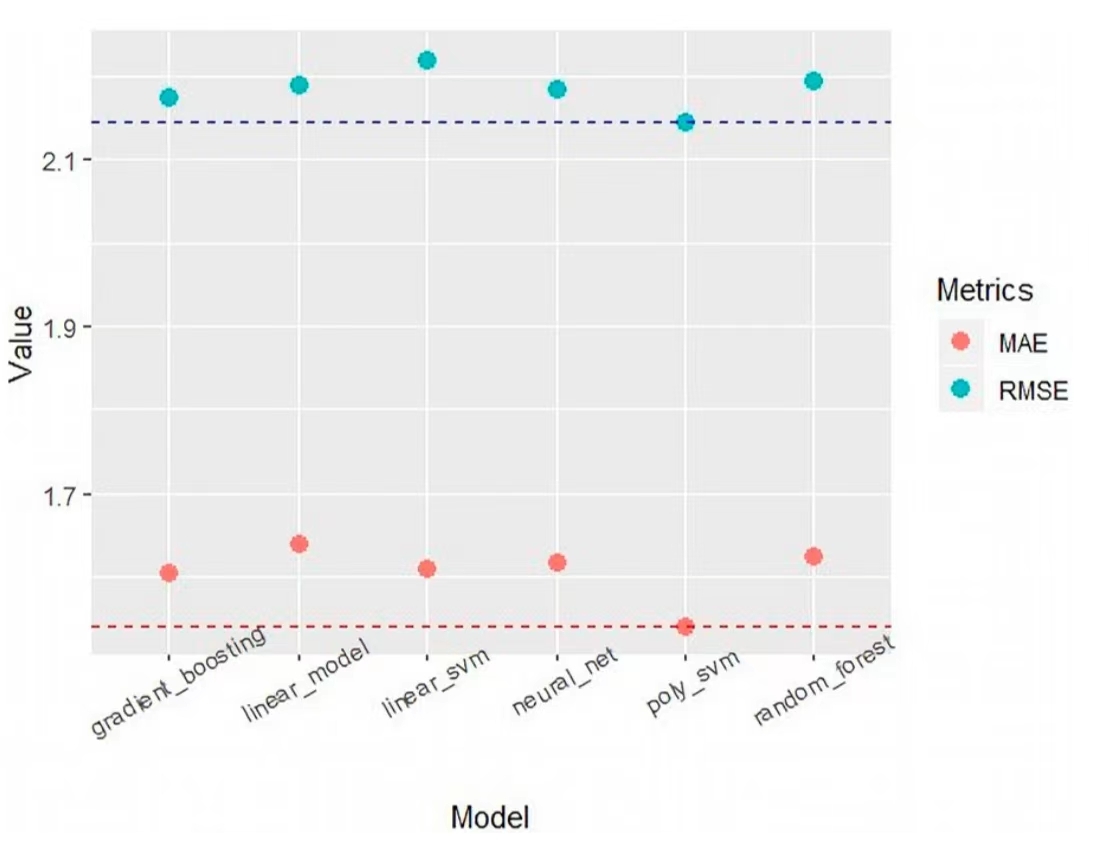
Figure 6. Model Value Comparison
In summary, the analysis of the graph suggests that the Linear Regression and Gradient Boosting models are the most suitable choices for predicting the specific player's performance due to their superior performance compared to the other models. Their ability is to provide precise and accurate predictions within a small margin of error makes them highly reliable for this predictive task.
Gradient Boosting is a powerful ensemble learning method that combines the predictions of several base estimators (typically decision trees) in a sequential manner. This approach is particularly effective for predicting basketball player performance because it can capture complex and non-linear relationships between predictors and outcomes. Additionally, Gradient Boosting corrects the errors made by previous models, leading to a strong overall model that can accurately predict player performance. According to Natekin, A., Knoll, A. (2013), whose tutorial provides a comprehensive overview of Gradient Boosting machines, explaining the underlying principles and highlighting their strengths in handling complex and non-linear relationships in data. The paper support the argument that Gradient Boosting is effective for capturing the nuances of basketball player performance data, which may exhibit complex relationships [23].
Linear Regression is well-suited for this task because it assumes a linear relationship between the independent variables (such as field goals made/attempts, rebounds, assists, etc.) and the dependent variable (points scored by players). In basketball, certain performance metrics, such as the number of field goals made, are likely to have a linear impact on the number of points scored [24].
In the context of predicting basketball player performance, features such as field goals made/attempts, rebounds, assists, etc., may exhibit linear relationships with the points scored by players. This simplicity allows Linear Regression to provide insights into which features are most important in predicting player performance [25].
Therefore, Linear Regression can effectively capture these relationships and make accurate predictions.
Overall, the effectiveness of Linear Regression and Gradient Boosting models in predicting basketball player performance can be attributed to their ability to capture the underlying relationships in the data and make accurate predictions based on these relationships.
5 Conclusion
From the model comparison, we can reach to the conclusion that Linear Regression and Gradient Boosting stand out as the most effective models for predicting specific basketball player performance. The exceptional performance of Linear Regression and Support Vector Machine (SVM) models, indicated by their lowest mean squared error (MSE) of 0.0, suggests a perfect fit to the training data. This exceptional performance indicates that both models may have effectively captured the underlying patterns in the data, resulting in highly accurate predictions. Additionally, the relatively low MSE of 0.05 for the Gradient Boosting model, though not as perfect as Linear Regression and SVM, still demonstrates a high degree of accuracy and precision in predicting player performance.
Furthermore, the notable disparity of 1.44 between the Gradient Boosting and KNN models highlights a significant difference in their predictive accuracy, with Gradient Boosting outperforming KNN. This emphasizes the importance of selecting the most appropriate model for a given predictive task. The scatter plot analysis also supports the conclusion that Linear Regression and SVM models perform well in predicting player performance, while Elastic Net and Lasso models perform poorly. The close alignment of actual and predicted points in the Linear Regression model, similar to the performance of the SVM model, indicates a good fit of the models to the data, enabling accurate prediction of actual values.
In conclusion, based on the information provided by the graph above, both Linear Regression and Gradient Boosting are well-suited for predicting specific player performance due to their precision and ability to capture complex relationships in the data. Their superior performance over other models, as indicated by the MSE and scatter plot analysis, underscores their effectiveness in this predictive task. This suggests that these models can provide valuable insights into player performance, aiding coaches and teams in making informed decisions.
References
[1]. Rodrigues, F., & Pinto, Â. (2022). Prediction of football match results with Machine Learning. Procedia Computer Science, 204, 463-470.
[2]. Bunker, R. P., & Thabtah, F. (2019). A machine learning framework for sport result prediction. Applied computing and informatics, 15(1), 27-33.
[3]. Apostolou, K., & Tjortjis, C. (2019, July). Sports Analytics algorithms for performance prediction. In 2019 10th International Conference on Information, Intelligence, Systems and Applications (IISA) (pp. 1-4). IEEE.
[4]. Mahmood, Z., Daud, A., & Abbasi, R. A. (2021). Using machine learning techniques for rising star prediction in basketball. Knowledge-Based Systems, 211, 106506.
[5]. Pifer, N. D., Mak, J. Y., Bae, W. Y., & Zhang, J. J. (2015). Examining the relationship between star player characteristics and brand equity in professional sport teams.
[6]. Thabtah, F., Zhang, L., & Abdelhamid, N. (2019). NBA game result prediction using feature analysis and machine learning. Annals of Data Science, 6(1), 103-116.
[7]. Karakaya, A., Ulu, A., & Akleylek, S. (2022). GOALALERT: A novel real-time technical team alert approach using machine learning on an IoT-based system in sports. Microprocessors and Microsystems, 93, 104606.
[8]. Nguyen, N., Ma, B., & Hu, J. (2020). Predicting National Basketball Association players performance and popularity: A data mining approach. In Computational Collective Intelligence: 12th International Conference, ICCCI 2020, Da Nang, Vietnam, November 30–December 3, 2020, Proceedings 12 (pp. 293-304). Springer International Publishing.
[9]. Nguyen, N. H., Nguyen, D. T. A., Ma, B., & Hu, J. (2022). The application of machine learning and deep learning in sport: predicting NBA players’ performance and popularity. Journal of Information and Telecommunication, 6(2), 217-235.
[10]. Wang, J., & Fan, Q. (2021, March). Application of machine learning on nba data sets. In Journal of Physics: Conference Series (Vol. 1802, No. 3, p. 032036). IOP Publishing.
[11]. Humphreys, B. R., & Johnson, C. (2020). The effect of superstars on game attendance: Evidence from the NBA. Journal of Sports Economics, 21(2), 152-175.
[12]. Cao, C. (2012). Sports data mining technology used in basketball outcome prediction.
[13]. Edouard, P., Verhagen, E., & Navarro, L. (2022). Machine learning analyses can be of interest to estimate the risk of injury in sports injury and rehabilitation. Annals of physical and rehabilitation medicine, 65(4), 101431.
[14]. Ang, Z. (2023). Application of IoT technology based on neural networks in basketball training motion capture and injury prevention. Preventive Medicine, 175, 107660.
[15]. Chen, Z., & Zhang, G. (2023). CNN sensor based motion capture system application in basketball training and injury prevention. Preventive Medicine, 174, 107644.
[16]. Martin, R. K., Pareek, A., Krych, A. J., Kremers, H. M., & Engebretsen, L. (2021). Machine learning in sports medicine: need for improvement. Journal of ISAKOS, 6(1), 1-2.
[17]. Chu, Y., Knell, G., Brayton, R. P., Burkhart, S. O., Jiang, X., & Shams, S. (2022). Machine learning to predict sports-related concussion recovery using clinical data. Annals of physical and rehabilitation medicine, 65(4), 101626.
[18]. Hinduja, S., Afrin, M., Mistry, S., & Krishna, A. (2022). Machine learning-based proactive social-sensor service for mental health monitoring using twitter data. International Journal of Information Management Data Insights, 2(2), 100113.
[19]. Friedman, J. H. (2001). Greedy function approximation: a gradient boosting machine. Annals of statistics, 1189-1232.
[20]. Hearst, M. A., Dumais, S. T., Osuna, E., Platt, J., & Scholkopf, B. (1998). Support vector machines. IEEE Intelligent Systems and their applications, 13(4), 18-28.
[21]. Zou, H., & Hastie, T. (2005). Regularization and variable selection via the elastic net. Journal of the Royal Statistical Society Series B: Statistical Methodology, 67(2), 301-320.
[22]. Ranstam, J., & Cook, J. A. (2018). LASSO regression. Journal of British Surgery, 105(10), 1348-1348.
[23]. Natekin, A., & Knoll, A. (2013). Gradient boosting machines, a tutorial. Frontiers in neurorobotics, 7, 21.
[24]. Maszczyk, A., Gołaś, A., Pietraszewski, P., Roczniok, R., Zajac, A., & Stanula, A. (2014). Application of neural and regression models in sports results prediction. Procedia-Social and Behavioral Sciences, 117, 482-487.
[25]. O’Donoghue, P., & Cullinane, A. (2011). A regression-based approach to interpreting sports performance. International Journal of Performance Analysis in Sport, 11(2), 295-307.
Cite this article
Yuan,X. (2024). Higher dimensional sports statistics and real-time game prediction. Advances in Engineering Innovation,8,9-18.
Data availability
The datasets used and/or analyzed during the current study will be available from the authors upon reasonable request.
Disclaimer/Publisher's Note
The statements, opinions and data contained in all publications are solely those of the individual author(s) and contributor(s) and not of EWA Publishing and/or the editor(s). EWA Publishing and/or the editor(s) disclaim responsibility for any injury to people or property resulting from any ideas, methods, instructions or products referred to in the content.
About volume
Journal:Advances in Engineering Innovation
© 2024 by the author(s). Licensee EWA Publishing, Oxford, UK. This article is an open access article distributed under the terms and
conditions of the Creative Commons Attribution (CC BY) license. Authors who
publish this series agree to the following terms:
1. Authors retain copyright and grant the series right of first publication with the work simultaneously licensed under a Creative Commons
Attribution License that allows others to share the work with an acknowledgment of the work's authorship and initial publication in this
series.
2. Authors are able to enter into separate, additional contractual arrangements for the non-exclusive distribution of the series's published
version of the work (e.g., post it to an institutional repository or publish it in a book), with an acknowledgment of its initial
publication in this series.
3. Authors are permitted and encouraged to post their work online (e.g., in institutional repositories or on their website) prior to and
during the submission process, as it can lead to productive exchanges, as well as earlier and greater citation of published work (See
Open access policy for details).
References
[1]. Rodrigues, F., & Pinto, Â. (2022). Prediction of football match results with Machine Learning. Procedia Computer Science, 204, 463-470.
[2]. Bunker, R. P., & Thabtah, F. (2019). A machine learning framework for sport result prediction. Applied computing and informatics, 15(1), 27-33.
[3]. Apostolou, K., & Tjortjis, C. (2019, July). Sports Analytics algorithms for performance prediction. In 2019 10th International Conference on Information, Intelligence, Systems and Applications (IISA) (pp. 1-4). IEEE.
[4]. Mahmood, Z., Daud, A., & Abbasi, R. A. (2021). Using machine learning techniques for rising star prediction in basketball. Knowledge-Based Systems, 211, 106506.
[5]. Pifer, N. D., Mak, J. Y., Bae, W. Y., & Zhang, J. J. (2015). Examining the relationship between star player characteristics and brand equity in professional sport teams.
[6]. Thabtah, F., Zhang, L., & Abdelhamid, N. (2019). NBA game result prediction using feature analysis and machine learning. Annals of Data Science, 6(1), 103-116.
[7]. Karakaya, A., Ulu, A., & Akleylek, S. (2022). GOALALERT: A novel real-time technical team alert approach using machine learning on an IoT-based system in sports. Microprocessors and Microsystems, 93, 104606.
[8]. Nguyen, N., Ma, B., & Hu, J. (2020). Predicting National Basketball Association players performance and popularity: A data mining approach. In Computational Collective Intelligence: 12th International Conference, ICCCI 2020, Da Nang, Vietnam, November 30–December 3, 2020, Proceedings 12 (pp. 293-304). Springer International Publishing.
[9]. Nguyen, N. H., Nguyen, D. T. A., Ma, B., & Hu, J. (2022). The application of machine learning and deep learning in sport: predicting NBA players’ performance and popularity. Journal of Information and Telecommunication, 6(2), 217-235.
[10]. Wang, J., & Fan, Q. (2021, March). Application of machine learning on nba data sets. In Journal of Physics: Conference Series (Vol. 1802, No. 3, p. 032036). IOP Publishing.
[11]. Humphreys, B. R., & Johnson, C. (2020). The effect of superstars on game attendance: Evidence from the NBA. Journal of Sports Economics, 21(2), 152-175.
[12]. Cao, C. (2012). Sports data mining technology used in basketball outcome prediction.
[13]. Edouard, P., Verhagen, E., & Navarro, L. (2022). Machine learning analyses can be of interest to estimate the risk of injury in sports injury and rehabilitation. Annals of physical and rehabilitation medicine, 65(4), 101431.
[14]. Ang, Z. (2023). Application of IoT technology based on neural networks in basketball training motion capture and injury prevention. Preventive Medicine, 175, 107660.
[15]. Chen, Z., & Zhang, G. (2023). CNN sensor based motion capture system application in basketball training and injury prevention. Preventive Medicine, 174, 107644.
[16]. Martin, R. K., Pareek, A., Krych, A. J., Kremers, H. M., & Engebretsen, L. (2021). Machine learning in sports medicine: need for improvement. Journal of ISAKOS, 6(1), 1-2.
[17]. Chu, Y., Knell, G., Brayton, R. P., Burkhart, S. O., Jiang, X., & Shams, S. (2022). Machine learning to predict sports-related concussion recovery using clinical data. Annals of physical and rehabilitation medicine, 65(4), 101626.
[18]. Hinduja, S., Afrin, M., Mistry, S., & Krishna, A. (2022). Machine learning-based proactive social-sensor service for mental health monitoring using twitter data. International Journal of Information Management Data Insights, 2(2), 100113.
[19]. Friedman, J. H. (2001). Greedy function approximation: a gradient boosting machine. Annals of statistics, 1189-1232.
[20]. Hearst, M. A., Dumais, S. T., Osuna, E., Platt, J., & Scholkopf, B. (1998). Support vector machines. IEEE Intelligent Systems and their applications, 13(4), 18-28.
[21]. Zou, H., & Hastie, T. (2005). Regularization and variable selection via the elastic net. Journal of the Royal Statistical Society Series B: Statistical Methodology, 67(2), 301-320.
[22]. Ranstam, J., & Cook, J. A. (2018). LASSO regression. Journal of British Surgery, 105(10), 1348-1348.
[23]. Natekin, A., & Knoll, A. (2013). Gradient boosting machines, a tutorial. Frontiers in neurorobotics, 7, 21.
[24]. Maszczyk, A., Gołaś, A., Pietraszewski, P., Roczniok, R., Zajac, A., & Stanula, A. (2014). Application of neural and regression models in sports results prediction. Procedia-Social and Behavioral Sciences, 117, 482-487.
[25]. O’Donoghue, P., & Cullinane, A. (2011). A regression-based approach to interpreting sports performance. International Journal of Performance Analysis in Sport, 11(2), 295-307.