


1 Introduction
With the rapid growth of Semantic Web data and the trend of major search engine companies establishing knowledge graphs, the medical field is no exception. Increasing amounts of medical data are being processed semantically, forming Linked Open Data (LOD) such as Linked Open Drug Data and Linked Life Data. The emergence of these datasets provides rich resources for knowledge sharing and utilization in the medical field. Meanwhile, knowledge graphs, as a knowledge representation method characterized by semantics, easy linkage, and expandability, have also garnered attention and acceptance in the medical community.
A Traditional Chinese Medicine (TCM) knowledge graph, as a comprehensive information integration and analysis tool, holds significant research importance and practical application value in the medical field. Firstly, constructing a comprehensive TCM knowledge graph helps systematically and accurately record TCM theories, clinical experiences, and treatment methods, providing scientific basis and technical support for the inheritance and development of TCM culture. This not only aids in the preservation and transmission of TCM culture but also promotes the modernization and popularization of TCM theories, driving TCM to the global stage. Secondly, the application of the TCM knowledge graph will profoundly impact various segments of the healthcare industry chain. In clinical medicine, an intelligent diagnosis system based on the TCM knowledge graph can assist doctors in more accurately diagnosing diseases and formulating personalized treatment plans, thus improving the level of healthcare and service quality. In medical research, the TCM knowledge graph can provide researchers with abundant medical data and knowledge resources, accelerating the research process and fostering innovation and development in medical science and technology. Furthermore, the TCM knowledge graph is expected to become an important technical support and innovation driver for the TCM industry. By integrating cutting-edge technologies such as big data and artificial intelligence, it can achieve digital and intelligent upgrades in the TCM industry, enhancing the core competitiveness and market influence of the TCM industry.
This project aims to build a TCM knowledge graph to establish a TCM information service platform, providing users with TCM knowledge, drug information, health consultations, and other services. Users can access diagnostic and treatment plans in the TCM field, promoting the dissemination and application of TCM. Through the search function, users can quickly and accurately obtain the required TCM information. Whether patients, doctors, researchers, or students, they can conveniently find relevant TCM knowledge, drug information, and disease treatment plans by searching the knowledge graph, saving time and effort. Researchers can search for relevant TCM functions, helping them quickly locate scientific literature, clinical trial data, and research findings, supporting scientific research work. Students and medical personnel can use the search function to learn and master TCM knowledge, drug formulations, and clinical skills, promoting effective TCM education and training.
2 Related Technologies
There are numerous technologies related to knowledge graphs, and the following will introduce some of these technologies [1, 2].
2.1 Knowledge graph construction technology
The construction of a knowledge graph is the foundation of the entire system. This process involves extracting and organizing structured information from raw data to form associations between entities, relationships, and attributes. Entities are the basic elements of a knowledge graph, representing concrete objects or concepts in the real world. Entity extraction technology is used to identify and extract uniquely identifiable entities from text data, such as people, places, organizations, etc. Common entity extraction methods include rule-based matching, dictionary-based matching, and machine learning-based entity recognition. Specific extraction techniques will be detailed later. Relationships represent the connections or associations between entities and are crucial components of a knowledge graph. Relationship extraction technology is used to identify and extract relationships between entities from text data. Attributes are characteristics or features of entities and relationships, used to describe the properties of entities or the features of relationships. Attribute extraction technology is used to identify and extract attribute information of entities and relationships from text data. Entity Linking technology is used to link entities extracted from text to existing entities in the knowledge graph. This includes techniques like entity disambiguation, entity alignment, and entity matching, aiming to associate and correspond the entities in the text with those in the knowledge graph.
The construction technology of the knowledge graph is a critical part of the knowledge graph system, and its quality and accuracy directly affect the performance and effectiveness of the entire system. By comprehensively using entity extraction, relationship extraction, attribute extraction, and entity linking technologies, a rich, accurate, and complete knowledge graph can be constructed, providing a reliable foundation for subsequent applications.
2.2 Knowledge extraction and data extraction technology
In the aforementioned steps, extraction technology is crucial. Knowledge extraction and data extraction technologies are important steps in constructing a knowledge graph. They involve extracting structured information from various data sources and transforming it into a form suitable for graph construction. Below, we introduce the extraction techniques for different data sources:
2.2.1 Knowledge extraction technologies
•Text Extraction: Text extraction is the process of extracting structured information from text data, including entities, relationships, and attributes. Text data sources include books, journal articles, news reports, social media content, blog posts, emails, and web texts. Common text extraction techniques include entity recognition, named entity recognition (NER), relationship extraction, event extraction, and sentiment analysis. These techniques can be implemented using rules, machine learning, and deep learning methods. Named Entity Recognition (NER): NER is the process of identifying named entities from text, such as people’s names, place names, and organization names. NER technology typically uses rule-based methods or machine learning methods, such as Conditional Random Fields (CRF) and Recurrent Neural Networks (RNN). Relationship Extraction: This process involves extracting relationships between entities from text, such as “collaborative relationships between people” or “therapeutic relationships between drugs and diseases.” Relationship extraction techniques can use pattern-matching methods or deep learning methods. Attribute Extraction: Attribute extraction is the process of extracting attributes or features of entities from text, such as “a person’s age” or “the latitude and longitude of a place.” Attribute extraction techniques usually combine entity recognition and relationship extraction to extract richer and more detailed information.
•Semantic Extraction: Semantic extraction is the process of extracting structured data with semantic information from data, making it easier for computers to understand and process. Semantic extraction techniques can transform data into structured information with semantic tags to support more precise knowledge representation and reasoning. Common semantic extraction techniques include semantic annotation, ontology learning, semantic role labeling, and semantic relationship extraction. Semantic Annotation: This is the process of adding semantic tags to entities, relationships, and attributes in text data to facilitate computer understanding and processing. Semantic annotation techniques can use dictionaries, ontologies, and semantic rules. Ontology Learning: Ontology learning is the process of automatically learning domain ontologies from data, including entity types, attribute definitions, and relationship types. Ontology learning techniques can use machine learning algorithms and knowledge representation learning methods.
2.2.2 Data extraction technologies
•Information Extraction: Information extraction is the process of extracting structured information from unstructured or semi-structured data, including tabular data, web data, and multimedia data. Information extraction techniques can transform data into structured entities, relationships, and attributes to build a knowledge graph. Common information extraction techniques include table parsing, web crawling, image recognition, and video analysis. Table Parsing: This involves extracting information from structured tabular data, such as Excel sheets and database tables. Table parsing techniques can identify entities, attributes, and relationships in tables and convert them into graph data formats. Web Crawlers: Web crawlers are programs that automatically collect information from the internet. They can scrape data from web pages, news sites, forums, and other online sources and convert it into structured data formats. Image Recognition and Video Analysis: These processes involve extracting useful information from image and video data, such as object recognition, scene understanding, and behavior analysis. These techniques can be implemented using deep learning models, such as Convolutional Neural Networks (CNN) and Recurrent Neural Networks (RNN).
•Multimodal Extraction: Multimodal extraction is the process of extracting structured information from multiple data modalities, including text, images, videos, audio, and sensor data. Multimodal extraction techniques can integrate data from different modalities to form richer and more comprehensive knowledge representations. Common multimodal extraction techniques include multimodal fusion, cross-modal matching, and cross-modal reasoning.
2.3 Different visualization methods of knowledge graphs
After successfully scaling the extraction of entities and data, the type of graph constructed should be chosen based on different scenarios. When it comes to visualizing knowledge graphs, there are several different representation methods available, each with its unique features and applicable scenarios.
•Graph Network: This method represents entities as nodes and relationships between entities as edges, highlighting the connections between entities. It is suitable for displaying complex association networks between entities, such as social networks and entity relationships in knowledge graphs. This method clearly shows both direct and indirect associations between entities, helping users understand the connection patterns and paths between entities.
•Ontology Graph: This graphical representation is based on an ontology model, emphasizing the hierarchical structure and semantic relationships between concepts and entities. It is suitable for displaying the ontology structure and semantic relationships in knowledge graphs, helping users understand the conceptual system and semantic associations between entities. Ontology graphs are appropriate for knowledge engineering and domain-specific knowledge graph displays.
•Relation Matrix: This method represents the relationships between entities in matrix form, emphasizing the strength or correlation of relationships between entities. It is suitable for displaying complex relationship patterns and connection densities between entities, especially in cases with many intersecting relationships. Relation matrices can help users discover potential associations and correlations between entities, supporting relationship analysis and mining.
•Map Visualization: This method represents entities as nodes and edges in a geographical space, using the spatial layout of maps to display the geographical relationships and spatial distribution between entities. It is suitable for displaying knowledge graphs with geographical attributes, such as geographic information knowledge graphs and geographical markers. Map visualization can intuitively present the geographical location information of entities, helping users understand the distribution and associations of entities in geographical space.
•Timeline Visualization: This method represents entities and events as nodes and events on a timeline, highlighting the chronological order and evolutionary process between entities. It is suitable for displaying the temporal relationships and sequential evolution of entities and events, such as historical event timelines and product life cycles. Timeline visualization can help users understand the development and chronological order of events, supporting time analysis and trend prediction.
•Tree Structure: This method represents entities as a tree structure, highlighting the hierarchical relationships and parent-child structures between entities. It is suitable for displaying knowledge graphs with clear hierarchical structures, such as classification systems and organizational structures. Tree structure graphs can clearly present the hierarchical relationships and organizational structures between entities, helping users understand the hierarchical associations and structural organization of entities.
2.4 Comparison and selection of different graph databases
In this project, selecting a graph database to illustrate the relationships among the data is crucial. Here are some mainstream graph databases along with their characteristics and advantages and disadvantages:
Neo4j: Neo4j is a graph-based database management system that stores and processes data in the form of graphs. It provides efficient graph algorithms and the query language Cypher. Neo4j is suitable for applications requiring the handling of complex relationships and network structures, such as social network analysis and recommendation systems.
Amazon Neptune: Amazon Neptune is a fully managed graph database service launched by Amazon. It is compatible with graph database features and offers high reliability and scalability. Amazon Neptune is suitable for scenarios requiring the construction and deployment of graph database applications in a cloud environment.
OrientDB: OrientDB is a multi-model database management system that supports various data models, including graph databases, document databases, and object databases. OrientDB has a flexible data model and powerful query capabilities, making it suitable for complex data relationship analysis and query tasks.
TigerGraph: TigerGraph is a distributed graph database management system that focuses on handling large-scale graph data. It provides high-performance graph algorithms and query engines. TigerGraph is suitable for high-performance applications requiring the processing of large-scale graph datasets.
When selecting an appropriate graph database, it is necessary to consider the characteristics and use cases of each system. Neo4j, as a mature and stable graph database management system, has extensive application and rich community support. It provides powerful graph database features, including efficient graph query language Cypher, scalable graph algorithm library, and flexible data model. Amazon Neptune is a fully managed graph database service with good reliability and scalability, making it easy to integrate with other AWS services. OrientDB is a multi-model database management system that supports various data models such as graph database, document database, and object database, with flexible data models and powerful query capabilities. TigerGraph focuses on handling large-scale graph data and provides high-performance graph algorithms and query engines, with good scalability and efficient data processing capabilities.
However, these graph databases also have their limitations. Neo4j’s deployment and management are relatively complex, leading to higher deployment costs; Amazon Neptune requires additional service fees and is subject to limitations imposed by cloud service providers; OrientDB may lag slightly behind in graph database performance; and TigerGraph’s deployment and management are relatively complex, requiring additional hardware resources to support large-scale data sets. Therefore, when choosing a graph database, it is necessary to comprehensively consider factors such as performance, functionality, cost, and deployment to ensure that it can meet the specific requirements of the application scenario.
The reason for choosing Neo4j as the graph database for this project is multifaceted. Firstly, Neo4j is a mature and stable graph database management system that has been widely applied and verified in various fields. Its stability and reliability can meet the project’s requirements for data storage and management. Secondly, the traditional Chinese medicine knowledge graph involved in the project has a complex relationship structure and entity connections, making it very suitable for storage and querying with a graph database. Neo4j provides professional graph database features, including efficient graph query language Cypher and flexible data models, which can effectively handle and manage graph data. Additionally, Neo4j has a user-friendly interface and easy-to-understand query language, enabling users to easily perform data import, querying, and visualization operations. In summary, Neo4j is a mature, stable, graph-focused, user-friendly, and well-supported graph database management system that can meet the project’s requirements for data storage, querying, and visualization, making it an ideal choice.
2.5 Applications of knowledge graphs
Nowadays, knowledge graphs are widely applied in our daily lives, and the following applications are closely related to our lives:
•Recommendation Systems: In e-commerce platforms, video websites, social media, and other fields, recommendation systems help users discover items such as products, videos, news, and friends that they may be interested in, thereby enhancing user experience and satisfaction. Implementation: Firstly, it is necessary to collect user behavior data and item information and preprocess and clean them to build a user-item interaction graph. This can be achieved by collecting user behavior data such as clicks, purchases, ratings, and item attribute information. Based on the collected data, construct user nodes, item nodes, and the interaction relationships between users and items to form a user-item interaction graph. This can be implemented using graph databases or graph processing frameworks such as Neo4j and GraphX. Utilizing the information of nodes and edges in the graph, apply recommendation algorithms such as graph-based random walk, matrix factorization, and label propagation to perform personalized recommendations. The algorithms can discover user interests and associations between items through graph traversal or iteration.
•Retrieval Systems: Graphs can be used to build intelligent retrieval systems by modeling entities and attributes in documents or data as nodes and edges in a graph [3]. Efficient information retrieval can be achieved using graph search algorithms such as graph traversal and graph matching technologies. Indexing techniques and query optimization techniques can be employed to improve retrieval efficiency, combined with natural language processing techniques to implement semantic search. Implementation: Model entities, attributes, and relationships in documents or data as nodes and edges of a graph and build indexes to accelerate retrieval. This can be achieved by entity extraction, relationship extraction, and text indexing using text processing techniques. Upon receiving user query requests, utilize graph search algorithms such as depth-first search, breadth-first search, and Dijkstra’s algorithm to process queries in the graph. Query expansion and result ranking based on the semantics of user queries can be performed to improve retrieval efficiency and accuracy. Present the query results to users in a visualized manner, providing interactive retrieval interfaces and diverse presentation formats such as lists, graphs, and maps to meet users’ different needs and preferences.
•Question Answering System: Graphs can be utilized to construct intelligent question answering systems by mapping questions and entities with relationships in knowledge bases to graphs [4]. Graph search and reasoning techniques are employed to answer user queries. Natural language processing techniques are combined for question understanding and answer generation, along with dialogue management techniques for user interaction. Implementation: Questions and entities, attributes, and relationships in the knowledge base are structured into a graph and stored in a graph database. This can be achieved through semantic understanding and knowledge extraction using natural language processing techniques to transform questions into graph search queries. Based on the user’s question, graph search and reasoning are performed in the graph to find entities and relationships relevant to the question and generate corresponding answers. Techniques such as graph traversal, graph matching, and path reasoning can be utilized. The generated answers are replied to the user in natural language, and dialogue interaction is conducted to address user inquiries and needs. Dialogue management techniques can be integrated to facilitate multi-turn dialogue and context understanding, enhancing the system’s interactivity and intelligence.
•E-commerce Recommendation: Graphs can be employed to build e-commerce recommendation systems by analyzing user behavior, item attributes, and relationships between users and items. Recommendation algorithms and personalized sorting techniques are utilized to recommend products that align with user preferences and needs. Implementation: Analyze user behavior and preferences, including browsing history, purchase records, evaluations, etc., to form user profiles and interest tags. Extract attributes and features of items, including item descriptions, categories, tags, etc., to form item feature vectors. Based on user profiles and item features, employ recommendation algorithms such as collaborative filtering, content recommendation, deep learning models, etc., for personalized recommendations. Real-time recommendation or offline batch processing can be used to generate recommendation results.
In addition to common applications such as recommendation systems, retrieval systems, question answering systems, search engines, and e-commerce recommendations, there are also novel and innovative applications in the field of graph technology.
•Medical and Health Field: Personalized Health Management: Construct a health graph based on individual health data and medical knowledge to achieve personalized health management and health risk prediction. It can integrate data such as the user’s medical history, genetic information, and lifestyle habits to provide personalized health advice and preventive measures. Drug Interaction Analysis: Establish a knowledge graph of drug interactions to analyze the interaction relationships, side effects, and contraindications of drugs, providing guidance and suggestions for clinical medication.
•Intelligent Transportation Field: Traffic Route Optimization: Build a transportation network graph, including information about roads, transportation hubs, and vehicles. Through route planning and traffic state prediction, optimize traffic routes and provide travel advice to reduce traffic congestion and travel time. Intelligent Traffic Management: Utilize the transportation graph to analyze traffic flow, vehicle density, and other data to achieve intelligent traffic signal control and traffic regulation, improving traffic operation efficiency and road safety.
•Environmental Protection Field: Environmental Monitoring and Early Warning: Construct an environmental graph based on environmental monitoring data and pollution factors to achieve environmental quality monitoring and pollution source tracking. Through graph analysis and prediction, environmental problems can be detected in advance, and corresponding measures can be taken to protect the ecological environment and human health.
•Cultural Inheritance Field: Integration and Dissemination of Cultural Resources: Build a cultural resource graph, including information about cultural relics, historical events, biographies, etc., to achieve the integration, sharing, and dissemination of cultural resources. Using graph technology, the associated relationships of cultural heritage can be organized, cultural connotations and historical values can be excavated, promoting cultural inheritance and innovation.
These novel applications of graphs not only expand the application scope of graph technology but also provide new ideas and methods for solving complex real-world problems. Through in-depth exploration and application of graph technology, digital transformation and intelligent development across various industries can be promoted, realizing more efficient and intelligent application scenarios.
3 Core work
3.1 Preliminary preparation
In the initial stage of this project, we focused on the preparation work to ensure the smooth progress of the subsequent knowledge graph construction. This stage mainly involved the configuration of the programming environment and the task of knowledge graph entity extraction. With the continuous development of artificial intelligence and natural language processing technologies, the construction of knowledge graphs, as an important means of knowledge representation and reasoning, especially holds significant application prospects in the medical field. Therefore, we undertook the following preparatory work to ensure that the project could proceed smoothly and yield effective results.
In the first stage of the research tasks, preliminary preparation and entity extraction are key tasks. Firstly, it is necessary to configure the Python programming environment and have an understanding of the basics of the Python language. This includes learning Python syntax, data structures, functions, etc., to facilitate subsequent programming work. Familiarity with variables, data types, learning how to open files, read file contents, write file contents, etc., is essential for handling text data. Learning how to use Python’s json module to parse JSON-formatted data is necessary to extract the required information from the medical case JSON data.
3.2 Data extraction and processing
Medical case data are case information recorded by doctors, presented in semi-structured data form. Each medical case includes fields such as the case title, doctor’s name, department, and case details. The case details contain the patient’s personal information, visit time, chief complaint, present illness history, tongue quality, tongue coating, pulse condition, symptoms at the moment, past medical history, auxiliary examination, syndrome differentiation analysis, traditional Chinese medicine diagnosis, Western medicine diagnosis, traditional Chinese medicine syndrome, treatment principles and methods, prescription name, composition, usage, medical advice, etc. The medical case data are sourced from the internet and are about cases of traditional Chinese medicine treatment. Each medical case has different patient names, visit times, solar terms, chief complaints, present illness histories, etc., but they all contain similar medical information, such as tongue quality, tongue coating, pulse condition, etc. Doctors make syndrome differentiation and treatment based on the patient’s symptoms and signs, formulating corresponding prescriptions and medical advice. These medical case data are presented in JSON format, facilitating storage and processing. When processing the data, it is possible to extract the required fields and information by parsing JSON for further analysis and application.
Entity extraction involves designing corresponding algorithms based on specific tasks and data characteristics. In the entity extraction process of medical case data, the following steps are involved:
•File Reading: Open the medical case data file using Python’s file operation functions and load its content into memory using the json module for subsequent processing.
•JSON Parsing: Utilize the json.loads() method to parse the JSON-formatted data in the medical case data file into a Python dictionary, enabling it to be manipulated by Python programs.
•Data Traversal: Traverse the parsed medical case data, accessing each medical case and its relevant fields for subsequent entity extraction.
•Entity Identification: Identify entities in the medical case based on pre-defined rules, such as drugs, diseases, etc. This includes checking for fields like prescription name, traditional Chinese medicine diagnosis, composition, etc., and excluding cases with missing information.
•Entity Extraction: Extract the identified entity information and perform formatting. By generating random entity IDs and outputting entity relationships, write the entity information to the output file for subsequent storage and analysis.
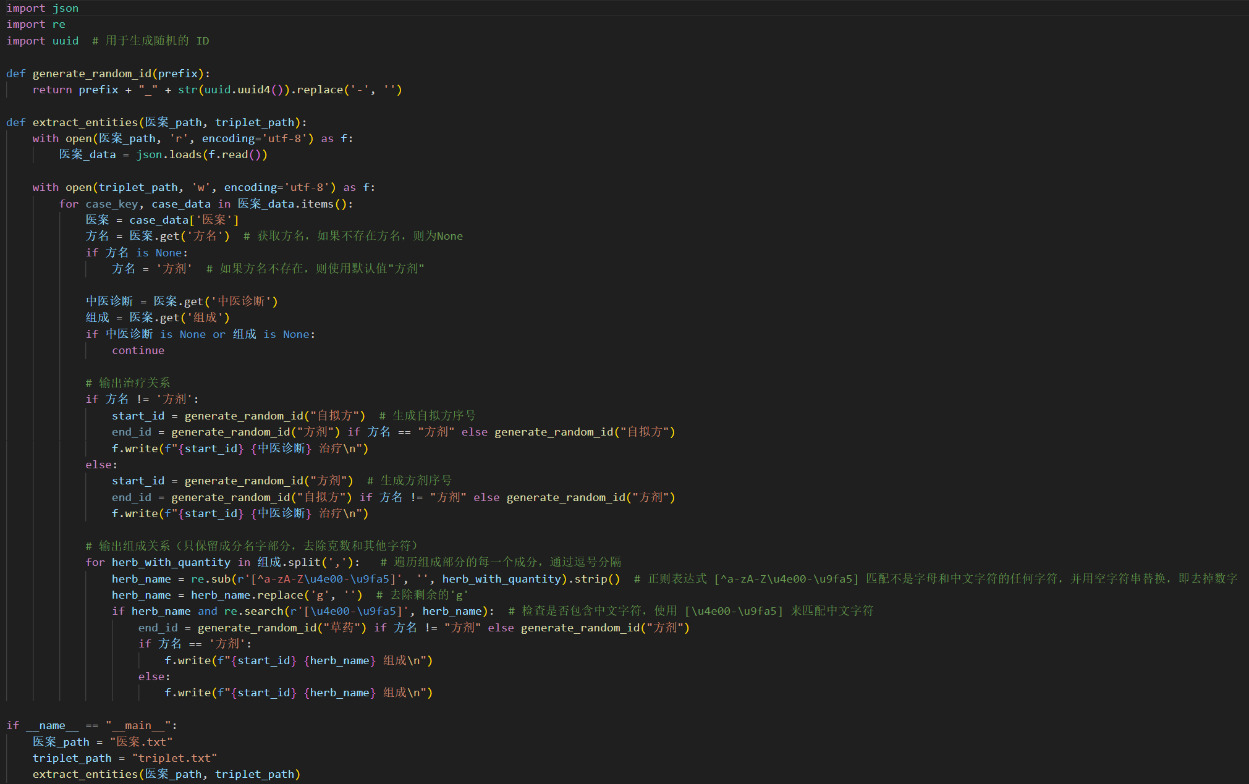
Figure 1. Code Example for the entity extraction process of medical case data
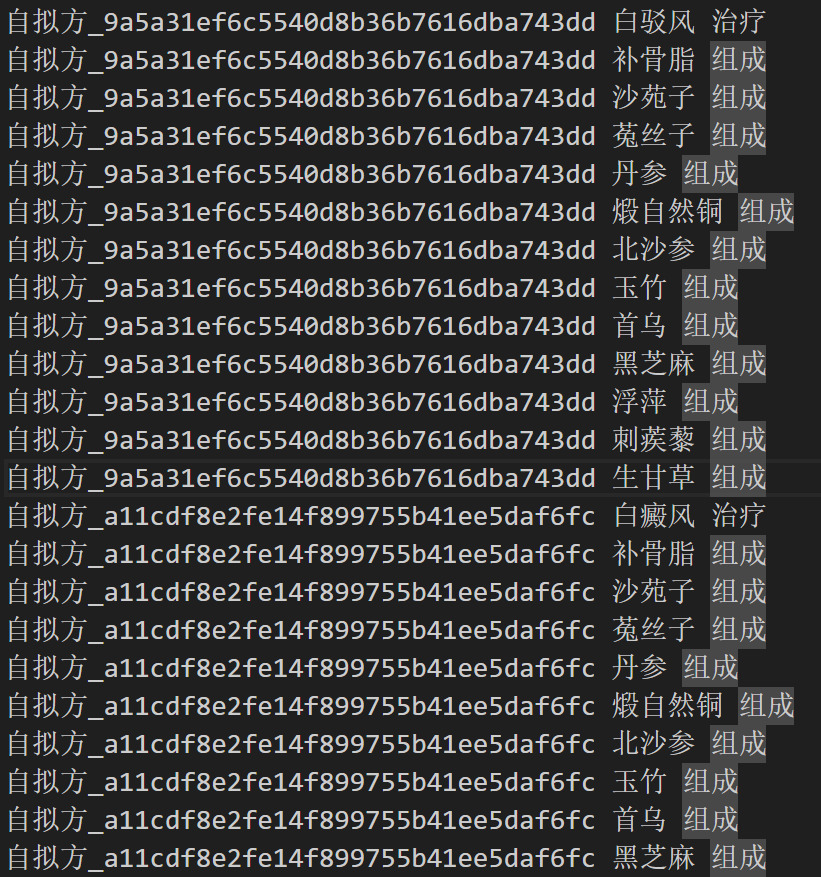
Figure 2. Extract the names of components and output the composition relationship triples
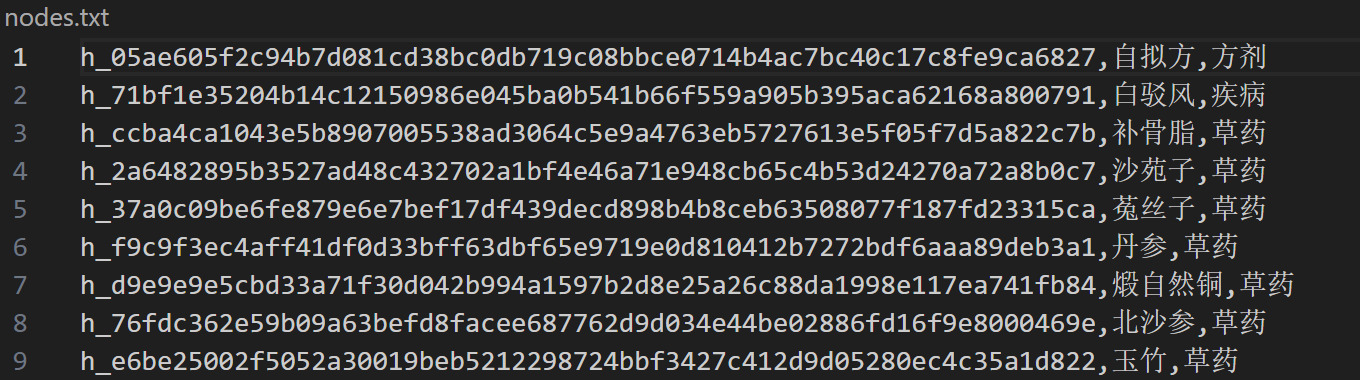
Figure 3. To import data into the neo4j data graph, extract nodes in the neo4j database using the same steps
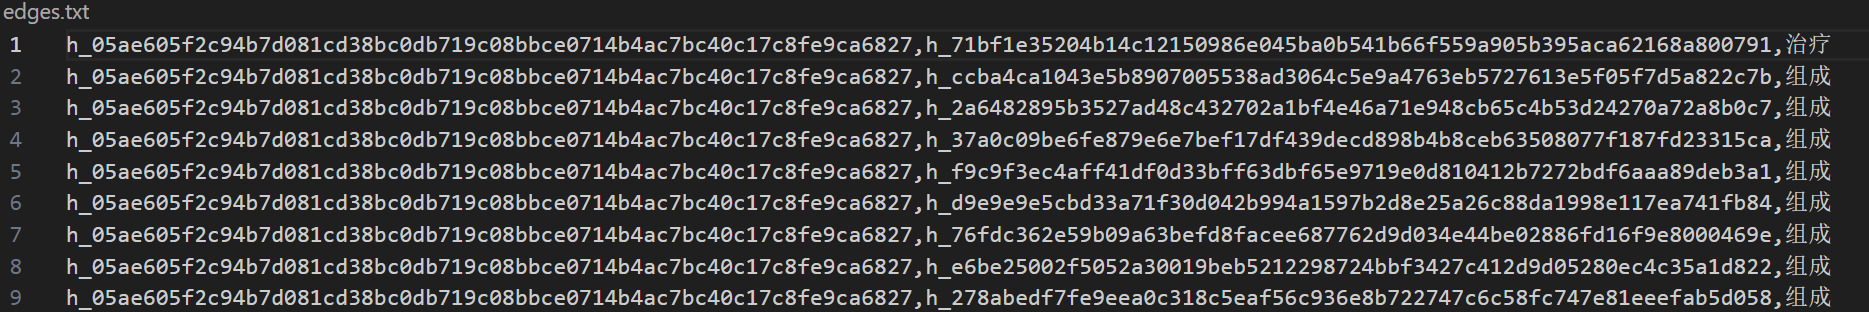
Figure 4. To import data into the neo4j data graph, extract edges in the neo4j database using the same steps
3.3 Importing data into Neo4j database
Install and configure the Neo4j graph database, ensuring that the database server is started and available. This includes downloading and installing the Neo4j software, setting up database connection parameters, and starting the database service. The detailed process of importing data into the database is as follows:
•Connect to the Database: Use the Neo4j Python driver to connect to the Neo4j database via the Bolt protocol, providing connection URI, username, and password.
•Read Node and Edge Files: Use Python’s file operation functions to open node and edge files, respectively read their contents, and store them in memory for subsequent processing.
•Create Nodes: Process the node file line by line, skip the file header, parse the data of each line, extract node IDs, names, labels, etc. Then, use the Cypher query language to build MERGE statements to insert nodes into the database. Here, the MERGE statement ensures the uniqueness of nodes, and if the node already exists, it will not be inserted again.
•Create Relationships: Process the edge file line by line, skip the file header, parse the data of each line, extract the start node ID, end node ID, and relationship type, etc. Then, use the Cypher query language to build MATCH and MERGE statements to insert edges into the database. The MATCH statement is used to find start and end nodes, while the MERGE statement is used to create relationships. Here, the uniqueness of relationships is also ensured to avoid duplicate insertion of relationships.
•Close Session and Driver: After the data import is completed, close the session and driver with the database, release resources, and ensure a safe connection closure.
This process utilizes the graph structure characteristics of the Neo4j database, organizing and storing data in the form of nodes and relationships, presenting the data in a graphical structure in the database, which is convenient for subsequent query and analysis operations.
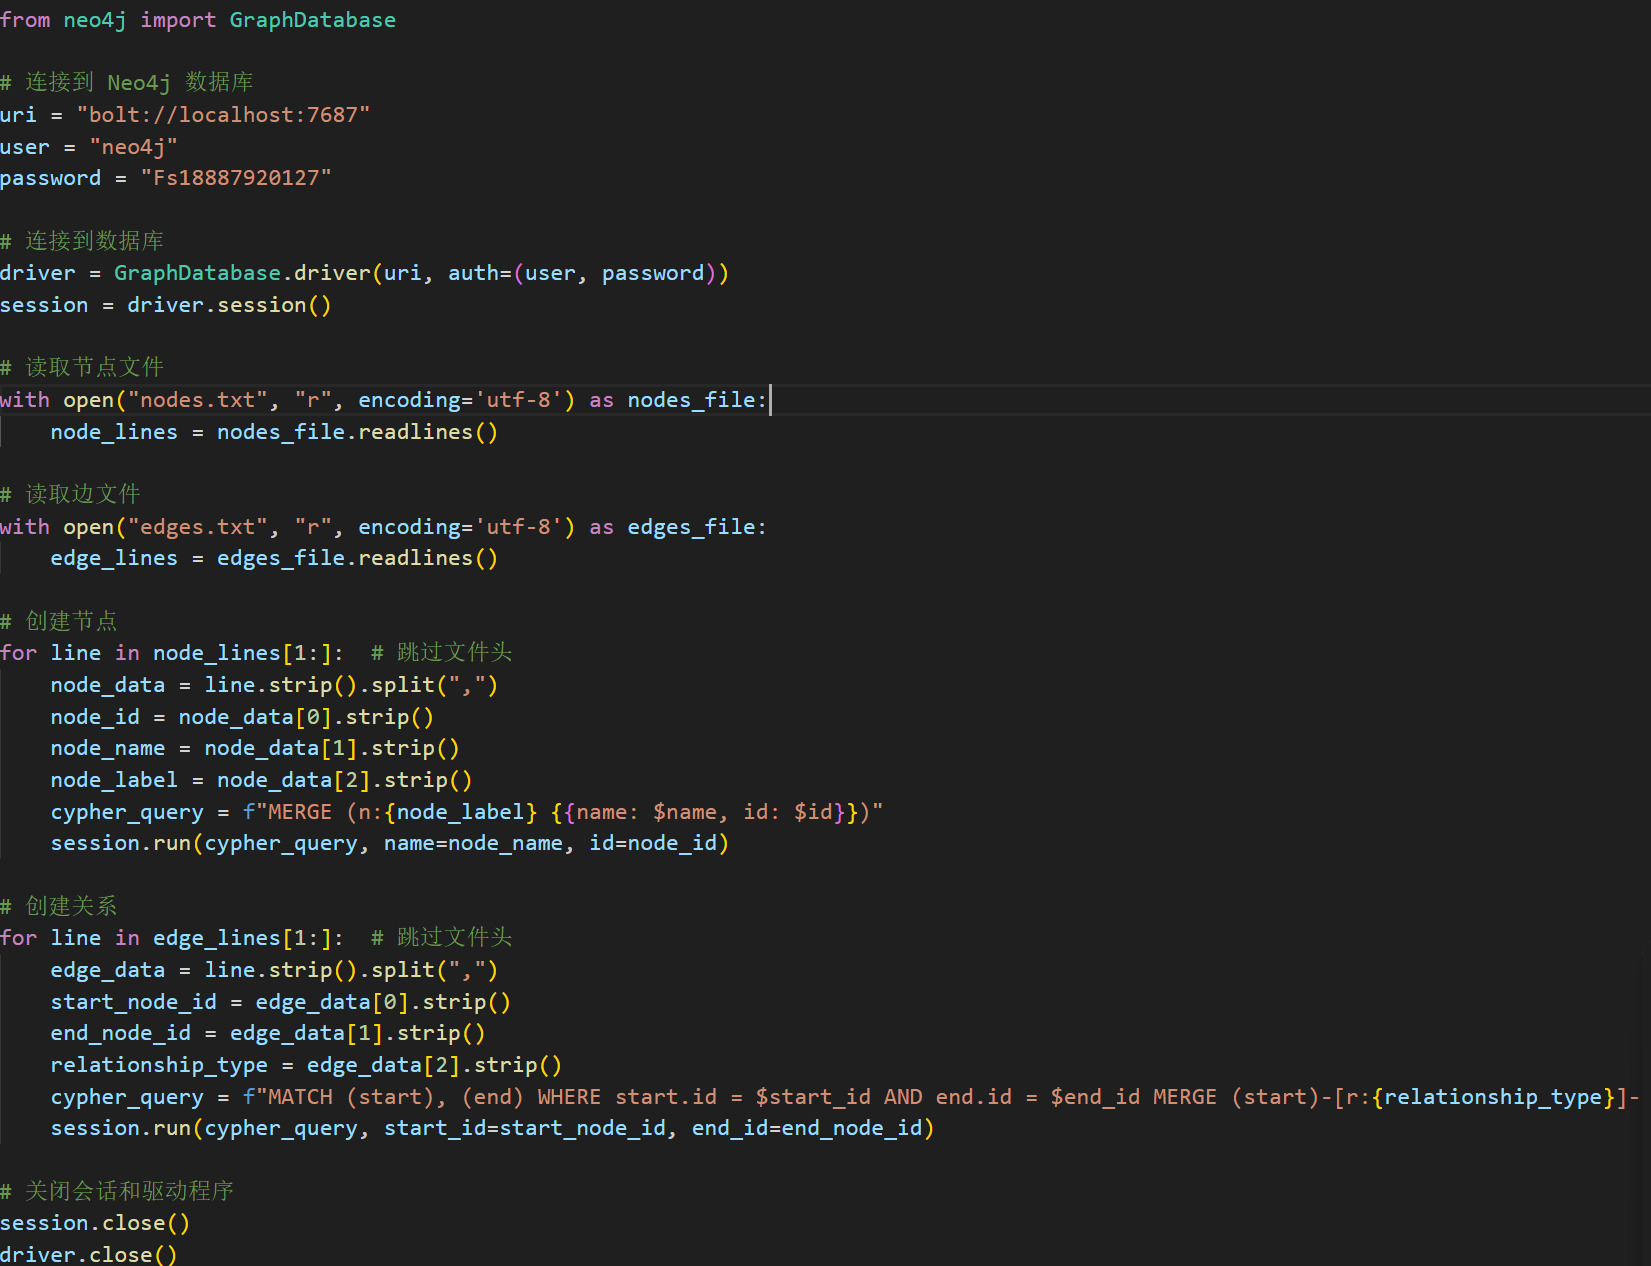
Figure 5. Code Example for the detailed process of importing data into the database
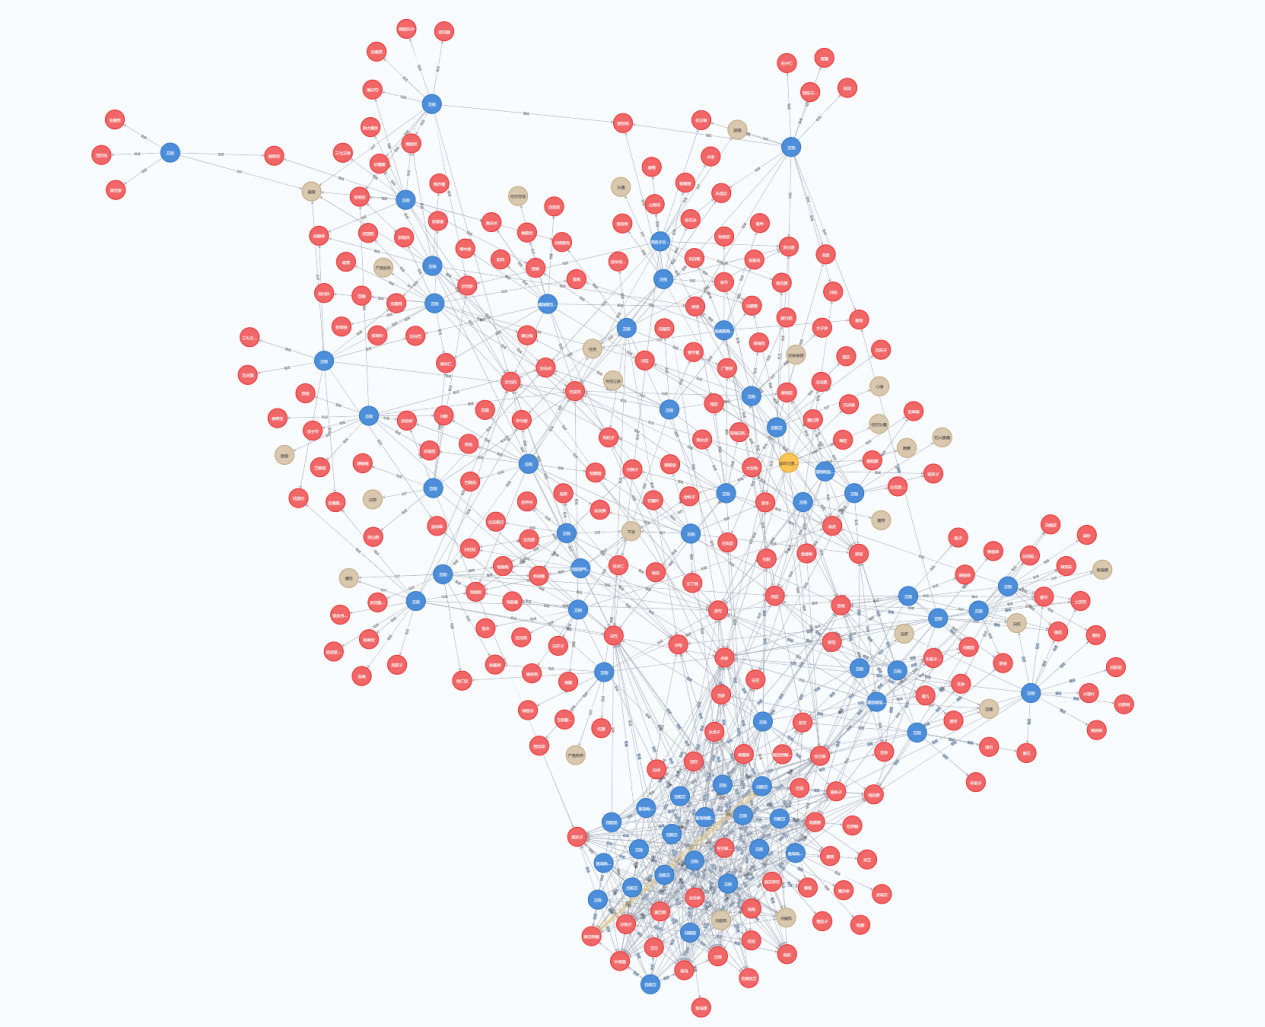
Figure 6. Visual representation of the imported graph
3.4 Application
After the construction of the knowledge graph, it can be used for various queries, as shown below:
“蔡小荪宁心健脾,舒肝缓急法治疗脏躁” (Cai Xiaosun soothes the heart, strengthens the spleen, soothes the liver, and relieves urgency to treat visceral restlessness): {
“Medical Record Title”: “Cai Xiaosun soothes the heart, strengthens the spleen, soothes the liver, and relieves urgency to treat visceral restlessness”
“Doctor’s Name”: “Cai Xiaosun”
“Department”: “Gynecology”
“Medical Record”: {
“Patient’s Name”: “Yu, Female, 1928-01-01”,
“Visit Time”: “1977-11-07”,
“Solar Term”: “Start of Winter”,
“Chief Complaint”: “Excessive menstruation accompanied by restlessness and crying tendency at night for nearly two years.”,
“Present Illness”: “Excessive menstruation, occasional headache, restless sleep at night, poor appetite, palpitations, restlessness with tendency to cry, chest stuffiness, fatigue.”,
“Tongue Coating”: “Red tongue”,
“Pulse Condition”: “Weak pulse”,
“Past Medical History”: “Excessive menstruation, each menstruation as heavy as a flood, previous treatment with danazol not yet cured.”,
“Personal History”: “None”,
“Allergy History”: “None”,
“Obstetric History”: “One child”,
“Family History”: “None”,
“Syndrome Differentiation Analysis”: “The syndrome belongs to disharmony between the heart and spleen, deficiency of liver and kidney, instability of Chong and Ren meridians.”,
“Traditional Chinese Medicine Diagnosis”: “Visceral restlessness”,
“Western Medicine Diagnosis”: “None, menopausal syndrome”,
“Prescription Name”: “Si Junzi He Gan Mai Da Zao Tang plus modifications”,
“Composition”: “9g of stir-fried Codonopsis, 9g of stir-fried White Atractylodes, 12g of Yunfuling, 4.5g of Zhuyuanzhi, 15g of Yejiaoteng, 4.5g of Bupleurum, 9g of white peony root, 9g of tribulus terrestris, 30g of Huai wheat sprout, 3g of prepared licorice, 15g of jujube”,
“Usage”: “4 doses, one dose per day, decocted in water and taken orally.”,
“Medical Advice”: “Relax.”
}
}
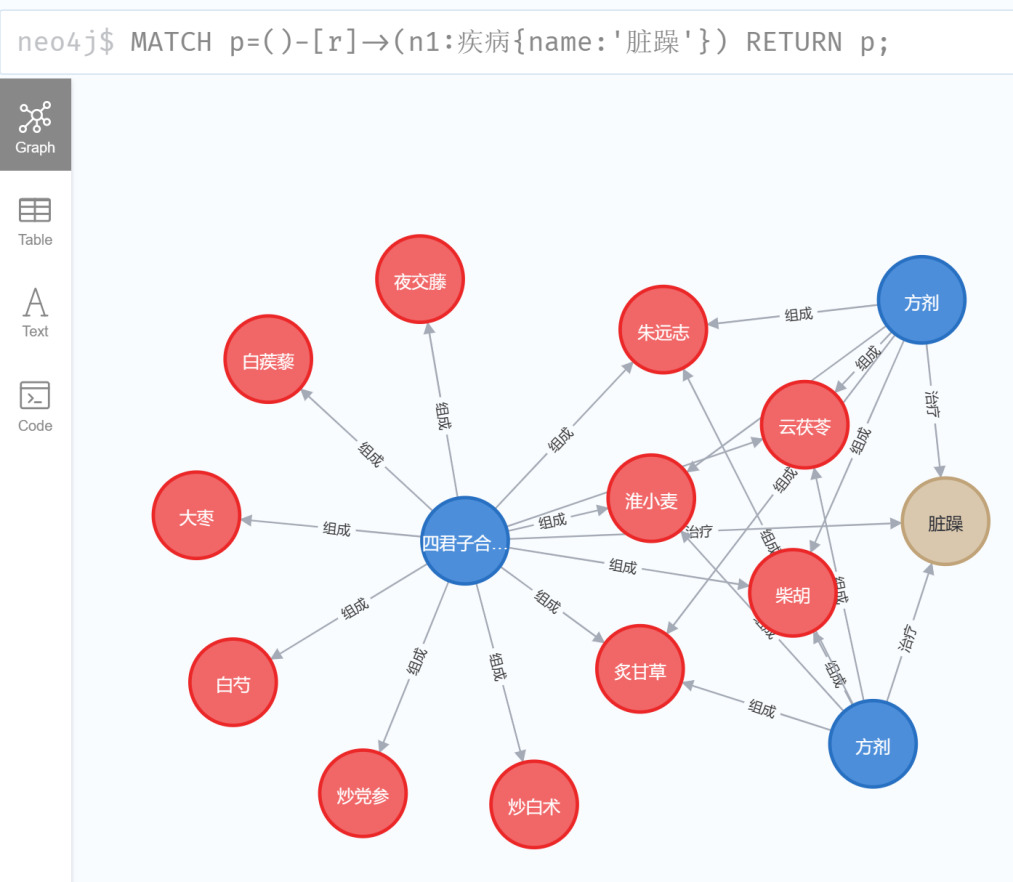
Figure 7. Querying diseases
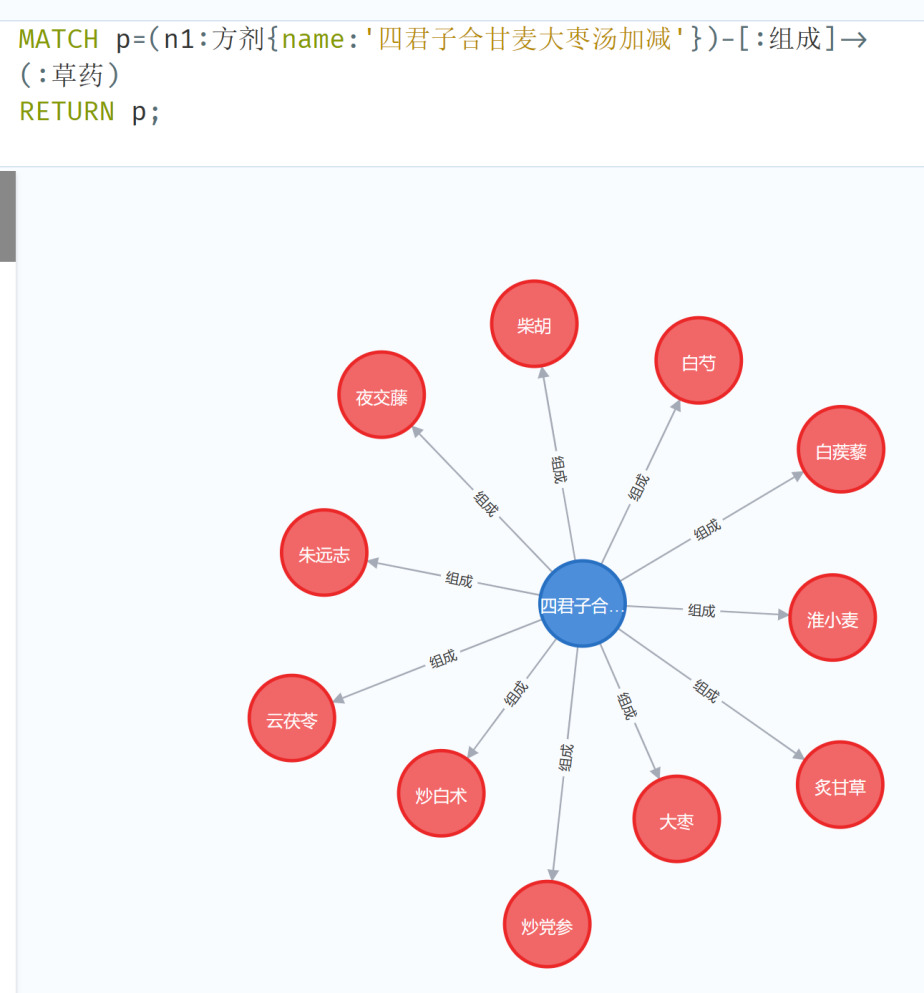
Figure 8. Querying prescriptions
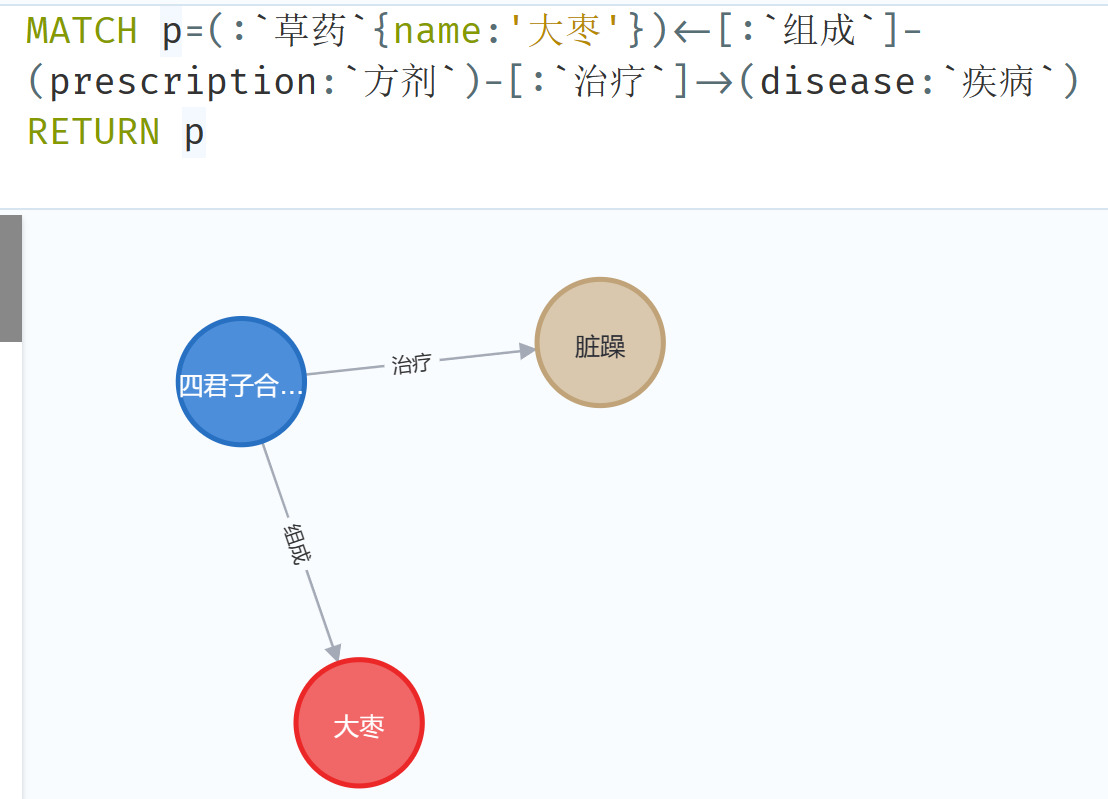
Figure 9. Querying medicinal herbs corresponding to the treatment of diseases
4. Conclusion
The core objective of this project is to utilize knowledge graph technology to construct a system applicable in the field of traditional Chinese medicine (TCM). It involves extracting relevant information from medical records, such as herbs, diseases, etc., and establishing their interrelationships. Initially, the medical records data file was read using Python and transformed into a Python dictionary for subsequent processing. Then, an entity recognition algorithm was developed to identify entities like herbs and diseases by parsing specific fields in the medical records data, such as prescription names and TCM diagnoses. Subsequently, a data storage format was designed, and Neo4j graph database was chosen as the solution for data storage. Finally, using Neo4j’s Python driver program, the extracted entities and their relationships were imported into the database, thereby building the prototype system of the TCM knowledge graph.
In this project, I not only handled medical records data and entity recognition technology but also gained an in-depth understanding of the application of knowledge graphs in the TCM field. Through processing medical records data, I learned how to use Python’s file operations and JSON parsing modules to convert raw medical records data into data structures that programs can handle, laying the foundation for subsequent entity recognition and knowledge graph construction. Regarding entity recognition, I not only extracted information about herbs and diseases from medical records but also improved the accuracy and efficiency of entity recognition by designing corresponding recognition rules and algorithms. For example, by using regular expressions and string processing techniques, I successfully extracted the names of herbs from medical records and formatted them as necessary for subsequent storage and analysis.
Furthermore, after extracting entity information, I imported this information into the Neo4j graph database for further processing and management. By connecting to the Neo4j database and using the Cypher query language, I successfully created nodes and relationships, constructing the basic framework of the TCM knowledge graph. Throughout this process, I gained an in-depth understanding of the principles and operations of graph databases, including node and relationship creation, data import, and query. This not only enriched my experience in database operations but also laid a solid foundation for further exploration of the application of knowledge graphs in the TCM field.
In summary, through this project, I not only mastered the techniques of medical records data processing and entity recognition but also gained insights into the application scenarios and methods of knowledge graphs in the TCM field. These experiences and skills are not only significant for my academic research and professional development but also lay a solid foundation for my future exploration in fields such as artificial intelligence.
The future prospects of this project are extensive. The knowledge graph construction can be further improved by adding more entity types and relationship types, such as doctors, patients, symptoms, diagnosis and treatment processes, etc., to build a completer and more comprehensive TCM knowledge graph. This will provide a more reliable and comprehensive data foundation for TCM clinical decision support systems, modernization, and intelligent construction of TCM.
Moreover, more natural language processing and machine learning technologies can be introduced to improve the accuracy and efficiency of medical records data processing and entity recognition. For example, deep learning-based entity recognition models can be adopted to identify more complex and diversified entity types in medical records, thereby improving the speed and quality of knowledge graph construction. Additionally, combining natural language understanding and reasoning techniques can achieve deeper understanding and analysis of medical records data, providing more intelligent and personalized support for TCM clinical practice and research.
Furthermore, the integration and sharing of knowledge graphs with other medical data resources can be achieved to build interdisciplinary medical knowledge networks. By integrating with Western medical databases, clinical trial data, genomics data, etc., a comprehensive medical knowledge graph integrating traditional Chinese and Western medicine can be realized, providing more comprehensive and effective support for human health and disease treatment.
In terms of personal prospects, I hope to continuously improve my technical capabilities and professional knowledge through participation in this project. By delving into cutting-edge technologies such as knowledge graphs, natural language processing, and machine learning, I aim to explore and innovate continuously. Additionally, I hope to apply the knowledge and experience gained from this project to broader fields and practices.
Through participation in this project, I aspire not only to contribute to the construction and intelligent application of knowledge graphs in the field of traditional Chinese medicine but also to achieve personal career development and growth, becoming an influential and competitive professional who contributes positively to the advancement of societal science and technology and human well-being.
References
[1]. Liu, J., Li, Y., Duan, H., et al. (2016). A review of knowledge graph construction techniques. Journal of Computer Research and Development, 53(3), 582-600.
[2]. Xu, Z., Sheng, Y., He, L., et al. (2016). A review of knowledge graph technology. Journal of University of Electronic Science and Technology of China, 45(4), 589-606.
[3]. Jia, L., Liu, J., Yu, T., et al. (2015). Construction of traditional Chinese medicine knowledge graph. Journal of Medical Informatics, 36(8), 51-53+59.
[4]. Ruan, T., Sun, C., Wang, H., et al. (2016). Construction and application of traditional Chinese medicine knowledge graph. Journal of Medical Informatics, 37(4), 8-13.
Cite this article
Hou,R. (2024). Application of big data technology in the medical field. Advances in Engineering Innovation,8,70-80.
Data availability
The datasets used and/or analyzed during the current study will be available from the authors upon reasonable request.
Disclaimer/Publisher's Note
The statements, opinions and data contained in all publications are solely those of the individual author(s) and contributor(s) and not of EWA Publishing and/or the editor(s). EWA Publishing and/or the editor(s) disclaim responsibility for any injury to people or property resulting from any ideas, methods, instructions or products referred to in the content.
About volume
Journal:Advances in Engineering Innovation
© 2024 by the author(s). Licensee EWA Publishing, Oxford, UK. This article is an open access article distributed under the terms and
conditions of the Creative Commons Attribution (CC BY) license. Authors who
publish this series agree to the following terms:
1. Authors retain copyright and grant the series right of first publication with the work simultaneously licensed under a Creative Commons
Attribution License that allows others to share the work with an acknowledgment of the work's authorship and initial publication in this
series.
2. Authors are able to enter into separate, additional contractual arrangements for the non-exclusive distribution of the series's published
version of the work (e.g., post it to an institutional repository or publish it in a book), with an acknowledgment of its initial
publication in this series.
3. Authors are permitted and encouraged to post their work online (e.g., in institutional repositories or on their website) prior to and
during the submission process, as it can lead to productive exchanges, as well as earlier and greater citation of published work (See
Open access policy for details).
References
[1]. Liu, J., Li, Y., Duan, H., et al. (2016). A review of knowledge graph construction techniques. Journal of Computer Research and Development, 53(3), 582-600.
[2]. Xu, Z., Sheng, Y., He, L., et al. (2016). A review of knowledge graph technology. Journal of University of Electronic Science and Technology of China, 45(4), 589-606.
[3]. Jia, L., Liu, J., Yu, T., et al. (2015). Construction of traditional Chinese medicine knowledge graph. Journal of Medical Informatics, 36(8), 51-53+59.
[4]. Ruan, T., Sun, C., Wang, H., et al. (2016). Construction and application of traditional Chinese medicine knowledge graph. Journal of Medical Informatics, 37(4), 8-13.