


1. Introduction
As one of the core tasks in computer vision, object localization and detection aims to accurately locate and classify multiple target objects in images or videos. Current object detection methods can be broadly categorized into traditional approaches and deep learning-based methods [1]. While traditional methods perform well on small datasets, they heavily rely on manual feature engineering and struggle with complex backgrounds, multi-object scenarios, and illumination variations. Additionally, their high computational complexity and poor real-time performance significantly limit practical applications.
The essence of deep learning-based approaches lies in utilizing Convolutional Neural Networks (CNNs) [2] to autonomously extract and learn target features. According to their operational principles, existing methods can be divided into two-stage detectors and one-stage detectors. Although two-stage methods demonstrate superior detection accuracy (e.g., Faster-RCNN [3], DETR [4]), their computational workflow involves dual computation-intensive operations: region proposal generation and subsequent refinement processing. This results in significantly higher parameter counts and inference latency compared to single-stage methods. Such high computational complexity makes two-stage approaches more suitable for non-real-time applications requiring stringent localization accuracy, such as medical image analysis and satellite image interpretation.
In contrast, one-stage methods have gradually become the mainstream choice for industrial applications due to their end-to-end optimization characteristics and computational efficiency (e.g., SSD [5], YOLO series [6]). These approaches achieve an effective balance between detection accuracy and processing speed through unified feature extraction and prediction mechanisms, making them particularly suitable for real-time scenarios with hardware resource constraints. The milestone of Object Detection is shown in Figure 1.
Assembly refers to the process of fitting and connecting components or parts to form finished or semi-finished products. With surging production demands, manufacturing industries are witnessing increasing assembly requirements. Research indicates that assembly costs account for over 50% of the entire production process, while assembly cycle time significantly impacts production efficiency. As manufacturing evolves towards intelligence and flexibility, traditional assembly methods face substantial challenges. Shaft-hole component assembly, as one of the most classical tasks, holds significant research value, particularly in production lines requiring high precision, complex detection images, varying perspectives, and inconsistent illumination. Addressing critical issues like improving assembly accuracy while reducing costs and cycle time has become imperative.
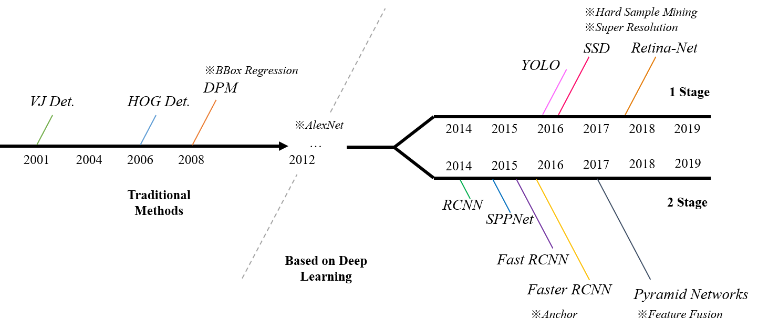
Figure 1. Object detection milestone
To address these challenges, this paper presents a case study of shaft-hole component assembly in high-end production lines, developing an improved YOLOv11-based detection algorithm for real-time acquisition of shaft and hole positional information. The main contributions are threefold: (1) Optimization of the backbone network through the RepViT-based Stage module, enhancing feature extraction capability via reconstructed feature pyramids; (2) Enhanced detection head design using P-EfficientHead, achieving structured feature preprocessing and task decoupling through partial convolution and depth-wise convolution, thereby improving sensitivity to complex targets; (3) Proposal of an Edge Information Fusion (EIF) module that effectively propagates edge features extracted from shallow layers throughout the network architecture, integrating them with multi-scale features.
Experimental validation on the Pascal VOC dataset demonstrates 3.7% and 4.0% improvements in mAP50 and mAP50-95 respectively, along with 2.9% and 2.5% increases in precision and recall rates. Additional verification on a custom dataset confirms the effectiveness of the proposed method. The results conclusively show that our multi-module enhanced YOLOv11 network achieves superior performance in complex industrial assembly scenarios.
2. Related work
2.1. YOLO network
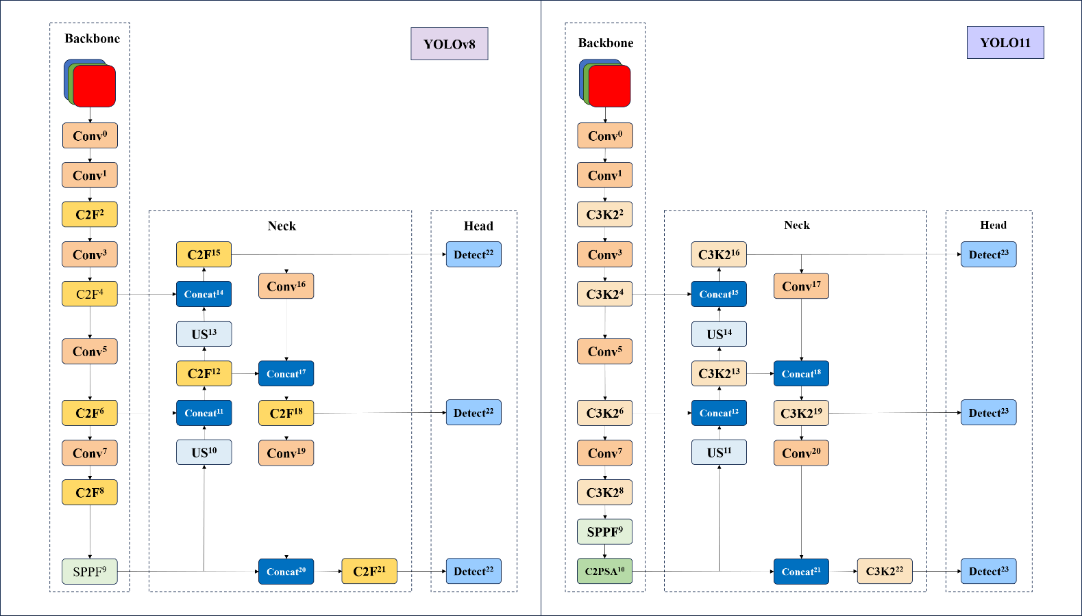
Figure 2. YOLOv8 and YOLO11 architecture
From the initial perceptions to Convolutional Neural Networks (CNNs) and the Transformer [7] architecture, deep learning has brought revolutionary advancements to computer vision. This section begins with fundamental theories of the YOLO series. YOLOv11, introduced by the Ultralytics team, represents an upgraded version based on the YOLOv5 and YOLOv8 architectures. As illustrated in Figure 2, YOLOv11 replaces the CF2 module with C3K2, integrates a C2PSA module after the SPPF layer, and incorporates the Head design philosophy from YOLOv10. These modifications employ depth-wise separable operations to minimize redundant computations and enhance operational efficiency.
The YOLO architecture comprises three principal components: the backbone network, neck network, and detection head. The backbone network extracts hierarchical features from input images through progressive abstraction. The neck network facilitates multi-dimensional feature fusion across different semantic levels. The detection head implements a multi-scale prediction strategy, synthesizing feature maps from both backbone and neck networks to generate bounding box coordinates and class predictions.
2.2. Task-specific algorithmic improvements
Xiong [8] et al. proposed QMDF-YOLO11, a rice pest detection algorithm for complex scenarios, addressing challenges faced by traditional YOLOv11 models in insufficient small-target recognition and suboptimal multi-scale feature fusion. By introducing a novel feature fusion backbone network QS-RepGFPN, incorporating Modulated Deformable Convolution (MDConv), and replacing traditional upsampling with Dynamic Upsampling (DySample), the network significantly improved performance—particularly in complex backgrounds and dense small-target scenarios—as detailed in their work.
Wang [9] et al. developed YOLO-MEG, a solar cell micro-defect detection algorithm based on YOLO11. Through a Multi-Channel Attention Mechanism (MCAM) to enhance defect feature extraction in the backbone network, integration of lightweight GhostNet convolution, and adoption of the MPDIoU loss function tailored for small-target prediction in the detection head, the method effectively increased average detection precision.
Xia [10] et al. improved YOLO11 to address challenges in complex traffic images such as small target sizes, indistinct features, and interference susceptibility. Their ETF-YOLO11n (Effective Traffic Feature YOLO) model includes a Triple Feature Fusion (TFF) module to integrate multi-scale features from the backbone; a Hybrid Dilated Convolution Feature Enhancement (HDCFE) module in the neck network to aggregate features from varied receptive fields and mitigate occlusion interference; and a proposed Geometrically Improved Complete IoU (GeoCIoU) loss function replacing CIoU, which employs dual penalty terms to better quantify detection box-ground truth alignment. These innovations demonstrated superior performance on the KITTI traffic dataset.
3. Method
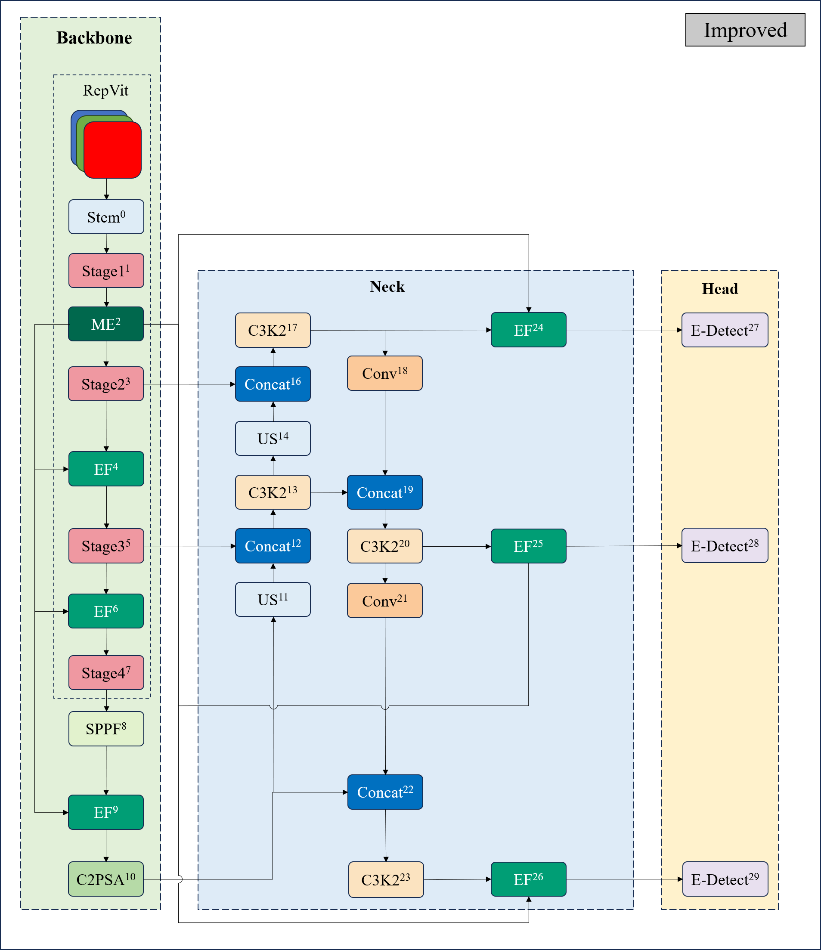
Figure 3. Improved YOLOv11 network architecture with multi-module fusion optimization
The optimized network architecture is shown in Figure 3, consisting of three parts: the optimized backbone network on the left, the multi-scale feature fusion module in the neck feature pyramid, and the improved detection head module. Specifically, the backbone network of YOLOv11 is reconstructed based on the RepViT module, achieving model lightweight through re-parameterization techniques while enhancing backbone performance. In the neck structure, an edge-aware feature fusion mechanism is adopted. This module improves the accuracy of capturing target edge information in complex backgrounds by enhancing the geometric detail representation capability of shallow feature maps. Its core lies in establishing cross-layer feature interaction channels to strengthen response intensity in edge-sensitive regions. The detection head employs the EfficientHead architecture, which combines depth-wise separable convolutions with a dynamic attention mechanism. This approach reduces parameter volume while optimizing the collaborative learning process of classification and localization tasks through multi-branch feature calibration strategies, ultimately achieving synchronized improvements in detection accuracy.
3.1. Backbone network optimization based on RepViT
RepViT (Revisiting Mobile CNN From ViT Perspective) is a lightweight convolutional neural network specifically designed for machine vision tasks, inspired by RepVGG [11]. It aims to enhance model performance while maintaining lightweight characteristics through architectural optimization. By integrating efficient design elements from Vision Transformers (ViT), this network improves upon the traditional lightweight CNN MobileNetV3, forming a novel pure convolutional architecture.
As shown in Figure 4, the RepViT architecture employs a four-stage hierarchical design, with processing unfolding along decreasing spatial resolutions. The input is a 2D image of size H×W. After preprocessing through the Stem module, the features sequentially pass through four extraction stages (Stage1 - 4). The feature map resolutions at each stage are 1/4 (𝐻/4×𝑊/4), 1/8 (𝐻/8×𝑊/8), 1/16(𝐻/16×𝑊/16), 1/32(𝐻/32×𝑊/32) respectively, with a uniform channel dimension Ci and constant batch dimension B.
The core Stem module performs initial feature extraction, with its output serving as input for subsequent stages. Each feature processing stage stacks multiple RepViTBlock units, with selected stages incorporating RepViTSEBlock enhancement modules. Every basic block integrates multiple components including depth-wise separable convolutions, Squeeze-and-Excitation (SE) modules, and feed-forward networks, achieving feature reuse through residual connections. Spatial downsampling operations between stages compress feature map dimensions while expanding channel dimensions to preserve information capacity.
The network concludes with a global average pooling layer to compress spatial dimensions, followed by a fully connected layer for classification vector mapping and category prediction. This pyramidal structure design progressively abstracts high-level semantic information while effectively balancing computational efficiency and feature representation through gradual resolution reduction.
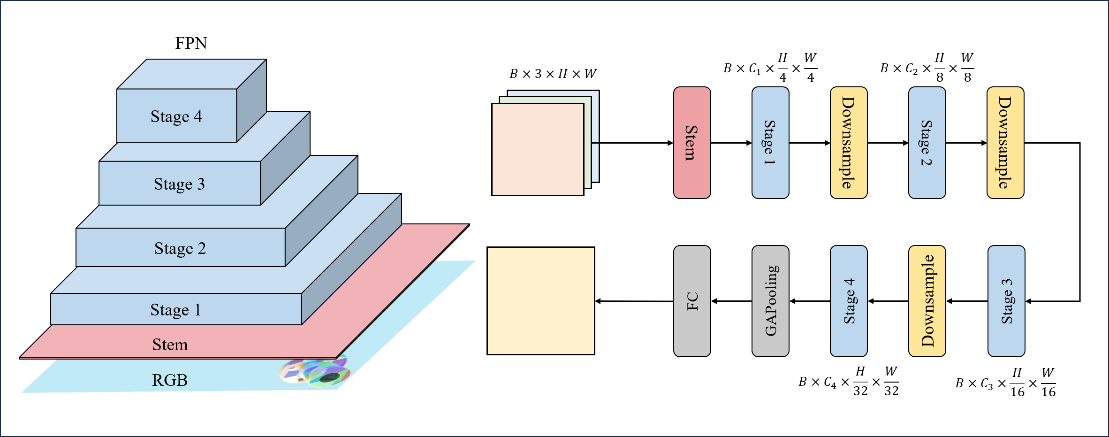
Figure 4. RepViT backbone network architecture
3.2. Edge information fusion module
In object detection tasks, edge information plays a critical role in bounding box localization. Higher alignment between predicted boxes and object edges directly improves localization accuracy. However, existing YOLO-series detection networks lack dedicated modules to enhance edge information awareness. To address this limitation, this chapter proposes an Edge Information Fusion (EIF) module that propagates edge features extracted from shallow layers throughout the network and integrates them with multi-scale features.
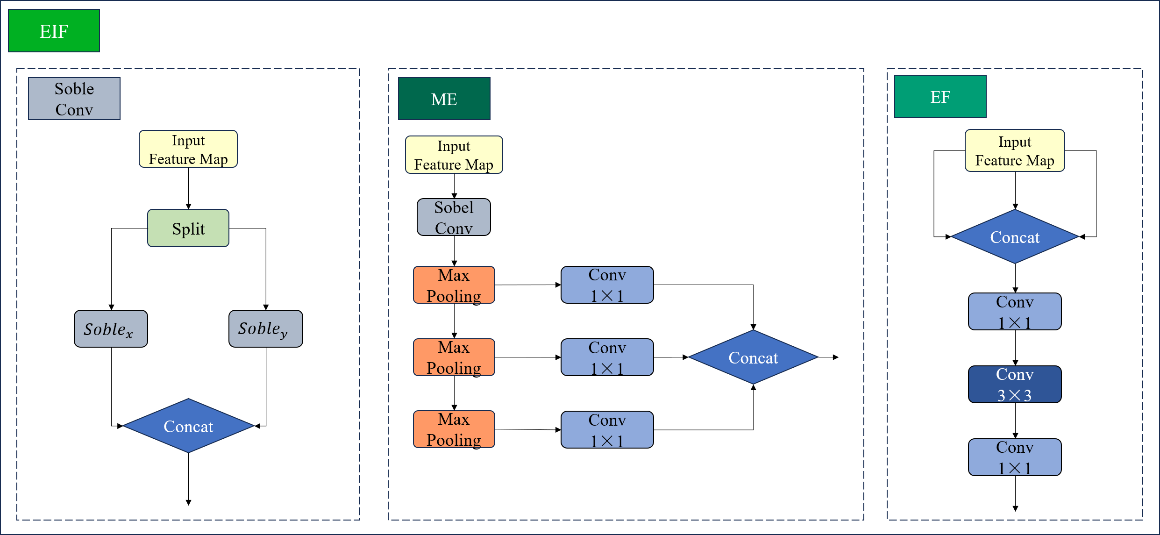
Figure 5. EIF module architecture
As shown in Figure 5, the EIF module contains the Sobel convolution module, the MultiEdge (ME) module for generating multi-scale edge information, and the Edge Fusion Convolution (EF) module.
3.2.1. Sobel convolution
The Sobel Convolution Module [12] implements edge feature processing based on the classical Sobel operator. This module performs spatial convolution on input feature maps through discrete first-order difference operations. Specifically, horizontal and vertical (x, y) convolution kernels are employed to compute approximate brightness gradients along the horizontal and vertical directions of the feature maps. The dual-channel gradient information is then linearly fused via weighted summation, achieving collaborative enhancement and optimized extraction of multi-directional edge features. The mathematical foundation stems from the first-order derivative characteristics of the Sobel operator. Its kernel weight allocation mechanism effectively suppresses noise interference while reinforcing edge continuity through gradient superposition, significantly improving the structured representation of directional edges in feature maps.
3.2.2. Multi-scale edge generation module
The Multi-scale Edge Generation Module (ME) employs a hierarchical feature decoupling strategy to construct multi-level edge representation structures. Specifically, the module first performs primary edge feature extraction using Sobel convolution kernels. It then builds a parallel multi-stage downsampling structure, utilizing max-pooling operators with both stride and kernel size set to 2 for three-stage downsampling operations. Each downsampled output undergoes channel dimension recalibration through depth-wise separable convolutions, ultimately generating a spatial feature pyramid with three distinct scales.
Regarding the selection of feature downsampling methods, max-pooling and average-pooling constitute two typical spatial domain feature aggregation mechanisms. The former achieves feature selection through maximum value mapping within local receptive fields. Its extremum-response-based feature selection mechanism offers the following advantages: enhancing feature saliency by suppressing secondary strong activation values; improving robustness against Gaussian noise and minor perturbations through threshold filtering principles; and effectively maintaining response intensity in gradient mutation regions for edge detection tasks. The latter employs arithmetic averaging to achieve feature smoothing, with its advantages reflected in maintaining global consistency of feature distributions through regional statistics and reducing interference from high-frequency components on feature representation. According to information bottleneck theory, max-pooling exhibits superior progressive feature compression characteristics in edge feature retention. Its capability to preserve gradient features during spatial resolution reduction enables strong performance in edge-enhanced downsampling tasks.
3.2.3. Edge fusion convolution
Based on cross-channel interaction and feature recombination theory, this study innovatively constructs the Edge Fusion Convolution module (EF), which achieves collaborative optimization of edge features and conventional convolutional features through a bilinear fusion strategy. Specifically, the EF module adopts a three-stage feature processing pipeline:
First, 1×1 convolutions establish a cross-channel projection space to concatenate edge feature maps (from the ME module) and conventional convolutional feature maps along the channel dimension. Adaptive weighted fusion of heterogeneous features is realized through a parametric attention mechanism.
Second, depth-wise separable 3×3 convolutions are introduced to expand local receptive fields. The dilated convolution kernel configuration effectively enhances correlations among spatially adjacent features.
Finally, 1×1 convolution kernels perform nonlinear feature transformation, compressing channel dimensions and refining feature representations.
3.3. P-EfficientHead
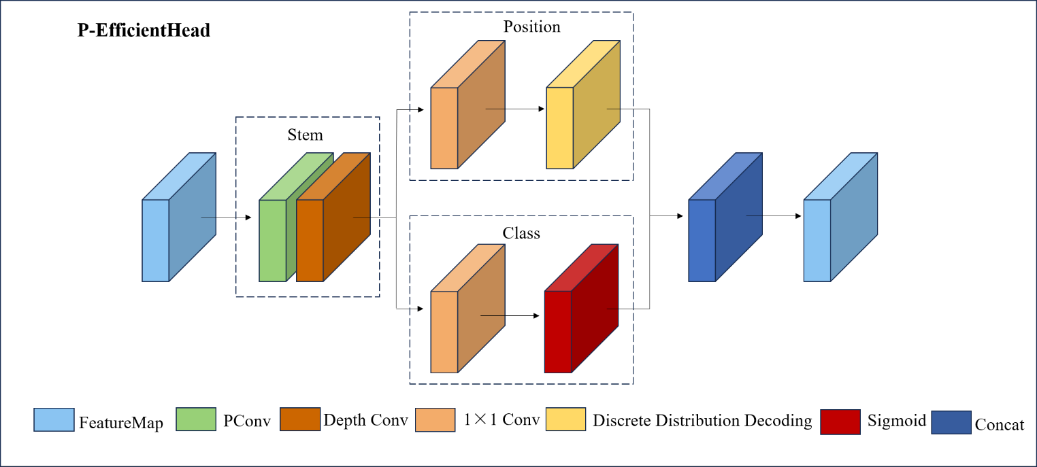
Figure 6. P-EfficientHead module architecture
Partial Convolution (PConv) was first proposed by Chen et al. in their paper [13]. Its design is based on observations of feature maps from a pre-trained ResNet-50 model: significant similarity exists among different channels in feature maps. To address this multi-channel redundancy, PConv optimizes computational efficiency by selectively processing continuous channels. The operations of the two methods are illustrated in Figure 7. In traditional convolution, all channels of the input feature map undergo convolution, whereas in partial convolution, the operational region cp of the convolution kernel is dynamically adjusted based on the validity of the input feature map data. Specifically, convolution is performed only on a subset of channels cp, while the feature information from the remaining channels is output through a 1×1 depth-wise convolution. This approach effectively reduces computational load without significantly compromising accuracy. The parameter computation costs of standard convolution and partial convolution can be expressed by Equation (1).
\( \begin{cases} \begin{array}{c} FLOPs=h×w×{k^{2}}×{c^{2}} \\ FLOPs=h×w×{k^{2}}×{{c_{p}}^{2}} \end{array} \end{cases}\ \ \ (1) \)
where h and w are the height and width of the feature map, k is the size of the convolution kernel, c is the number of channels in the convolution kernel, and cp is the number of channels involved in partial convolution computation. The ratio of parameter variation Δ is given by:
\( ∆={(\frac{{c_{p}}}{c})^{2}}\ \ \ (2) \)
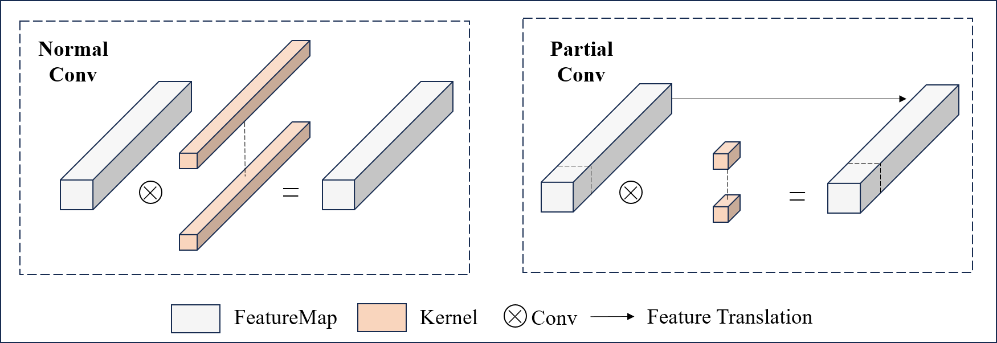
Figure 7. Normal Conv and Partial Conv
The design of the P-EfficientHead module focuses on efficient feature decoding for object detection tasks, achieving performance optimization through structured feature preprocessing and task decoupling. As shown in Figure 6, its core workflow begins with the Stem module: this module first employs local convolution to extract spatial context from input feature maps, preserving local details while avoiding the redundancy of global attention computation. Subsequently, it uses 1×1 convolution to compress channel dimensions, reducing computational load while enabling cross-channel information reorganization. This process can be enhanced by integrating multi-branch structures during training and re-parameterization fusion techniques during inference to further improve feature representation efficiency. The preprocessed feature maps are then divided into two independent paths: the position prediction branch employs lightweight convolutional layers to generate discrete probability distributions for bounding boxes, which are converted into continuous coordinate values through integral operations—this probabilistic strategy enhances robustness against positional ambiguity in targets; the category prediction branch outputs multi-label probabilities through convolution and Sigmoid activation, utilizing channel attention mechanisms to strengthen the weights of critical semantic channels, thereby maintaining classification accuracy in complex scenes. The final outputs from both paths are fused through a Concat concatenation operation, integrating positional and categorical information to form the complete representation required for object detection, which is then fed into downstream networks for multi-stage iterative optimization. The entire module maintains sensitivity to small and overlapping targets while reducing computational complexity through local constraints, distribution decoding, and dynamic weight allocation.
4. Experiment
4.1. Description of the experiment
4.1.1. Dataset
The PASCAL VOC dataset provides a reliable basis for algorithm performance comparison through its standardized evaluation system (containing 20 fine-grained object categories covering the four semantic categories of vehicles, household items, animals, and human beings) [14], which contains a total of 5,200 target images in 4 major categories and 20 subcategories, and Table 1 demonstrates the names of all the categories as well as the major categories they belong to.
Table 1. VOC dataset categories
Transportation | Household Items | Animals | Others |
Aircraft | Bottle | Brid | Human |
Bicycle | Chair | Cat | / |
Boat | Dining Table | Cow | / |
Bus | Potted Plant | Dog | / |
Car | Sofa | Horse | / |
Motorcycle | TV/Monitor | Sheep | / |
Train | / | / | / |
The 5,200 images in the dataset are divided into training and validation sets at a 9:1 ratio. Each image includes category and bounding box annotation information. Unlike YOLO's TXT format datasets, PASCAL VOC dataset uses XML format files to describe target objects in images, specifying category information and BBOX coordinates. Compared to the COCO dataset with hundreds of thousands of images, this dataset has a more balanced number of images containing twenty categories of objects of various sizes, which meets the research requirements while being a more optimal choice given limited hardware resources.
4.1.2. Evaluation metrics
This paper evaluates model performance using classic object detection metrics including Precision (P), Recall (R), Average Precision (AP), mAP, mAP50-95, and Floating Point Operations (FLOPs), defined by equations (3)-(7):
Precision represents the proportion of correctly predicted positives among all predicted positives, expressed as:
\( P=\frac{TP}{TP+FP}\ \ \ (3) \)
Recall represents the proportion of correctly predicted positives among all actual positives, expressed as:
\( R=\frac{TP}{TP+FN}\ \ \ (4) \)
Where TP (True Positive), FP (False Positive), and FN (False Negative) represent the number of correctly predicted positive samples, incorrectly predicted negative samples, and incorrectly predicted positive samples, respectively.
Average Precision (AP), as one of the core metrics for evaluating algorithm performance in object detection tasks, is essentially a mathematical representation of the area under the precision-recall curve. Specifically, AP calculation requires non-linear processing of discrete recall points through interpolation: first, discrete sampling points are defined at fixed steps on the recall axis, then the maximum precision value within each sampling interval is selected as the interpolation benchmark, and finally the overall AP value is obtained by accumulating the area contributed by each interval through piecewise weighted summation:
\( AP=\int _{0}^{1}p(r)dr\ \ \ (5) \)
Where p(r) is the precision-recall curve and r is the recall rate.
mAP is the Mean Average Precision across all categories. Specifically, object detection tasks may involve objects of multiple categories. First, AP is calculated for each category, and then the average AP value for all categories is taken:
\( mAP=\frac{1}{c}\sum _{i=1}^{C}A{P_{i}}\ \ \ (6) \)
Where C is the total number of categories, and APi is the average precision of the i-th category. Under different IOU threshold conditions, mAP will have different forms. Generally, mAP50 and mAP50-95 are the most common metrics in object detection. A detailed comparison of these two parameters is shown in the Table 2.
\( FLOPs=2HW({C_{in}}{k^{2}}+1){C_{out}}\ \ \ (7) \)
Where H and W represent the height and width of the input image, Cin and Cout are the input and output channel numbers.
Table 2. Comparison between mAP50 and mAP50-95
Metric | IoU Threshold | Characteristics |
mAP50 | 0.5 | Quick model evaluation, emphasizes recall |
mAP50-95 | [0.5:0.95] Step = 0.05 | More stringent model evaluation, emphasizes precision and stability |
4.1.3. Experimental setup
Experimental Setup are shown in Table 3 and 4.
Table 3. Experimental environment configuration
Hardware | CPU | Intel(R) Xeon(R) Silver 4210R 2.40GHz | Software | Operating System | Windows10 |
GPU | NVIDIA RTX A4000 | Python | 3.10.5 | ||
RAM | 32G | Pytorch | 2.2.2 | ||
VRAM | 16G | CUDA | 12.6 |
Table 4. Network training hyperparameters
Parameter | Value | Parameter | Value |
Image Resolution | 640×640 | Batch Size | 16 |
Epochs | 300 | Momentum | 0.937 |
Optimizer | SGD | Mosaic Data Augmentation | 10 |
Queue | 4 | Learning Rate | 0.01 |
Learning Rate | 0.01 |
4.2. Comparative experiments
To compare the performance of the Improved model proposed in this study with mainstream object detection models, comparative experiments were conducted under the same hardware, software environment, training parameters, and dataset. YOLOV5, YOLOV8n, YOLOV10n, YOLO11n, and our model were selected for training and validation. Table 5 shows the comparison results.
Table 5. Comparative experiments with mainstream object detection models
Model | mAP50(%) | mAP50-95(%) | GFLOPS |
YOLOV5 | 66.17 | 47.32 | 4.5 |
YOLOV8n | 67.09 | 49.59 | 8.9 |
YOLOV10n | 66.90 | 50.46 | 8.4 |
YOLO11n | 67.79 | 50.82 | 6.7 |
Improved | 70.9 | 54.2 | 6.8 |
The Precision-Recall (PR) curves from five comparative experiments conducted on the PASCAL VOC dataset are shown in Figure 8. The area enclosed by these curves and the coordinate axes correlates positively with AP and mAP. Specifically, the area under the PR curve represents the model's ability to recognize positive samples across multiple classification thresholds. When the PR curve exhibits a more pronounced convex shape toward the upper right, its integral area (AP value) increases significantly. For multi-class object detection tasks, mAP, as the arithmetic mean of AP values across categories, further reflects the model's generalization capability across classes. Therefore, as the area enclosed by PR curves increases, the simultaneous improvement in AP and mAP directly validates the model's performance optimization in object detection tasks. Figure 8 shows the P-R curves and mAP for YOLOv5, YOLOv8n, YOLOv10n, YOLOv11n (Baseline), and the Improved model on the PASCAL VOC dataset for each category.
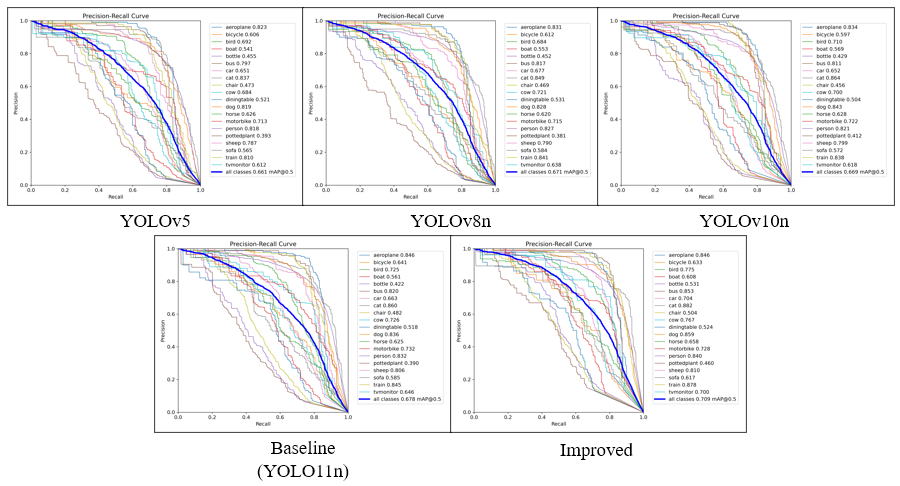
Figure 8. PR curves of YOLOv5, YOLOv8n, YOLOv10n, Baseline, and Improved models
The experimental results show that compared to other models, the PR curve of the Improved model is distinctly positioned in the upper right, meaning it encloses a larger area with the coordinate axes. Although the PR curve for certain individual object classes may not be optimal, overall, the Improved model demonstrates the best comprehensive performance.
Furthermore, this paper verifies the accuracy and convergence of the Improved model by comparing the loss and performance metrics of the Baseline model (YOLO11n) and the Improved model on the same dataset for object detection tasks. The parameter curves for precision, recall, mAP50, and mAP50-95 are shown in Figure 9 to 10.
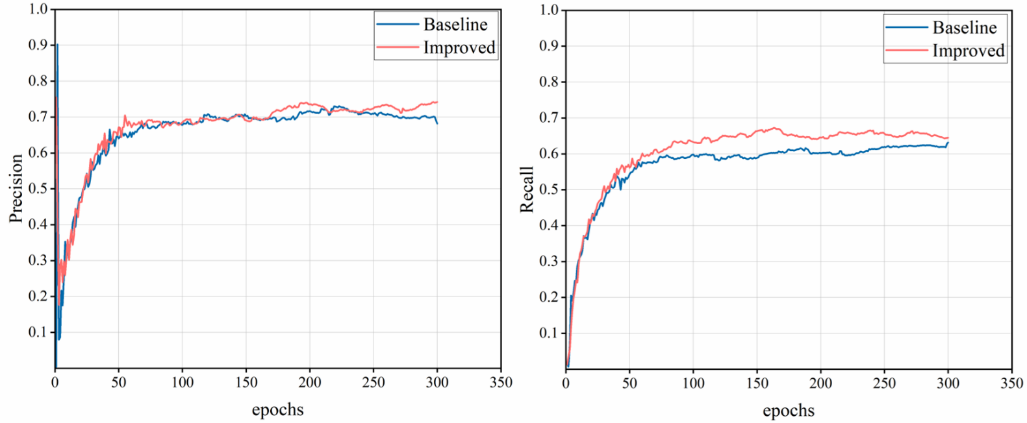
Figure 9. Recall parameter curves of Baseline and Improved models
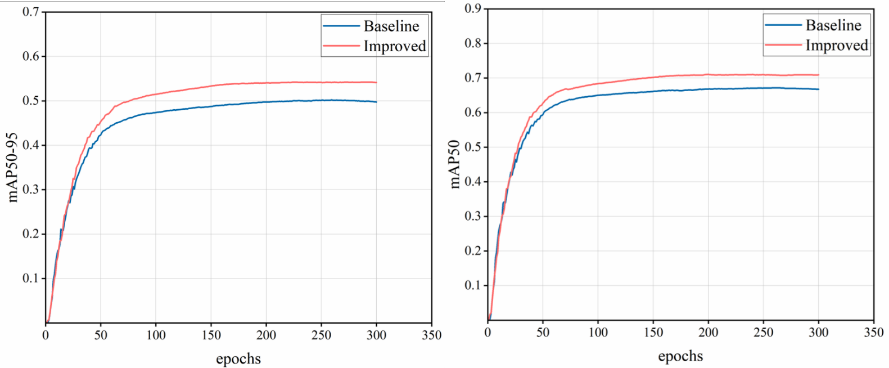
Figure 10. mAP50 and mAP50-95 parameter curves of Baseline and Improved models
Figures 9 to 10 illustrate the convergence of four performance metrics: precision, recall, mAP50, and mAP50-95. Figure 9 left shows that the precision curve trend of the Improved model is basically consistent with the Baseline model; although the oscillation amplitude is slightly larger, the final precision result surpasses the Baseline model. Figure 9 right indicates that the Improved model has a higher recall rate. From Figure 10, it is evident that the Improved model converges faster than the Baseline model and achieves significantly higher final metrics. This demonstrates that the Improved model proposed in this study maintains good detection performance under both lenient conditions and higher intersection-over-union thresholds, with reduced false positives and false negatives, reflecting the model's robustness and precision.
4.3. Ablation experiments
This research evaluates the performance of the three optimization strategies proposed in this chapter through ablation experiments on the PASCAL VOC dataset. The specific results are shown in Table 6.
Table 6. Ablation experiment results
Method Module | Precision P(%) | Recall R(%) | mAP50(%) | mAP50-95(%) | |||
Baseline | RepViT | EIF | E-Head | ||||
√ | 70.8 | 62.1 | 67.2 | 50.2 | |||
√ | √ | 72.6 | 62.9 | 68.4 | 51.6 | ||
√ | √ | 73.9 | 63.1 | 69.1 | 52.9 | ||
√ | √ | √ | 74.2 | 63.5 | 70.6 | 53.7 | |
√ | √ | √ | √ | 73.7 | 64.6 | 70.9 | 54.2 |
The ablation experiments show that when only the network backbone is optimized to RepViT based on the Baseline model, the model's precision significantly improves. When only the EIF module is added to the Baseline model, the recall rate significantly improves, and the mAP metrics also increase accordingly. When both RepViT and EIF are simultaneously added to the Baseline model, the mAP50 metric shows another significant improvement, increasing from 67.2% to 68.4%. When the E-Head detection head module is integrated with the other two improvements, the mAP50 and mAP50-95 metrics reach 70.9% and 54.2%, respectively, representing increases of 3.7% and 4% compared to the Baseline model. Additionally, the precision and recall metrics reach 73.7% and 64.6%, respectively, representing increases of 2.9% and 2.5% compared to the Baseline model. These ablation experiment results indicate that the Improved model enhances both mAP50 and mAP50-95 while maintaining precision and recall, improving localization precision and classification accuracy, and reducing missed detections.

Figure 11. Shaft-hole position detection effect under occlusion interference
Figure 11 shows frames sampled in chronological order, with 16 frames sampled from each process for demonstration. The detection confidence can be seen from the labels above the bounding boxes. The algorithm can accurately identify shafts, holes, and interfering parts with a probability exceeding 90%, even when obstructed by other components.
4.4. Verification based on derived datasets
To efficiently save manual data collection time, the Blender engine data generation method was adopted to obtain a large amount of derived data. Blender scripts were written to construct 3D assembly scenes. The basic idea behind derived data generation is to simulate various conditions in actual scenarios to generate corresponding component images. A randomization approach was used to generate data, using the position and brightness of light sources and the surface texture of models as random variables, as they most easily affect images in actual scenarios [15]. Some examples of derived data images are shown in Figure 12:
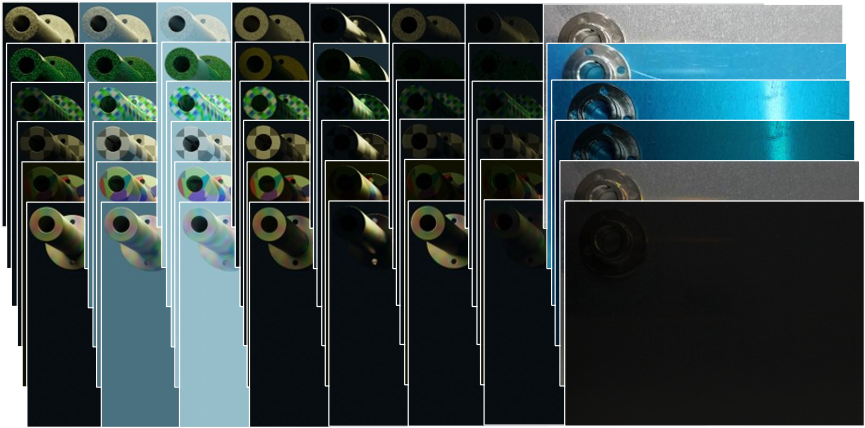
Figure 12. Examples of derived data images in different scenarios
The left seven columns show derived data with textures from top to bottom: scratched metal, green rust metal, psychedelic texture, checkerboard texture, Voronoi texture, and noise texture. From left to right, light intensity decreases with random changes in light direction. The eighth column shows actual image data captured against metal and blue backgrounds, with random variations in light intensity and direction.
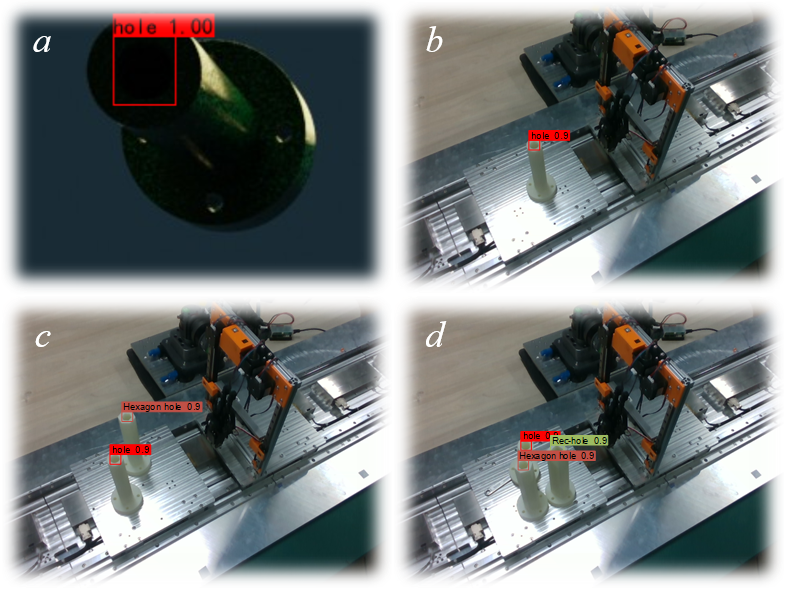
Figure 13. Object detection effect diagram
Figure 13 shows the object detection effects of the Improved model, where (a) shows the detection of target hole positions in extremely dark lighting conditions, (b) shows single target hole position detection, and (c) and (d) show the detection effects of target holes in scenarios with hexagonal interference and with both hexagonal and quadrilateral interference, respectively. As shown, the model can effectively detect target hole positions in all these scenarios.
5. Conclusion
This research focuses on the target localization detection task in shaft-hole assembly processes, proposing an improved multi-module fusion method based on the current state-of-the-art (SOTA) object detection model YOLO11. By optimizing the backbone network to RepViT, adding a lightweight detection head (E-Head), and incorporating a feature module that integrates Edge Information (EIF), the enhanced model demonstrates improved performance in complex backgrounds and small object detection. The refined model was validated on both the public Pascal VOC dataset and a custom shaft-hole dataset, with results showing that the modified network outperforms the baseline model across multiple metrics including Precision (P), Recall (R), mean Average Precision (mAP), and confusion matrix analysis. Additionally, ablation experiments were conducted to evaluate the individual contributions of each improved module to the overall performance enhancement.
References
[1]. Zou, Z., Chen, K., Shi, Z., Guo, Y., & Ye, J. (2023). Object detection in 20 years: A survey. Proceedings of the IEEE, 111(3), 257-276. https://doi.org/10.1109/JPROC.2023.3238524
[2]. LeCun, Y., Bottou, L., Bengio, Y., & Haffner, P. (1998). Gradient-based learning applied to document recognition. Proceedings of the IEEE, 86(11), 2278-2324. https://doi.org/10.1109/5.726791
[3]. Girshick, R. (2015). Fast R-CNN. In Proceedings of the 2015 IEEE International Conference on Computer Vision (pp. 1440-1448). IEEE Computer Society. https://doi.org/10.1109/ICCV.2015.169
[4]. Dai, X., Chen, Y., Yang, J., Zhang, P., Yuan, L., & Zhang, L. (2021). Dynamic DETR: End-to-end object detection with dynamic attention. 2021 IEEE/CVF International Conference on Computer Vision (ICCV) (pp. 2968-2977). IEEE. https://doi.org/10.1109/ICCV48922.2021.00298
[5]. Zhai, S., Shang, D., Wang, S., & Dong, S. (2020). DF-SSD: An improved SSD object detection algorithm based on DenseNet and feature fusion. IEEE Access, 8, 24344-24357. https://doi.org/10.1109/ACCESS.2020.2971026
[6]. Jiang, P., Ergu, D., Liu, F., Cai, Y., & Ma, B. (2022). A review of YOLO algorithm developments. Procedia Computer Science, 199, 1066-1073.
[7]. Vaswani, A., Shazeer, N., Parmar, N., Uszkoreit, J., Jones, L., Gomez, A. N., Kaiser, Ł., & Polosukhin, I. (2017). Attention is all you need. In Proceedings of the 31st International Conference on Neural Information Processing Systems (pp. 6000-6010). Curran Associates.
[8]. Khanam, R., & Hussain, M. (2024). YOLOv11: An overview of the key architectural enhancements. arXiv preprint arXiv:2410.17725.
[9]. Khanam, R., Asghar, T., & Hussain, M. (2025). Comparative performance evaluation of YOLOv5, YOLOv8, and YOLOv11 for solar panel defect detection. Solar, 5(1), 6.
[10]. Wang, G. Q., Chen, J. B., Li, C. Z., & Lu, S. (2025). Edge-YOLO: Lightweight multi-scale feature extraction for industrial surface inspection. IEEE Access. in press.
[11]. Ding, X., Zhang, X., Ma, N., Han, J., Ding, G., & Sun, J. (2021). RepVGG: Making VGG-style ConvNets great again. 2021 IEEE/CVF Conference on Computer Vision and Pattern Recognition (CVPR) (pp. 13728-13737). IEEE. https://doi.org/10.1109/CVPR46437.2021.01352
[12]. Aoun, A., Masadeh, M., & Tahar, S. (2022). On the design of approximate Sobel filter. In 2022 International Conference on Microelectronics (ICM) (pp. 102-106). IEEE.
[13]. Chen, J., Kao, S.H., He, H., Zhuo, W., Wen, S., Lee, C.H., & Chan, S.H. G. (2023). Run, don't walk: Chasing higher FLOPS for faster neural networks. 2023 IEEE/CVF Conference on Computer Vision and Pattern Recognition (CVPR) (pp. 12021-12031). IEEE. https://doi.org/10.1109/CVPR52729.2023.01157
[14]. Everingham, M., Van Gool, L., Williams, C. K. I., Winn, J., & Zisserman, A. (2010). The pascal visual object classes (VOC) challenge. International Journal of Computer Vision, 88, 303-338.
[15]. Shen Y, Jia Q, Wang R, Huang Z, & Chen G. Learning-Based Visual Servoing for High-Precision Peg-in-Hole Assembly. Actuators. 2023; 12(4):144. https://doi.org/10.3390/act12040144
Cite this article
Tian,Y.;Liu,B.;Zhu,B.;Zhang,J. (2025). Improved YOLO11-based inspection method for peg and hole parts. Advances in Engineering Innovation,16(4),24-36.
Data availability
The datasets used and/or analyzed during the current study will be available from the authors upon reasonable request.
Disclaimer/Publisher's Note
The statements, opinions and data contained in all publications are solely those of the individual author(s) and contributor(s) and not of EWA Publishing and/or the editor(s). EWA Publishing and/or the editor(s) disclaim responsibility for any injury to people or property resulting from any ideas, methods, instructions or products referred to in the content.
About volume
Journal:Advances in Engineering Innovation
© 2024 by the author(s). Licensee EWA Publishing, Oxford, UK. This article is an open access article distributed under the terms and
conditions of the Creative Commons Attribution (CC BY) license. Authors who
publish this series agree to the following terms:
1. Authors retain copyright and grant the series right of first publication with the work simultaneously licensed under a Creative Commons
Attribution License that allows others to share the work with an acknowledgment of the work's authorship and initial publication in this
series.
2. Authors are able to enter into separate, additional contractual arrangements for the non-exclusive distribution of the series's published
version of the work (e.g., post it to an institutional repository or publish it in a book), with an acknowledgment of its initial
publication in this series.
3. Authors are permitted and encouraged to post their work online (e.g., in institutional repositories or on their website) prior to and
during the submission process, as it can lead to productive exchanges, as well as earlier and greater citation of published work (See
Open access policy for details).
References
[1]. Zou, Z., Chen, K., Shi, Z., Guo, Y., & Ye, J. (2023). Object detection in 20 years: A survey. Proceedings of the IEEE, 111(3), 257-276. https://doi.org/10.1109/JPROC.2023.3238524
[2]. LeCun, Y., Bottou, L., Bengio, Y., & Haffner, P. (1998). Gradient-based learning applied to document recognition. Proceedings of the IEEE, 86(11), 2278-2324. https://doi.org/10.1109/5.726791
[3]. Girshick, R. (2015). Fast R-CNN. In Proceedings of the 2015 IEEE International Conference on Computer Vision (pp. 1440-1448). IEEE Computer Society. https://doi.org/10.1109/ICCV.2015.169
[4]. Dai, X., Chen, Y., Yang, J., Zhang, P., Yuan, L., & Zhang, L. (2021). Dynamic DETR: End-to-end object detection with dynamic attention. 2021 IEEE/CVF International Conference on Computer Vision (ICCV) (pp. 2968-2977). IEEE. https://doi.org/10.1109/ICCV48922.2021.00298
[5]. Zhai, S., Shang, D., Wang, S., & Dong, S. (2020). DF-SSD: An improved SSD object detection algorithm based on DenseNet and feature fusion. IEEE Access, 8, 24344-24357. https://doi.org/10.1109/ACCESS.2020.2971026
[6]. Jiang, P., Ergu, D., Liu, F., Cai, Y., & Ma, B. (2022). A review of YOLO algorithm developments. Procedia Computer Science, 199, 1066-1073.
[7]. Vaswani, A., Shazeer, N., Parmar, N., Uszkoreit, J., Jones, L., Gomez, A. N., Kaiser, Ł., & Polosukhin, I. (2017). Attention is all you need. In Proceedings of the 31st International Conference on Neural Information Processing Systems (pp. 6000-6010). Curran Associates.
[8]. Khanam, R., & Hussain, M. (2024). YOLOv11: An overview of the key architectural enhancements. arXiv preprint arXiv:2410.17725.
[9]. Khanam, R., Asghar, T., & Hussain, M. (2025). Comparative performance evaluation of YOLOv5, YOLOv8, and YOLOv11 for solar panel defect detection. Solar, 5(1), 6.
[10]. Wang, G. Q., Chen, J. B., Li, C. Z., & Lu, S. (2025). Edge-YOLO: Lightweight multi-scale feature extraction for industrial surface inspection. IEEE Access. in press.
[11]. Ding, X., Zhang, X., Ma, N., Han, J., Ding, G., & Sun, J. (2021). RepVGG: Making VGG-style ConvNets great again. 2021 IEEE/CVF Conference on Computer Vision and Pattern Recognition (CVPR) (pp. 13728-13737). IEEE. https://doi.org/10.1109/CVPR46437.2021.01352
[12]. Aoun, A., Masadeh, M., & Tahar, S. (2022). On the design of approximate Sobel filter. In 2022 International Conference on Microelectronics (ICM) (pp. 102-106). IEEE.
[13]. Chen, J., Kao, S.H., He, H., Zhuo, W., Wen, S., Lee, C.H., & Chan, S.H. G. (2023). Run, don't walk: Chasing higher FLOPS for faster neural networks. 2023 IEEE/CVF Conference on Computer Vision and Pattern Recognition (CVPR) (pp. 12021-12031). IEEE. https://doi.org/10.1109/CVPR52729.2023.01157
[14]. Everingham, M., Van Gool, L., Williams, C. K. I., Winn, J., & Zisserman, A. (2010). The pascal visual object classes (VOC) challenge. International Journal of Computer Vision, 88, 303-338.
[15]. Shen Y, Jia Q, Wang R, Huang Z, & Chen G. Learning-Based Visual Servoing for High-Precision Peg-in-Hole Assembly. Actuators. 2023; 12(4):144. https://doi.org/10.3390/act12040144