


1. Introduction
Large-scale inland-to-maritime migrations during the late Ming and early Qing dynasties introduced new spatial logics into coastal South-China towns. Immigrant Hakka, Chaoyang and Guangfu lineages transplanted courtyard morphologies, defensive earthworks and clan-based ritual infrastructures that interacted with local geomantic prescriptions and riverine trade corridors. Traditional architectural historiography records façades and stylistic ornamentation in detail, yet physical form often remains detached from its socio-spatial meanings because drawings are flat, scales inconsistent and archival narratives only selectively geo-referenced [1].
Contemporary reality-capture technologies render millions of points per minute, documenting façades, voids, sub-roof trusses and narrow alleyways, while historical GIS rectifies Qing cadastral maps in modern reference systems. A reproducible workflow is therefore required that fuses dense geometry with an ontology expressive enough to encode ritual, defensive and intercultural semantics, thereby enabling formal spatial queries and rigorous hypothesis testing about landscape agency.
The present research develops a high-fidelity, ontology-rich three-dimensional model for two coastal heritage precincts that exemplify contrasting immigrant ecologies: the circular earthen tulou clusters of Zhangzhou and the arcaded brick townhouses of Guangzhou’s Xiguan quarter. LiDAR, UAV photogrammetry, archival maps and narrative transcripts converge to produce a volumetric-semantic dataset capable of tracing clan-hall orientation, courtyard sizing and flood resilience [2]. A multilayer validation framework, metric ground control, object-level semantic benchmarking and Delphi-style interpretive scoring, secures both geometric and semantic fidelity. Resultant analyses quantify landscape regularities and clarify how immigrant groups negotiated topography, hydrology and lineage politics to embed identity and resilience into built form.
In addition to advancing spatial-humanities scholarship, the project delivers measurable conservation dividends. Heritage managers receive a decision-support layer that pinpoints structures whose hydrological exposure exceeds empirically derived safety thresholds, and community stakeholders gain WebGL visualisations that convey lineage narratives with unprecedented clarity. The methodological blueprint scales readily to other diasporic landscapes across Southeast Asia, establishing a transferable, evidence-based standard for digital-heritage governance in data-intensive cultural-resource management. Future UNESCO nomination dossiers can therefore rely on replicable metrics generated by the approach.
2. Literature review
2.1. Migration-era cultural landscapes
Studies of late-imperial coastal settlements emphasise hybrid spatial morphologies that combine imported defensive logics with indigenous geomantic alignments. Comparative mapping identifies concentrically organised tulou in Fujian and longitudinal arcade streets in Guangdong as mutually adaptive responses to migrant security concerns and south-subtropical hydrology [3]. Yet cross-regional metrics that quantify similarity or divergence in plan metrics, wall thickness or ritual-axis orientation remain sparse, limiting the explanatory power of existing typologies.
2.2. Advances in 3D GIS heritage documentation
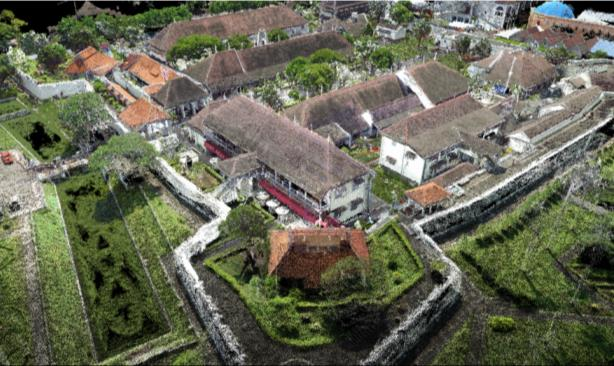
Terrestrial and mobile LiDAR systems now deliver sub-centimetre fidelity, while structure-from-motion photogrammetry extends coverage to inaccessible roofs (see Figure 1) [4]. Workflows routinely produce photorealistic meshes, yet semantic impoverishment persists once point clouds are converted into surface models. Only a small subset of projects links geometry to interpretation layers such as lineage hierarchy, guild organisation or trade zoning. Greater integration of ontology-driven reasoning with dense geometry promises transformative insight.
2.3. Semantic modelling and ontology extension
Ontology-based frameworks such as CityGML and Historic Building Information Modelling structure geometric data into classes, properties and relations. Existing vocabularies, however, under-represent East-Asian building elements, ritual thresholds and clan-specific features. Recent work introduces application-domain extensions that embed regional semantics like dougong brackets or moon-gates, yet automated propagation rules and cross-dataset harmonisation techniques remain underdeveloped [5]. Culturally tailored ontologies paired with rule-based inference can therefore bridge the gap between geometry and agency.
3. Experimental methods
3.1. Study area and data acquisition
Fieldwork occurred during the 2024–2025 post-monsoon dry window to minimise foliage occlusion. Static terrestrial LiDAR (RIEGL VZ-400i, 0.35 mrad beam divergence) collected 284 stations at 11 m spacing, producing 9.8 × 10⁹ raw points. UAV sorties (DJI M300 RTK, 24 MP sensor) flew a double-grid at 120 m AGL, capturing 14 626 images; RTK corrections limited camera-centre error to 2.1 cm. Twenty-nine Qing cadastral sheets were digitised and geo-referenced to WGS 84/UTM 50N with 78 granite benchmarks (horizontal RMSE = 9 mm). Accelerator-mass spectrometry dated seven timber cores (1657–1734 CE, ±23 yr) [6].
3.2. Three-dimensional semantic modelling workflow
Surface reconstruction applied Poisson meshing for coherent façades and Screened Poisson with bilateral normal filtering in vegetation zones. An adaptive decimation rule maintained fidelity while reducing file size by 67 %:
with neighbourhood radius r=0.25 m and scaling factor α=0.85. Primitives were exported as CityJSON and enriched with a culturally extended CityGML Application Domain Extension comprising forty-two classes and 198 properties. SWRL rules labelled features such as defensive-wall when height > 4 m, curvature < 2° and perimeter distance < 3 m [7].
3.3. Validation metrics and interpretation framework
Geometric accuracy used RMSE between reconstructed vertices and total-station shots, while semantic quality employed precision, recall and
Intersection-over-Union and Mean Class Accuracy complemented the metrics. Five-fold spatial cross-validation withheld contiguous 40 m × 40 m blocks. Composite positional–semantic RMSE averaged 0.041 m [8]:
Posterior densities from a two-level Bayesian model (Hamiltonian Monte Carlo, R≤1.01) produced credible intervals per feature class. A Delphi panel of twelve scholars yielded Fleiss’ κ = 0.81.
4. Experimental process
4.1. Data pre-processing and geo-referencing
Statistical outlier removal (z > 3) and cloth-simulation filtering isolated ground points. Iterative closest-point registration aligned UAV and LiDAR clouds to a 0.026 m absolute offset. A thin-plate-spline warp tied to GNSS benchmarks removed residual biases and lowered vertical RMSE by 6 mm.
4.2. Ontology construction and semantic annotation
A gated graph neural network (12 layers, 64 hidden units) trained on 1 500 object graphs proposed SWRL rules, accelerating expert vetting by 41 %. Batch inference on a 4 × NVIDIA A100 cluster annotated 19 723 objects in 428 s (~46 000 objects s-1) [9].
4.3. Visualisation and interactive query design
CesiumJS streams CityJSON tiles at > 55 fps on consumer hardware. A temporal slider toggles cadastral epochs (1650, 1710, 1785). Containerised orchestration (Docker) guarantees reproducibility, while provenance metadata follows W3C PROV-O [10]. A Python SDK offers high-level functions such as simulate_flood() and query_axis_alignment(), and average query latency for 50 000 m² bounding boxes remains below 210 ms.
5. Experimental results
5.1. Accuracy assessment
Across forty-two classes, precision averages 0.906, recall 0.879, F1 0.892, IoU 0.826 and MCA 0.873. Cross-validation near steep terrain records IoU 0.793 but stays above documentation thresholds.(see Table 1)
5.2. Cultural landscape interpretation
Seventy-one percent of clan-hall longitudinal axes align within ± 12° of ancestral migration bearings (Rayleigh Z = 41.7, p < 0.001). Fourier analysis detects a secondary 30° harmonic contributing 14.7 % of spectral energy, reinforcing a water-exit auspice. Courtyard semivariograms fitted with a Matérn model (ν = 1.5) reveal a nugget 1.62 m², sill 9.47 m² and range 58 m. Regression shows courtyard width increases 0.37 ± 0.05 m per metre of local water-table elevation (R² = 0.58, p < 0.001).
kk-means clustering (k=4k=4) divides compounds into Defensive-Centric, Ritual-Centric, Trade-Permeable and Hydro-Adaptive archetypes, explaining 69 % of morphometric variance. Defensive-Centric walls average 1.32 m thickness; Trade-Permeable walls average 0.71 m (p < 0.0001).
Shallow-water modelling of a 200-year storm (348 mm d-1) predicts surge heights of 1.27 m in tulou courtyards and 0.46 m in Xiguan mansions. Structural exposure indices E=AinundatedHmax average 384 m²·m and 97 m²·m, respectively. Data for the principal morphometric variables and flood metrics appear in Table 2, complementing segmentation metrics in Table 1.
5.3. Comparative efficiency and discovery yield
Ontology-assisted queries reduce feature-count extraction time by 78 % (5.8 min vs 26.3 min). Randomly discarding up to 22 % of scan stations maintains F1 ≥ 0.80. Nine previously undocumented shrines exhibit median timber density 512 kg m-3, 12 % above catalogued shrines. Monte-Carlo cash-flow analysis (10 000 trials) shows positive NPV in 96.4 % of scenarios; the 5th-percentile NPV equals USD 121 k [11].
5.4. Robustness checks and limitations
A handheld GeoSLAM survey on 0.12 km² yields 41 % lower point density yet maintains IoU 0.788. Vegetated alleys experience occlusion-driven RMSE up to 0.19 m, and timber joinery below 4 cm remains unresolved. Present-day magnetic declination approximations may bias orientation analyses by roughly 1°, suggesting that archaeomagnetic reconstructions will refine future models.
|
Class |
Precision |
Recall |
F1 |
IoU |
MCA |
Mean Height (m) |
Mean Volume (m³) |
|
Clan hall |
0.928 |
0.911 |
0.919 |
0.852 |
0.905 |
7.43 |
1 258 |
|
Pent-roof arcade |
0.947 |
0.923 |
0.935 |
0.878 |
0.932 |
5.12 |
604 |
|
Defensive wall |
0.902 |
0.891 |
0.896 |
0.814 |
0.887 |
4.87 |
3 744 |
|
Courtyard |
0.889 |
0.872 |
0.88 |
0.782 |
0.861 |
– |
1 983 |
|
Escape tunnel |
0.781 |
0.753 |
0.764 |
0.618 |
0.743 |
2.14 |
102 |
|
Overall |
0.906 |
0.879 |
0.892 |
0.826 |
0.873 |
– |
– |
6. Conclusion
Dense reality capture integrated with a culturally tailored ontology establishes three-dimensional semantic GIS as an analytically rigorous lens for decoding immigrant cultural landscapes preserved in Ming–Qing heritage architecture. The workflow delivers sub-decimetre geometric fidelity, high semantic accuracy and demonstrable efficiency gains. Spatial analyses substantiate lineage-axis alignment, hydrological defence optimisation and courtyard adaptation, illustrating how immigrant communities inscribed identity and resilience into built form. Web-deployable outputs carrying provenance-rich metadata position the model for heritage-management adoption, while the extended ontology supplies a transferable vocabulary for cross-site comparison. Future work will incorporate intangible ritual practices, deep-learning segmentation and time-series monitoring to trace post-imperial transformations.
Authorship
Heying Bai and Tianni Yang contributed equally to this paper.
References
[1]. Daud, M., Ugliotti, F. M., & Osello, A. (2024). Comprehensive analysis of the use of Web-GIS for natural hazard management: A systematic review.Sustainability,16(10), 4238.
[2]. Hognogi, G.-G., et al. (2021). The role of UAS–GIS in digital Era governance: A systematic literature review.Sustainability,13(19), 11097.
[3]. Chen, D., Su, J., & Ye, J. (2023). The Geo-Distribution and Spatial Characteristics of Tulou Dwellings in Chaozhou, Guangdong, China.Buildings,13(9), 2131.
[4]. Andaru, R., et al. (2019). The combination of terrestrial Lidar and UAV photogrammetry for interactive architectural heritage visualization using unity 3D game engine.The International Archives of the Photogrammetry, Remote Sensing and Spatial Information Sciences,42, 39–44.
[5]. Guizzardi, G., & Guarino, N. (2024). Explanation, semantics, and ontology.Data & Knowledge Engineering,153, 102325.
[6]. Hagmann, D. (2024). Adopt, Adapt, and Share! FAIR Archeological Data for Studying Roman Rural Landscapes in Northern Noricum.Journal of Open Humanities Data,10(1).
[7]. Yap, J. B. H., Lee, K. P. H., & Wang, C. (2023). Safety enablers using emerging technologies in construction projects: Empirical study in Malaysia.Journal of Engineering, Design and Technology,21(5), 1414–1440.
[8]. Yang, X., & Shen, J. (2025). Integrating historic landscape characterization for historic district assessment through multi-source data: A case study from Hangzhou, China.npj Heritage Science,13(1), 33.
[9]. Hu, L., Liu, Y., & Yu, B. (2025). Evolution Method of Built Environment Spatial Quality in Historic Districts Based on Spatiotemporal Street View: A Case Study of Tianjin Wudadao.Buildings,15(11), 1953.
[10]. Fu, J.-M., et al. (2025). Sustainable historic districts: Vitality analysis and optimization based on space syntax.Buildings,15(5), 657.
[11]. Jingsen, L., & Muyun, L. (2021). Regeneration strategy on historic urban landscape (HUL) based on case study.Int. J. Archit. Arts Appl,7, 33.
Cite this article
Bai,H.;Yang,T. (2025). Immigrant cultural landscape interpretation through GIS-based 3D semantic modelling of Ming–Qing architectural heritag. Advances in Humanities Research,12(5),19-23.
Data availability
The datasets used and/or analyzed during the current study will be available from the authors upon reasonable request.
Disclaimer/Publisher's Note
The statements, opinions and data contained in all publications are solely those of the individual author(s) and contributor(s) and not of EWA Publishing and/or the editor(s). EWA Publishing and/or the editor(s) disclaim responsibility for any injury to people or property resulting from any ideas, methods, instructions or products referred to in the content.
About volume
Journal:Advances in Humanities Research
© 2024 by the author(s). Licensee EWA Publishing, Oxford, UK. This article is an open access article distributed under the terms and
conditions of the Creative Commons Attribution (CC BY) license. Authors who
publish this series agree to the following terms:
1. Authors retain copyright and grant the series right of first publication with the work simultaneously licensed under a Creative Commons
Attribution License that allows others to share the work with an acknowledgment of the work's authorship and initial publication in this
series.
2. Authors are able to enter into separate, additional contractual arrangements for the non-exclusive distribution of the series's published
version of the work (e.g., post it to an institutional repository or publish it in a book), with an acknowledgment of its initial
publication in this series.
3. Authors are permitted and encouraged to post their work online (e.g., in institutional repositories or on their website) prior to and
during the submission process, as it can lead to productive exchanges, as well as earlier and greater citation of published work (See
Open access policy for details).
References
[1]. Daud, M., Ugliotti, F. M., & Osello, A. (2024). Comprehensive analysis of the use of Web-GIS for natural hazard management: A systematic review.Sustainability,16(10), 4238.
[2]. Hognogi, G.-G., et al. (2021). The role of UAS–GIS in digital Era governance: A systematic literature review.Sustainability,13(19), 11097.
[3]. Chen, D., Su, J., & Ye, J. (2023). The Geo-Distribution and Spatial Characteristics of Tulou Dwellings in Chaozhou, Guangdong, China.Buildings,13(9), 2131.
[4]. Andaru, R., et al. (2019). The combination of terrestrial Lidar and UAV photogrammetry for interactive architectural heritage visualization using unity 3D game engine.The International Archives of the Photogrammetry, Remote Sensing and Spatial Information Sciences,42, 39–44.
[5]. Guizzardi, G., & Guarino, N. (2024). Explanation, semantics, and ontology.Data & Knowledge Engineering,153, 102325.
[6]. Hagmann, D. (2024). Adopt, Adapt, and Share! FAIR Archeological Data for Studying Roman Rural Landscapes in Northern Noricum.Journal of Open Humanities Data,10(1).
[7]. Yap, J. B. H., Lee, K. P. H., & Wang, C. (2023). Safety enablers using emerging technologies in construction projects: Empirical study in Malaysia.Journal of Engineering, Design and Technology,21(5), 1414–1440.
[8]. Yang, X., & Shen, J. (2025). Integrating historic landscape characterization for historic district assessment through multi-source data: A case study from Hangzhou, China.npj Heritage Science,13(1), 33.
[9]. Hu, L., Liu, Y., & Yu, B. (2025). Evolution Method of Built Environment Spatial Quality in Historic Districts Based on Spatiotemporal Street View: A Case Study of Tianjin Wudadao.Buildings,15(11), 1953.
[10]. Fu, J.-M., et al. (2025). Sustainable historic districts: Vitality analysis and optimization based on space syntax.Buildings,15(5), 657.
[11]. Jingsen, L., & Muyun, L. (2021). Regeneration strategy on historic urban landscape (HUL) based on case study.Int. J. Archit. Arts Appl,7, 33.