


1. Introduction
As a populous country, China ranks first in the world in terms of carbon emissions. According to relevant data from the China Building Energy Efficiency Association, the total carbon emissions from the entire process of construction nationwide reached 5.08 billion tons of CO2 in 2020, accounting for 50.9% of the country’s total carbon emissions. The carbon emissions during the operation phase of buildings amounted to 2.16 billion tons of CO2, accounting for 21.7% of the total national carbon emissions and 42.5% of the entire lifecycle of buildings. [1]In 2020, President Xi Jinping emphasized at the 75th United Nations General Assembly that China will adopt more favorable policies and measures, striving to peak carbon dioxide emissions before 2030 and aiming to achieve carbon neutrality by 2060. [2]It is evident that there is immense potential for energy conservation and emission reduction in China’s construction industry.
At the same time, most green buildings struggle to obtain green building certification (commonly referred to as “operation certification”). This is because there has been a prevailing notion in China of “emphasizing design and construction, while neglecting operation and maintenance” [3]. Therefore, enterprises often disregard the operational phase after obtaining green building design certification. Hence, researching the factors influencing the development of the operational phase of green buildings holds significant importance for China.
2. Literature Review
Regarding the three main entities of green building operation - government, property management, and consumers, scholars both domestically and internationally have conducted extensive research using various methodologies. Concerning the government, Li Xiangjun [4] indicates that governments typically employ measures such as financial subsidies and tax incentives to encourage building development, and strengthening regulatory measures can effectively promote the improvement of management capabilities. Liu Guangfeng and Xie Yang [5] suggest that the government should enhance comprehensive supervision of green building processes to ensure compliance with standards. Liang Xi and Fu Yang [6] point out that the government should optimize policy environments to continuously promote green building development, attract talent and new technologies, and further reduce the costs of green buildings. Wang Bo, Liao Fangwei, and Zhang Jingqin [7] utilize evolutionary game theory and methods to demonstrate that under the dual mechanism of government incentives and penalties, the development of green buildings is faster, deeply implementing green development strategies, and promoting emissions reduction during the operation phase. Regarding property management, Liu Ge and Fu Yingjie [8] believe that property management companies lack the initiative to improve their levels of green operational management. Weiyi He et al. [9] state that operational management personnel need to possess corresponding professional knowledge in green technology and qualified awareness of energy conservation and environmental protection, and establish professional green building operational management teams and standardized management systems. G. S. Vyas et al. [10] employ Analytic Hierarchy Process (AHP) and Entropy methods, indicating that the primary attribute of concern for building operators regarding sustainable development considerations is the operational and maintenance costs. Hong Xiaowei [11] constructs a grey fuzzy evaluation model to provide technical guidance for green operations, enabling builders, designers, operators, and consumers to take action from the outset, fully embodying the people-oriented ideology. Concerning consumers, Thuy Thi Thu Nguyen and Michael Waibel [12] point out that the social awareness of green building certification is low, and Vietnamese consumers understand the environmental benefits of green buildings, focusing more on the health benefits to households rather than the prices of green buildings and energy-saving costs. Scholars such as Yunxia Liu, Xunpeng Shi et al. [13] emphasize the importance of the operational phase of green buildings, effective operations can increase resident satisfaction and repurchase rates, subjective knowledge and environmental attitudes are the main factors influencing consumers’ repurchase intentions. Wang Bo, Wen Hua, Zhang Wei, et al. [14] argue that consumers need to change their traditional mindset and work together with the government, developers, and other market entities to jointly develop green buildings.
In summary, scholars both domestically and internationally have studied the issues existing in the operational phase of green buildings from the perspectives of government, property management, and consumers, and have provided certain suggestions. However, there is relatively little research on the connection between these three entities, lacking relevance. Based on this, this paper conducts research on the correlation of various influencing factors by constructing a DEMATEL-ISM model.
3. Influencing Factors of Green Building Operation
Due to the extensive scope of green building operation, this paper, through searching on CNKI (China National Knowledge Infrastructure) using keywords such as “green building questionnaire” and “green building operation,” extracted 66 influencing factors from 331 articles. These factors were then compiled into a survey questionnaire, and through testing with a large number of samples, 53 constraining factors were refined through reliability and validity analysis. These 53 influencing factors were then transformed into the final survey questionnaire. By conducting surveys and consulting with professionals and university professors in the field of green building, duplicate and ambiguously expressed factors were eliminated. Finally, 27 major factors were distilled. Table 1 illustrates the influencing factors of the green building operation phase.
Table 1: Influencing Factors of Green Building Operation Phase
Main Categories | Subcategories | Number | Influencing Factors |
Government | Mandatory Policies | S1 | Degree of Improvement in Mandatory Measures of Government Policies and Regulations |
S2 | Punishment for Building Enterprises Not Meeting Energy Efficiency Requirements by the Government | ||
S3 | Degree of Improvement in Government Regulatory System | ||
S4 | Support Provided by Government in Green Building Technology, Talent, and Funding | ||
Incentive Policies | S5 | Degree of Improvement in Incentive Measures of Government Policies and Regulations | |
S6 | National Tax Subsidy Policies Related to Green and Energy-Efficient Buildings | ||
S7 | Economic Incentives for Green Energy Projects by the Government | ||
Supportive Services Policies | S8 | Coordination Ability among Relevant Government Agencies | |
S9 | Rationality of Local Green Building Development Plans | ||
Property Management | Operating Costs | S10 | Funds Invested by Property Management Departments in Facility Maintenance |
S11 | Funds Invested by Property Management Departments in Facility Operational Expenses | ||
Management Capability | S12 | Professionalism of Property Management Personnel in Operational Management | |
S13 | Proficiency of Property Management Personnel in Equipment Usage | ||
S14 | Attitude of Property Management Personnel towards Green Building Operations | ||
Risk Management | S15 | Risk of Changes in Green Building Rating Standards | |
S16 | Risk of Changes in Green Building Laws and Regulations | ||
Consumers | Consumer Indoor Satisfaction | S17 | Sound Insulation Effectiveness of Residential Area Rooms |
S18 | Quality of Domestic Water in Residential Areas | ||
S19 | Overall Quality of Residential Areas | ||
S20 | Practicality of Residential Areas | ||
S21 | Comfort of Residential Areas | ||
Consumer Outdoor Satisfaction | S22 | Completeness of Supporting Facilities such as Education, Elderly Care, Medical, and Commercial Services in Residential Areas | |
S23 | Air Quality in Residential Areas | ||
S24 | Sound Environment Quality in Residential Areas | ||
Main Categories | Subcategories | Number | Influencing Factors |
Consumer Behavioral Attitude | S25 | Importance of Green Residential Buildings in Enhancing Socioeconomic Benefits | |
S26 | Utilization Rate of Renewable Energy in Residential Areas | ||
S27 | Intelligence and Energy Efficiency Rate of Electronic Devices in Residential Areas |
4. Construction of the DEMATEL-ISM Model
4.1. Introduction to DEMATEL-ISM Method
The Decision-Making Trial and Evaluation Laboratory (DEMATEL) method calculates the influence and affectedness of each factor through logical relationships and direct impact matrices among various elements. It determines the centrality and causality of each factor, studies the causal relationships among factors, and identifies key factors. [15] The Interpretive Structural Modeling (ISM) method examines the structural relationships of complex systems by analyzing their subsystems and elements, dividing them into multiple levels to construct a multi-level hierarchical model, thereby clarifying the direct relationships among factors. [16]In this paper, these two methods are combined, allowing not only the identification of the main factors influencing the operational phase of green building but also the establishment of a hierarchical structure diagram of the factors, resulting in clear and comprehensible outcomes. The process of the DEMATEL-ISM model is depicted in Figure 1.
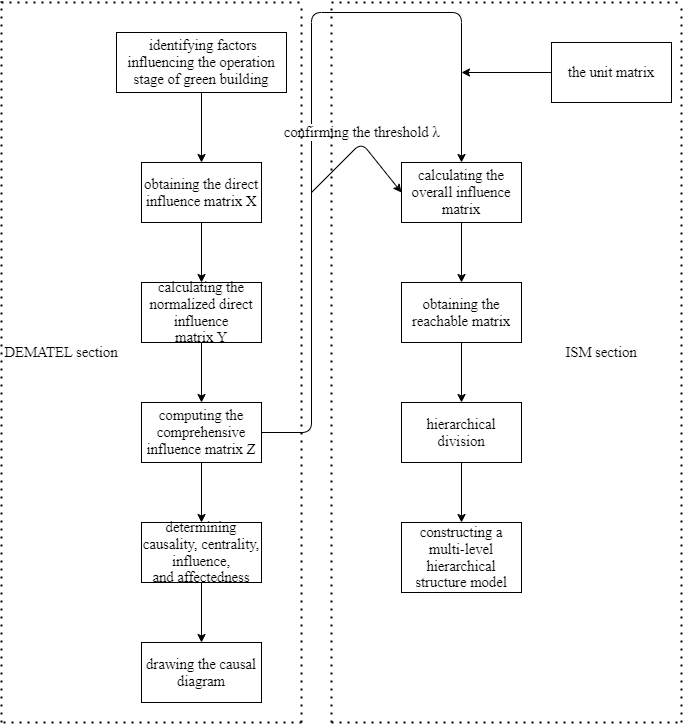
Figure 1: Flowchart of the DEMATEL-ISM Model
4.2. Construction Steps of the DEMATEL-ISM Model
4.2.1. DEMATEL Method. (1) Direct Impact Matrix:
Based on the 27 factors listed in Table 1, a questionnaire was developed and distributed to 15 experts and university professors in the field of green building. They were asked to rate the interactions among various elements. The degree of influence was categorized into five levels: 0-4, representing slight influence, minor influence, moderate influence, significant influence, and severe influence, respectively. The results were statistically analyzed, and the averages were computed. The calculated results were rounded to the nearest integer to obtain the direct impact matrix X, as shown in Table 2.
Table 2: Direct Impact Matrix X
Influencing Factors | S1 | S2 | S3 | S4 | S5 | S6 | S7 | S8 | S9 | S10 | S11 | S12 | S13 | S14 | S15 | S16 | S17 | S18 | S19 | S20 | S21 | S22 | S23 | S24 | S25 | S26 | S27 |
S1 | 0 | 2 | 2 | 1 | 1 | 3 | 2 | 2 | 2 | 0 | 0 | 0 | 0 | 0 | 0 | 0 | 0 | 0 | 0 | 0 | 0 | 0 | 0 | 0 | 0 | 0 | 0 |
S2 | 0 | 0 | 1 | 1 | 0 | 0 | 0 | 0 | 1 | 0 | 0 | 0 | 0 | 0 | 0 | 0 | 0 | 0 | 0 | 0 | 0 | 0 | 0 | 0 | 1 | 0 | 0 |
S3 | 0 | 1 | 0 | 1 | 0 | 0 | 1 | 0 | 1 | 0 | 0 | 0 | 1 | 0 | 1 | 0 | 0 | 0 | 0 | 1 | 0 | 0 | 1 | 0 | 0 | 0 | 3 |
S4 | 0 | 1 | 1 | 0 | 0 | 0 | 0 | 0 | 1 | 1 | 0 | 2 | 0 | 0 | 0 | 0 | 0 | 0 | 1 | 0 | 0 | 1 | 0 | 1 | 1 | 0 | 0 |
S5 | 0 | 2 | 1 | 2 | 0 | 0 | 0 | 0 | 1 | 0 | 0 | 0 | 0 | 3 | 0 | 0 | 0 | 0 | 0 | 0 | 0 | 0 | 1 | 0 | 0 | 1 | 0 |
S6 | 0 | 2 | 2 | 2 | 3 | 0 | 3 | 0 | 1 | 0 | 0 | 0 | 0 | 0 | 0 | 0 | 0 | 0 | 0 | 1 | 0 | 0 | 0 | 1 | 1 | 0 | 0 |
S7 | 0 | 2 | 2 | 2 | 0 | 0 | 0 | 0 | 2 | 0 | 0 | 2 | 0 | 0 | 0 | 0 | 0 | 0 | 0 | 0 | 0 | 0 | 0 | 0 | 0 | 0 | 0 |
S8 | 2 | 1 | 1 | 1 | 1 | 2 | 1 | 0 | 1 | 0 | 0 | 0 | 1 | 0 | 1 | 1 | 1 | 1 | 1 | 0 | 0 | 1 | 0 | 0 | 0 | 0 | 2 |
S9 | 0 | 1 | 1 | 1 | 0 | 0 | 0 | 0 | 0 | 0 | 0 | 0 | 0 | 0 | 0 | 0 | 0 | 0 | 0 | 0 | 0 | 0 | 0 | 0 | 0 | 1 | 0 |
S10 | 1 | 1 | 1 | 1 | 1 | 1 | 1 | 1 | 0 | 0 | 2 | 2 | 2 | 1 | 0 | 0 | 1 | 1 | 1 | 1 | 1 | 1 | 1 | 1 | 1 | 0 | 0 |
S11 | 1 | 0 | 0 | 1 | 1 | 1 | 1 | 1 | 0 | 1 | 0 | 1 | 1 | 1 | 2 | 0 | 1 | 1 | 1 | 1 | 1 | 1 | 1 | 1 | 1 | 0 | 0 |
S12 | 1 | 1 | 1 | 1 | 1 | 1 | 0 | 1 | 0 | 1 | 1 | 0 | 2 | 1 | 2 | 0 | 1 | 1 | 1 | 1 | 0 | 1 | 0 | 0 | 1 | 0 | 0 |
S13 | 1 | 1 | 1 | 1 | 1 | 2 | 0 | 1 | 1 | 2 | 1 | 1 | 0 | 1 | 2 | 0 | 1 | 1 | 0 | 3 | 1 | 1 | 0 | 0 | 3 | 0 | 2 |
S14 | 0 | 2 | 1 | 1 | 1 | 1 | 0 | 1 | 1 | 1 | 1 | 2 | 1 | 0 | 2 | 0 | 1 | 1 | 1 | 1 | 1 | 1 | 1 | 0 | 1 | 0 | 0 |
S15 | 0 | 1 | 0 | 0 | 1 | 0 | 0 | 1 | 0 | 1 | 4 | 1 | 1 | 1 | 0 | 1 | 1 | 1 | 1 | 1 | 1 | 1 | 0 | 0 | 2 | 0 | 0 |
S16 | 0 | 1 | 0 | 0 | 2 | 1 | 0 | 3 | 0 | 2 | 1 | 0 | 0 | 1 | 1 | 0 | 1 | 1 | 1 | 1 | 4 | 1 | 1 | 0 | 1 | 0 | 0 |
S17 | 3 | 0 | 0 | 0 | 1 | 0 | 0 | 1 | 0 | 1 | 1 | 0 | 0 | 0 | 1 | 1 | 0 | 1 | 1 | 2 | 1 | 1 | 1 | 0 | 3 | 0 | 0 |
S18 | 0 | 0 | 1 | 0 | 1 | 1 | 1 | 1 | 0 | 1 | 1 | 0 | 0 | 1 | 1 | 1 | 1 | 0 | 1 | 1 | 1 | 1 | 2 | 0 | 1 | 1 | 2 |
S19 | 0 | 0 | 1 | 0 | 1 | 1 | 1 | 0 | 1 | 3 | 0 | 0 | 0 | 1 | 1 | 1 | 1 | 1 | 0 | 1 | 1 | 1 | 1 | 1 | 1 | 4 | 0 |
S20 | 2 | 3 | 0 | 0 | 3 | 1 | 3 | 0 | 4 | 1 | 0 | 0 | 0 | 0 | 0 | 0 | 0 | 1 | 1 | 0 | 1 | 1 | 1 | 1 | 1 | 1 | 0 |
S21 | 0 | 0 | 0 | 0 | 1 | 0 | 1 | 0 | 1 | 0 | 0 | 0 | 0 | 0 | 0 | 0 | 1 | 1 | 1 | 1 | 0 | 1 | 1 | 1 | 1 | 1 | 0 |
S22 | 0 | 0 | 2 | 1 | 1 | 0 | 1 | 0 | 1 | 0 | 0 | 0 | 0 | 0 | 0 | 0 | 0 | 1 | 0 | 1 | 1 | 0 | 1 | 1 | 2 | 2 | 0 |
S23 | 0 | 0 | 0 | 1 | 1 | 0 | 0 | 0 | 1 | 0 | 0 | 0 | 0 | 0 | 0 | 0 | 1 | 1 | 0 | 1 | 1 | 1 | 0 | 1 | 1 | 1 | 1 |
S24 | 1 | 0 | 0 | 1 | 1 | 0 | 1 | 0 | 1 | 0 | 0 | 0 | 0 | 0 | 0 | 0 | 1 | 1 | 0 | 0 | 1 | 1 | 1 | 0 | 1 | 1 | 1 |
S25 | 0 | 1 | 0 | 1 | 3 | 0 | 1 | 0 | 1 | 0 | 1 | 0 | 0 | 0 | 1 | 0 | 0 | 1 | 0 | 1 | 0 | 1 | 1 | 1 | 0 | 1 | 1 |
S26 | 1 | 1 | 0 | 1 | 1 | 0 | 1 | 0 | 1 | 0 | 1 | 1 | 0 | 1 | 1 | 0 | 1 | 1 | 1 | 1 | 1 | 1 | 1 | 1 | 1 | 0 | 1 |
S27 | 1 | 1 | 0 | 1 | 1 | 0 | 1 | 0 | 1 | 0 | 1 | 1 | 0 | 1 | 1 | 1 | 1 | 1 | 1 | 1 | 1 | 1 | 1 | 1 | 1 | 1 | 0 |
(2) Comprehensive Impact Matrix:
The direct impact matrix X is processed according to equation (1) to obtain the normalized direct impact matrix Y. Then, the comprehensive impact matrix Z is calculated based on equation (2).
\( Y=\frac{X}{max\sum _{j=1}^{n}{x_{ij}}} \) (1)
\( Z=Y{(I-Y)^{-1}} \) (2)
(3) Influence Degree, Affected Degree, Centrality, Causality:
The formulas for calculating the influence degree, affected degree, centrality, and causality of each factor are shown in equations (3), (4), (5), and (6), respectively. The influence degree is the sum of the values in each row of the comprehensive impact matrix, indicating the comprehensive influence of each row factor on all other factors. The affected degree is the sum of the values in each column of the comprehensive impact matrix, indicating the comprehensive influence of each column factor on all other factors. Centrality represents the magnitude of its role in the evaluation system, calculated as the sum of
influence degree and affected degree for each factor. Causality is calculated as the difference between the influence degree and affected degree of a factor. If the causality is greater than 0, it is a causal factor; if it is less than 0, it is a result factor. The calculation results are shown in Table 3.
\( {D_{i}}=\sum _{j=1}^{*}{z_{ij}} \) (i=1,2,3……*) (3)
\( {C_{i}}=\sum _{j=1}^{*}{z_{ji}} \) (i=1,2,3……*) (4)
\( {M_{i}}={D_{i}}+{C_{i}} \) (5)
\( {R_{i}}={D_{i}}-{C_{i}} \) (6)
Where \( {z_{ij}} \) (i=1,2,3……*) represents the elements in the i-th row of the comprehensive impact matrix, and \( {z_{ji}} \) (i=1,2,3……*) represents the elements in the i-th column of the comprehensive impact matrix.
Table 3: Analysis of DEMATEL Results for Each Influencing Factor
factor | influence degree | affected degree | centrality | causality | weight | ranking | factor attribute | |
S1 | 0.95742 | 1.06650 | 2.02392 | -0.10908 | 0.02775 | 26 | result factors | |
S2 | 0.25595 | 2.13051 | 2.38646 | -1.87456 | 0.03272 | 20 | result factors | |
S3 | 0.89023 | 1.61880 | 2.50903 | -0.72857 | 0.03440 | 17 | result factors | |
S4 | 0.79620 | 1.90103 | 2.69723 | -1.10483 | 0.03698 | 15 | result factors | |
S5 | 0.80590 | 2.24366 | 3.04956 | -1.43776 | 0.04181 | 8 | result factors | |
S6 | 1.01289 | 1.08681 | 2.09970 | -0.07392 | 0.02879 | 25 | result factors | |
S7 | 0.64230 | 1.63645 | 2.27875 | -0.99415 | 0.03124 | 23 | result factors | |
S8 | 1.52524 | 0.90929 | 2.43453 | 0.61595 | 0.03338 | 18 | cause factors | |
S9 | 0.26974 | 2.08298 | 2.35272 | -1.81324 | 0.03226 | 22 | result factors | |
S10 | 2.03679 | 1.11673 | 3.15352 | 0.92006 | 0.04323 | 4 | cause factors | |
S11 | 1.81489 | 1.16553 | 2.98042 | 0.64936 | 0.04086 | 10 | cause factors | |
S12 | 1.78010 | 1.07123 | 2.85133 | 0.70887 | 0.03909 | 12 | cause factors | |
S13 | 2.37028 | 0.69440 | 3.06468 | 1.67588 | 0.04202 | 7 | cause factors | |
S14 | 1.91389 | 1.08565 | 2.99954 | 0.82824 | 0.04112 | 9 | cause factors | |
S15 | 1.83807 | 1.28789 | 3.12596 | 0.55018 | 0.04286 | 5 | cause factors | |
S16 | 1.93834 | 0.46010 | 2.39844 | 1.47824 | 0.03288 | 19 | cause factors | |
S17 | 1.62901 | 1.12183 | 2.75084 | 0.50718 | 0.03771 | 14 | cause factors | |
S18 | 1.81791 | 1.40355 | 3.22146 | 0.41436 | 0.04417 | 3 | cause factors | |
S19 | 1.97111 | 1.1008 | 3.07191 | 0.87031 | 0.04212 | 6 | cause factors | |
S20 | 1.67023 | 1.62025 | 3.29048 | 0.04998 | 0.04511 | 1 | cause factors | |
S21 | 0.95268 | 1.31229 | 2.26497 | -0.35961 | 0.03105 | 24 | result factors | |
S22 | 1.11810 | 1.50358 | 2.62168 | -0.38548 | 0.03594 | 16 | result factors | |
S23 | 0.94904 | 1.41400 | 2.36304 | -0.46496 | 0.03240 | 21 | result factors | |
S24 | 0.98109 | 1.02265 | 2.00374 | -0.04156 | 0.02747 | 27 | result factors | |
S25 | 1.21046 | 2.04606 | 3.25652 | -0.83560 | 0.04465 | 2 | result factors | |
S26 | 1.61020 | 1.30768 | 2.91788 | 0.30252 | 0.04000 | 11 | cause factors | |
S27 | 1.71152 | 1.05933 | 2.77085 | 0.65219 | 0.03799 | 13 | cause factors | |
(4) Causal Diagram:
Based on the results shown in Figure 2, a causal diagram of the influencing factors of green building is constructed, with centrality as the horizontal axis and causality as the vertical axis.
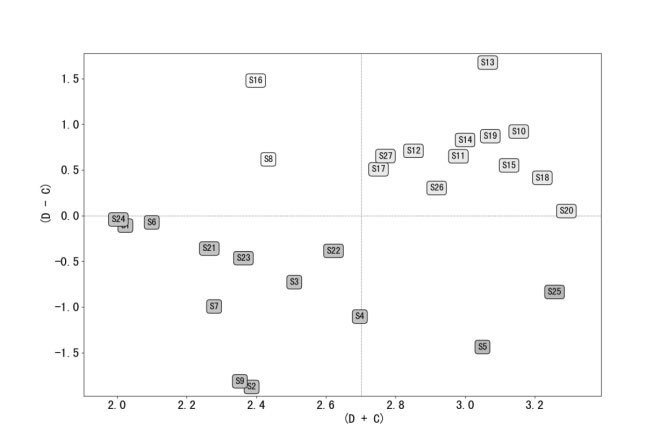
Figure 2: Causal Relationship Diagram of Influencing Factors
4.2.2. ISM Method. (1) Overall Impact Matrix and Reachable Matrix
Introducing the identity matrix I, the overall impact matrix E is obtained by adding the identity matrix I to the comprehensive impact matrix Z. The threshold value λ is determined based on the overall impact matrix E, which can eliminate factors with relatively small degrees of influence. According to equation (8), the reachable matrix F is calculated. The calculation results are shown in Table 4.
\( E=I+Z \) (7)
\( {f_{ij}}=\begin{cases}{0,e_{ij}} \lt λ \\ 1,{e_{ij}}≥λ\end{cases} \) (8)
Table 4: Reachable Matrix
influencing factors | S1 | S2 | S3 | S4 | S5 | S6 | S7 | S8 | S9 | S10 | S11 | S12 | S13 | S14 | S15 | S16 | S17 | S18 | S19 | S20 | S21 | S22 | S23 | S24 | S25 | S26 | S27 |
S1 | 1 | 1 | 1 | 1 | 1 | 1 | 1 | 1 | 1 | 0 | 0 | 0 | 0 | 0 | 0 | 0 | 0 | 0 | 0 | 0 | 0 | 0 | 0 | 0 | 0 | 0 | 0 |
S2 | 0 | 1 | 0 | 0 | 0 | 0 | 0 | 0 | 0 | 0 | 0 | 0 | 0 | 0 | 0 | 0 | 0 | 0 | 0 | 0 | 0 | 0 | 0 | 0 | 0 | 0 | 0 |
S3 | 0 | 1 | 1 | 1 | 0 | 0 | 1 | 0 | 1 | 0 | 0 | 0 | 0 | 0 | 1 | 0 | 0 | 0 | 0 | 1 | 0 | 0 | 1 | 0 | 0 | 0 | 1 |
S4 | 0 | 1 | 1 | 1 | 0 | 0 | 0 | 0 | 1 | 0 | 0 | 1 | 0 | 0 | 0 | 0 | 0 | 0 | 0 | 0 | 0 | 1 | 0 | 0 | 1 | 0 | 0 |
S5 | 0 | 1 | 1 | 1 | 1 | 0 | 0 | 0 | 1 | 0 | 0 | 0 | 0 | 1 | 0 | 0 | 0 | 0 | 0 | 0 | 0 | 0 | 1 | 0 | 0 | 0 | 0 |
S6 | 0 | 1 | 1 | 1 | 1 | 1 | 1 | 0 | 1 | 0 | 0 | 0 | 0 | 0 | 0 | 0 | 0 | 0 | 0 | 0 | 0 | 0 | 0 | 0 | 1 | 0 | 0 |
S7 | 0 | 1 | 1 | 1 | 0 | 0 | 1 | 0 | 1 | 0 | 0 | 1 | 0 | 0 | 0 | 0 | 0 | 0 | 0 | 0 | 0 | 0 | 0 | 0 | 0 | 0 | 0 |
S8 | 1 | 1 | 1 | 1 | 1 | 1 | 1 | 1 | 1 | 0 | 0 | 0 | 0 | 0 | 1 | 0 | 1 | 1 | 1 | 0 | 0 | 1 | 0 | 0 | 0 | 0 | 1 |
S9 | 0 | 0 | 0 | 0 | 0 | 0 | 0 | 0 | 1 | 0 | 0 | 0 | 0 | 0 | 0 | 0 | 0 | 0 | 0 | 0 | 0 | 0 | 0 | 0 | 0 | 0 | 0 |
S10 | 1 | 1 | 1 | 1 | 1 | 1 | 1 | 1 | 1 | 1 | 1 | 1 | 1 | 1 | 0 | 0 | 1 | 1 | 1 | 1 | 1 | 1 | 1 | 1 | 1 | 0 | 0 |
S11 | 1 | 1 | 0 | 1 | 1 | 1 | 1 | 1 | 1 | 1 | 1 | 1 | 1 | 1 | 1 | 0 | 1 | 1 | 1 | 1 | 1 | 1 | 1 | 1 | 1 | 0 | 0 |
S12 | 1 | 1 | 1 | 1 | 1 | 1 | 0 | 1 | 1 | 1 | 1 | 1 | 1 | 1 | 1 | 0 | 1 | 1 | 1 | 1 | 0 | 1 | 0 | 0 | 1 | 0 | 0 |
S13 | 1 | 1 | 1 | 1 | 1 | 1 | 1 | 1 | 1 | 1 | 1 | 1 | 1 | 1 | 1 | 0 | 1 | 1 | 0 | 1 | 1 | 1 | 1 | 0 | 1 | 0 | 1 |
S14 | 0 | 1 | 1 | 1 | 1 | 1 | 0 | 1 | 1 | 1 | 1 | 1 | 1 | 1 | 1 | 0 | 1 | 1 | 1 | 1 | 1 | 1 | 1 | 0 | 1 | 0 | 0 |
S15 | 0 | 1 | 0 | 1 | 1 | 0 | 0 | 1 | 1 | 1 | 1 | 1 | 1 | 1 | 1 | 0 | 1 | 1 | 1 | 1 | 1 | 1 | 0 | 0 | 1 | 0 | 0 |
S16 | 0 | 1 | 0 | 1 | 1 | 1 | 1 | 1 | 1 | 1 | 1 | 0 | 0 | 1 | 1 | 1 | 1 | 1 | 1 | 1 | 1 | 1 | 1 | 0 | 1 | 0 | 0 |
S17 | 1 | 1 | 0 | 0 | 1 | 0 | 1 | 1 | 1 | 1 | 1 | 0 | 0 | 0 | 1 | 0 | 1 | 1 | 1 | 1 | 1 | 1 | 1 | 0 | 1 | 0 | 0 |
S18 | 0 | 1 | 1 | 1 | 1 | 1 | 1 | 1 | 1 | 1 | 1 | 0 | 0 | 1 | 1 | 1 | 1 | 1 | 1 | 1 | 1 | 1 | 1 | 0 | 1 | 1 | 1 |
S19 | 0 | 1 | 1 | 1 | 1 | 1 | 1 | 0 | 1 | 1 | 0 | 0 | 0 | 1 | 1 | 0 | 1 | 1 | 1 | 1 | 1 | 1 | 1 | 1 | 1 | 1 | 0 |
S20 | 1 | 1 | 1 | 1 | 1 | 1 | 1 | 0 | 1 | 1 | 0 | 0 | 0 | 0 | 0 | 0 | 0 | 1 | 1 | 1 | 1 | 1 | 1 | 1 | 1 | 1 | 0 |
S21 | 0 | 0 | 0 | 0 | 1 | 0 | 1 | 0 | 1 | 0 | 0 | 0 | 0 | 0 | 0 | 0 | 1 | 1 | 0 | 1 | 1 | 1 | 1 | 1 | 1 | 1 | 0 |
S22 | 0 | 0 | 1 | 1 | 1 | 0 | 1 | 0 | 1 | 0 | 0 | 0 | 0 | 0 | 0 | 0 | 0 | 1 | 0 | 1 | 1 | 1 | 1 | 1 | 1 | 1 | 0 |
S23 | 0 | 0 | 0 | 1 | 1 | 0 | 0 | 0 | 1 | 0 | 0 | 0 | 0 | 0 | 0 | 0 | 1 | 1 | 0 | 1 | 1 | 1 | 1 | 1 | 1 | 1 | 1 |
S24 | 0 | 0 | 0 | 1 | 1 | 0 | 1 | 0 | 1 | 0 | 0 | 0 | 0 | 0 | 0 | 0 | 1 | 1 | 0 | 0 | 1 | 1 | 1 | 1 | 1 | 1 | 1 |
S25 | 0 | 1 | 0 | 1 | 1 | 0 | 1 | 0 | 1 | 0 | 1 | 0 | 0 | 0 | 1 | 0 | 0 | 1 | 0 | 1 | 0 | 1 | 1 | 1 | 1 | 1 | 1 |
S26 | 1 | 1 | 0 | 1 | 1 | 0 | 1 | 0 | 1 | 0 | 1 | 1 | 0 | 1 | 1 | 0 | 1 | 1 | 1 | 1 | 1 | 1 | 1 | 1 | 1 | 1 | 1 |
S27 | 1 | 1 | 0 | 1 | 1 | 0 | 1 | 0 | 1 | 0 | 1 | 1 | 0 | 1 | 1 | 0 | 1 | 1 | 1 | 1 | 1 | 1 | 1 | 1 | 1 | 1 | 1 |
(2) Hierarchy Division:
Determine the reachable set, antecedent set, and intersection. The reachable set represents the set of other elements in the system that it can influence, while the antecedent set represents the set of other elements in the system that can influence it. The hierarchical table of influencing factors is shown in Table 5, and the hierarchical diagram is depicted in Figure 3.
Table 5: Hierarchy of Influencing Factors
levels | elements |
1 | S2, S9 |
2 | S12, S22, S25, S3, S4 |
3 | S14, S17, S18, S20, S21, S23, S24, S26, S27, S5, S7 |
4 | S11, S15, S6 |
5 | S1, S10, S16, S19, S8 |
6 | S13 |
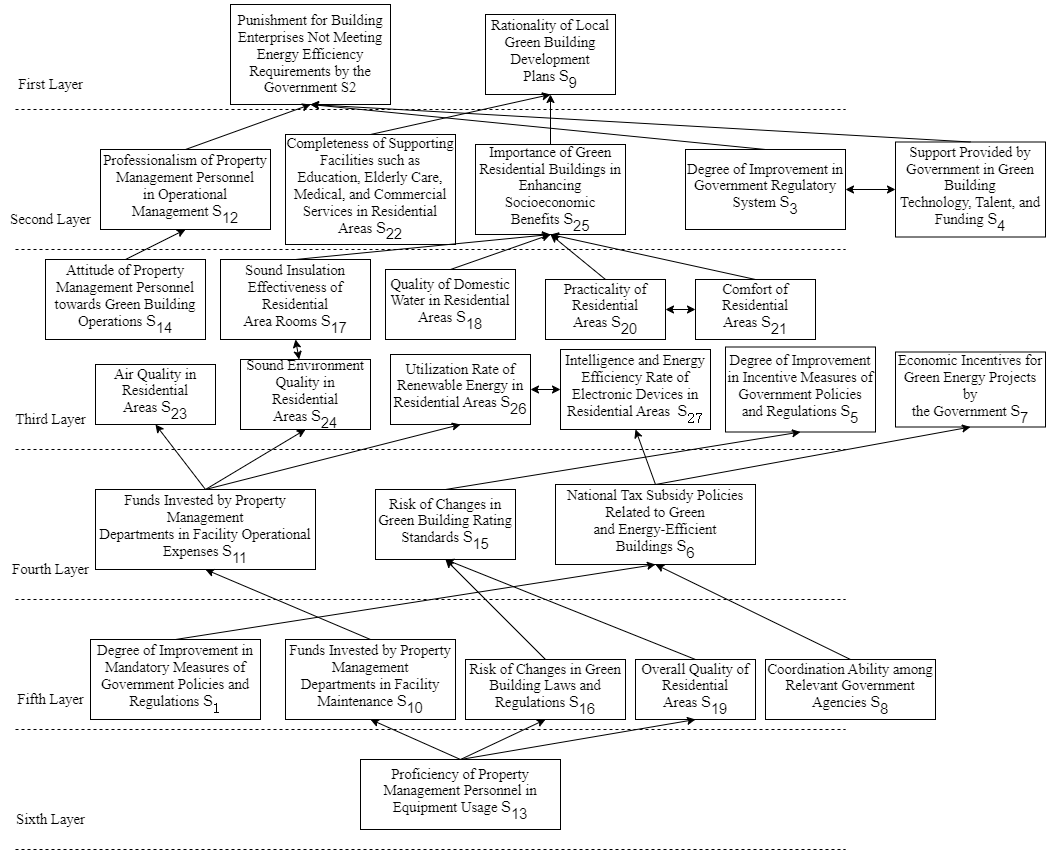
Figure 3: Hierarchical Relationship Diagram of Influencing Factors
4.3. Model Data Analysis
4.3.1. DEMATEL Model Data Analysis.
(1) Influence Degree:
The top three influencing factors in terms of influence degree are the proficiency of property management personnel in equipment usage (S13), the funds invested by property management departments in facility maintenance (S10), and the overall quality of residential areas (S19). This indicates that these three factors have a significant impact on other factors. The first two factors are related to property management, highlighting the significant influence of property management in the development of green building operation phase. It also suggests that consumers prioritize subjective experiences, as the overall quality of residential areas affects the development of the market for green building operation.
(2) Affected Degree:
The top three influencing factors in terms of affected degree are the degree of improvement in incentive measures of government policies and regulations (S5), the punishment for building enterprises not meeting energy efficiency requirements by the government (S2), and the rationality of local green building development plans (S9). This indicates that these factors are greatly influenced by other factors. When analyzing them, consideration should be given to the influence of other factors on government policy implementation. Governments may amend laws and regulations based on changes in the market, environment, and industry.
(3) Centrality and Causality:
The top three factors in terms of centrality are the practicality of residential areas (S20), the importance of green residential buildings in enhancing socioeconomic benefits (S25), and the quality of domestic water in residential areas (S18). These three factors have a significant impact on the operational phase of green building, as they focus on consumers’ subjective experiences in green building operation. Both the practicality of residential areas (S20) and the quality of domestic water in residential areas (S18) are causal factors, meaning they have a significant impact on other factors.
4.3.2. ISM Model Data Analysis.
(1) Surface Layer:
The surface layer consists of two factors: the punishment for building enterprises not meeting energy efficiency requirements by the government (S2) and the rationality of local green building development plans (S9). These two factors are direct influencing factors, indicating that government punishment measures and city planning directly affect the development of green building operation, and can directly alleviate issues in the operational phase.
(2) Middle Layer:
The middle layer spans from the second to the fifth layer and comprises indirect influencing factors. Among them, the degree of improvement in government regulatory system (S3) and the support provided by government in green building technology, talent, and funding (S4) are closely linked and influence the surface layer factors. Proficient property management personnel can significantly reduce costs in the operational phase, while improved supporting facilities in residential areas can enhance consumer satisfaction, but they also increase the difficulty of regulatory control in the operational phase.
(3) Bottom Layer:
The bottom layer includes one factor: the proficiency of property management personnel in equipment usage (S13). It is a fundamental influencing factor that can directly affect the operation of green buildings and regulate the operational phase through indirect factors. Starting from S13, effective control of the entire operational phase can be achieved.
4.3.3. DEMATEL-ISM Model Data Analysis.
The proficiency of property management personnel in equipment usage (S13), the funds invested by property management departments in facility maintenance (S10), and the overall quality of residential areas (S19) are both fundamental influencing factors and causal factors with high centrality rankings. They can effectively influence other indirect or direct factors. The degree of improvement in incentive measures of government policies and regulations (S5), the punishment for building enterprises not meeting energy efficiency requirements by the government (S2), and the rationality of local green building development plans (S9) are direct influencing factors. They are also result factors and are susceptible to the influence of other factors. The practicality of residential areas (S20) ranks first in centrality in the middle layer and also serves as a causal factor influencing the development of the operational phase of green building.
4.4. Strategies and Recommendations
4.4.1. Government Perspective.
The government needs to improve relevant mandatory and incentive laws and regulations and reasonably utilize punishment and reward mechanisms. Different tax policies can be adopted for green buildings of different star ratings to enhance building operation levels. Additionally, the government should provide funding, technology, and talent for the construction profession and increase the training of professional talents, which will make operations more efficient. Internal coordination within government agencies needs to be strengthened, with all departments coordinating and planning green building construction together.
4.4.2. Property Management Perspective.
Property management departments need to adhere to dedicated funds and increase the amount of funds invested in facility maintenance and operational expenses. Adequate funding can greatly improve operational difficulties. Furthermore, it is necessary to strengthen the training of property management personnel. Property management personnel should have sufficient professional knowledge and be proficient in using advanced equipment during the operational phase. At the same time, property managers need to understand the significance of green buildings and increase their sense of identity. Property management personnel also need to be familiar with relevant laws and regulations related to green buildings and pay attention to their update rates.
4.4.3. Consumer Perspective.
Consumers pay more attention to the subjective experience of residential areas. Improving the quality of the environment inside and outside residential areas can greatly enhance consumers’ sense of acquisition. Consumers’ sense of acquisition is conducive to the development of the operational market, increasing the audience of the operational market and reducing its costs. Therefore, efforts should be made to improve the quality of the environment inside and outside residential areas and supporting facilities.
5. Conclusion
Against the backdrop of global efforts to reduce emissions, the development of green buildings is an unstoppable trend. Meanwhile, the operational phase accounts for a relatively long span in the entire lifecycle of green buildings, and starting from the operational phase can effectively reduce emissions. This paper analyzes from the perspectives of government, property management, and consumers, and through extensive literature research, questionnaire surveys, and the construction of DEMATEL-ISM models, it summarizes the main factors influencing the operation of green buildings, categorizing them into six layers, and proposes strategies and recommendations for each factor, laying the foundation for subsequent development.
References
[1]. China Building Energy Conservation Association Building Energy Consumption and Carbon Emission Data Special Committee. (2022). Research Report on Building Energy Consumption and Carbon Emission in China. Chongqing, China: China Building Energy Conservation Association.
[2]. Xinhua News Agency. (2021, October 27). China’s Policies and Actions to Address Climate Change. Retrieved December 12, 2023, from https://www.gov.cn/zhengce/2021-10/27/content_5646697.htm.
[3]. Liu, Z., Qiu, B., & Zheng, S. (2023). China’s Urbanization Path under the “Dual Carbon” Goals: Cutting-edge Thinking. Urban Observation, 2023(01), 35-52+156.
[4]. Li, X. (2022). Evolutionary Game Analysis of Green Building Development Dynamic System under Government Regulation: From the Perspective of the Contractor[J]. Mathematical Problems in Engineering, 2022.
[5]. Liu, G., & Xie, Y. (2023). Research on the Evolutionary Game of Consumer Purchase Intention of Green Buildings under Government Information Disclosure Mechanism. Science and Technology and Economy, 36(05), 106-110. DOI: 10.14059/j.cnki.cn32-1276n.2023.05.022.
[6]. Liang, X., & Fu, Y. (2021). Research on the Evolutionary Game of Green Building Supply Side under the Dynamic Reward and Punishment Mechanism of Government. China Management Science, 29(02), 184-194. DOI: 10.16381/j.cnki.issn1003-207x.2018.0917.
[7]. Wang, B., Liao, F., & Zhang, J. (2021). Evolutionary Game Model and Simulation of Key Subjects in Green Building Development. Techno-economic and Management Research, 2021(07), 109-114.
[8]. Liu, G., & Fu, Y. (2022). Research on Innovative Paths and Strategies of Green Building Operation Management under the Background of Carbon Neutrality. Building Economy, 43(04), 98-104.
[9]. He, W., & Zhou, Bai. (2021). Analysis of the status quo of green building operation management and countermeasures[J]. IOP Conference Series: Earth and Environmental Science, 2021, 632(5):052105-.
[10]. Vyas, G. S., Jha, K. N., Rajhans, N. R., et al. (2019). Identifying and Evaluating Green Building Attributes by Environment, Social, and Economic Pillars of Sustainability. Civil Engineering and Environmental Systems, 36(24), 133-148.
[11]. Hong, X. (2021). Evaluation of Green Building Operation Effectiveness Based on Grey Fuzzy Evaluation Model. Journal of Engineering Management, 35(6), 13-18.
[12]. Thuy Thi Thu Nguyen, Michael Waibel. (2023). Promoting Urban Health through the Green Building Movement in Vietnam: An Intersectoral Perspective[J]. Sustainability, 2023, 15(13).
[13]. Liu, Y., Shi, X., Wang, Y. P., et al. (2019). Promoting Green Residential Buildings in China: Bridging the Gap between Design and Operation to Improve Occupants’ Residential Satisfaction. Sustainability, 11(13), 3590-3590.
[14]. Wang, B., Wen, H., & Zhang, W. (2019). Dynamic Game of Key Subjects in the Development of Green Buildings - From the Perspective of Supply-side Structural Reform. Science and Technology Review, 37(08), 88-96.
[15]. Yao, Y., & Jia, R. (2023). Study on Incremental Cost Impact Factors of Green Buildings Based on DEMATEL-ISM. Journal of Engineering Management, 37(04), 37-41. DOI: 10.13991/j.cnki.jem.2023.04.007.
[16]. Pan, X. S., & Liu, W. C. (2023). Study on the Cost Impact Factors of Prefabricated Buildings Based on DEMATEL-ISM Model. Journal of Liaoning University of Technology (Social Science Edition), 25(04), 37-43. DOI: 10.15916/j.issn1674-327x.2023.04.010.
Cite this article
Zhou,Y. (2024). Research on the influencing factors of green building operation based on DEMATEL-ISM. Advances in Operation Research and Production Management,2,1-9.
Data availability
The datasets used and/or analyzed during the current study will be available from the authors upon reasonable request.
Disclaimer/Publisher's Note
The statements, opinions and data contained in all publications are solely those of the individual author(s) and contributor(s) and not of EWA Publishing and/or the editor(s). EWA Publishing and/or the editor(s) disclaim responsibility for any injury to people or property resulting from any ideas, methods, instructions or products referred to in the content.
About volume
Journal:Advances in Operation Research and Production Management
© 2024 by the author(s). Licensee EWA Publishing, Oxford, UK. This article is an open access article distributed under the terms and
conditions of the Creative Commons Attribution (CC BY) license. Authors who
publish this series agree to the following terms:
1. Authors retain copyright and grant the series right of first publication with the work simultaneously licensed under a Creative Commons
Attribution License that allows others to share the work with an acknowledgment of the work's authorship and initial publication in this
series.
2. Authors are able to enter into separate, additional contractual arrangements for the non-exclusive distribution of the series's published
version of the work (e.g., post it to an institutional repository or publish it in a book), with an acknowledgment of its initial
publication in this series.
3. Authors are permitted and encouraged to post their work online (e.g., in institutional repositories or on their website) prior to and
during the submission process, as it can lead to productive exchanges, as well as earlier and greater citation of published work (See
Open access policy for details).
References
[1]. China Building Energy Conservation Association Building Energy Consumption and Carbon Emission Data Special Committee. (2022). Research Report on Building Energy Consumption and Carbon Emission in China. Chongqing, China: China Building Energy Conservation Association.
[2]. Xinhua News Agency. (2021, October 27). China’s Policies and Actions to Address Climate Change. Retrieved December 12, 2023, from https://www.gov.cn/zhengce/2021-10/27/content_5646697.htm.
[3]. Liu, Z., Qiu, B., & Zheng, S. (2023). China’s Urbanization Path under the “Dual Carbon” Goals: Cutting-edge Thinking. Urban Observation, 2023(01), 35-52+156.
[4]. Li, X. (2022). Evolutionary Game Analysis of Green Building Development Dynamic System under Government Regulation: From the Perspective of the Contractor[J]. Mathematical Problems in Engineering, 2022.
[5]. Liu, G., & Xie, Y. (2023). Research on the Evolutionary Game of Consumer Purchase Intention of Green Buildings under Government Information Disclosure Mechanism. Science and Technology and Economy, 36(05), 106-110. DOI: 10.14059/j.cnki.cn32-1276n.2023.05.022.
[6]. Liang, X., & Fu, Y. (2021). Research on the Evolutionary Game of Green Building Supply Side under the Dynamic Reward and Punishment Mechanism of Government. China Management Science, 29(02), 184-194. DOI: 10.16381/j.cnki.issn1003-207x.2018.0917.
[7]. Wang, B., Liao, F., & Zhang, J. (2021). Evolutionary Game Model and Simulation of Key Subjects in Green Building Development. Techno-economic and Management Research, 2021(07), 109-114.
[8]. Liu, G., & Fu, Y. (2022). Research on Innovative Paths and Strategies of Green Building Operation Management under the Background of Carbon Neutrality. Building Economy, 43(04), 98-104.
[9]. He, W., & Zhou, Bai. (2021). Analysis of the status quo of green building operation management and countermeasures[J]. IOP Conference Series: Earth and Environmental Science, 2021, 632(5):052105-.
[10]. Vyas, G. S., Jha, K. N., Rajhans, N. R., et al. (2019). Identifying and Evaluating Green Building Attributes by Environment, Social, and Economic Pillars of Sustainability. Civil Engineering and Environmental Systems, 36(24), 133-148.
[11]. Hong, X. (2021). Evaluation of Green Building Operation Effectiveness Based on Grey Fuzzy Evaluation Model. Journal of Engineering Management, 35(6), 13-18.
[12]. Thuy Thi Thu Nguyen, Michael Waibel. (2023). Promoting Urban Health through the Green Building Movement in Vietnam: An Intersectoral Perspective[J]. Sustainability, 2023, 15(13).
[13]. Liu, Y., Shi, X., Wang, Y. P., et al. (2019). Promoting Green Residential Buildings in China: Bridging the Gap between Design and Operation to Improve Occupants’ Residential Satisfaction. Sustainability, 11(13), 3590-3590.
[14]. Wang, B., Wen, H., & Zhang, W. (2019). Dynamic Game of Key Subjects in the Development of Green Buildings - From the Perspective of Supply-side Structural Reform. Science and Technology Review, 37(08), 88-96.
[15]. Yao, Y., & Jia, R. (2023). Study on Incremental Cost Impact Factors of Green Buildings Based on DEMATEL-ISM. Journal of Engineering Management, 37(04), 37-41. DOI: 10.13991/j.cnki.jem.2023.04.007.
[16]. Pan, X. S., & Liu, W. C. (2023). Study on the Cost Impact Factors of Prefabricated Buildings Based on DEMATEL-ISM Model. Journal of Liaoning University of Technology (Social Science Edition), 25(04), 37-43. DOI: 10.15916/j.issn1674-327x.2023.04.010.