


1. Introduction
The Olympic Games is one of the most prominent global sporting events, encompassing a diverse array of disciplines that test both individual excellence and collective performance. The distinction between team and individual events offers a unique lens for examining national sports strategies, institutional priorities, and resource allocation mechanisms. For policymakers, sports federations, and scholars, understanding these patterns is crucial for interpreting competitive outcomes and guiding strategic investments in elite sports programmes.
Previous research has addressed various determinants of Olympic success, including economic resources, population size, host nation advantages, and sociocultural factors [1, 2]. However, the specific structural differences between team and individual events have received limited attention. Most existing analyses focus on aggregated medal counts or single-sport case studies, which often overlook comparative structures, temporal dynamics, and strategic archetypes. As highlighted in recent visual analytics studies [3, 4], incorporating both structural and temporal perspectives can reveal nuanced performance patterns that traditional statistical summaries fail to capture.
This study addresses this gap by applying a visual analytics framework to examine over 120 years of Olympic medal data. We employ three complementary analytical perspectives:
Structural comparison—contrasting national medal distributions between team and individual events;
Pattern clustering—identifying archetypes of team-event success using Principal Component Analysis (PCA) and K-means clustering;
Temporal evolution—tracing shifts in a single nation's (Australia) team-event focus over time.
The primary contributions of this work are:
Introducing a comparative visual analytics methodology for Olympic performance analysis;
Revealing strategic archetypes in team-event success;
Demonstrating temporal adaptability in national sports strategies.
This research advances the understanding of Olympic performance structures and provides a methodological foundation for future comparative studies [5-7].
2. Related work
2.1. Determinants of Olympic performance
Extensive research has investigated macro-level factors influencing Olympic success. Economic capacity, population size, and political stability have consistently emerged as strong predictors of medal counts [1]. Strategic investment in elite sports infrastructure and athlete development systems is also recognized as a critical driver of sustained competitiveness [2]. Temporal analyses further suggest that nations adapt their performance profiles across Olympic cycles in response to shifting domestic priorities and international competition [6].
2.2. Visual analytics in sports
In recent years, visual analytics has become an increasingly prominent tool for sports performance research. Interactive visualization platforms have been developed to explore trends and patterns in multi-dimensional competition data [3, 8]. Network-based visualization techniques have revealed structural connections between sports disciplines and highlighted the interdependencies within sports systems [7]. These approaches enhance interpretability by allowing researchers to uncover relationships that traditional statistical summaries may overlook.
2.3. Clustering and dimensionality reduction in sports analytics
Advanced analytical techniques, including Principal Component Analysis (PCA) and clustering algorithms, have been widely applied to sports datasets to identify performance archetypes and similarities among nations [4, 9]. K-means clustering, in particular, has shown effectiveness in grouping nations with comparable medal structures, offering insights into underlying competitive strategies. Such methods align closely with the analytical approach in this study, where dimensionality reduction is integrated with unsupervised learning to uncover latent performance structures.
2.4. Gaps in existing research
While prior studies have addressed the determinants of Olympic performance and adopted advanced analytical methods, several key gaps remain.
First, the majority of research aggregates all medal results, treating them as a single metric and overlooking the structural differences between team and individual events. This aggregation obscures potential trade-offs that nations make between fostering collective performance and individual excellence.
Second, many clustering and network-based analyses focus on a single Olympic edition or a limited range of sports, which restricts the ability to detect long-term strategic trends [7, 9].
Third, few studies integrate structural, temporal, and clustering perspectives into a unified framework, resulting in fragmented findings that fail to capture the multi-dimensional evolution of national strategies under varying institutional and competitive conditions.
This study addresses these gaps by introducing an integrated visual analytics framework that simultaneously examines structural differences between team and individual events, identifies archetypes of team-event success, and analyses the temporal evolution of national strategies across more than a century of Olympic history.
3. Data and methods
3.1. Dataset description
This study utilizes the 126 Years of Historical Olympic Dataset compiled from official Olympic records, covering the period from the 1896 Athens Games to the 2020 Tokyo Games. The primary file used, Olympic_Athlete_Event_Details.csv, contains approximately 270,000 entries, each representing an athlete's participation in a specific Olympic event. Key attributes include athlete demographics (name, gender, age, height, weight), team and country information (team name, NOC code), event metadata (Olympic edition, host city, sport, event), medal outcomes (Gold, Silver, Bronze, or None), and a Boolean variable (isTeamSport) indicating whether the event is team-based.
The research focuses on the comparative dimension of team events versus individual events, selected for two main reasons:
(1) the distinction is explicitly encoded in the dataset via the isTeamSport variable, enabling clear classification; and
(2) this dimension reflects deeper systemic differences in national sports strategies, including resource allocation, training pathways, and institutional priorities.
Three visualization-based analytical components were developed:
The first contrasts national medal distributions between team and individual events (structural comparison).
The second presents a PCA-k-means clustering of team-event gold-medal structures (pattern clustering).
The third depicts temporal trends in Australia’s team-event medals; an animated version is provided as Supplementary Video 1 (time-evolution analysis).
3.2. Data processing
To support the analysis in medal distribution in team vs individual events (top 20 countries), a high-dimensional subset was extracted and constructed to compare medal distributions between team and individual events.
Data Source:
Historical Olympic dataset [Olympic_Athlete_Event_Details] (Kaggle)
Field Selection and Processing Logic:
First, all records with awarded medals were filtered and retained.
The data was then grouped by three dimensions: country_noc (country), isTeamSport (team vs individual), and medal (medal type).
Grouped results were pivoted into a wide-format table where each row represents a country-event type pair, with columns indicating the number of gold, silver, and bronze medals.
Finally, medal counts for team events (TRUE) and individual events (FALSE) were merged into a single table, allowing the total medals per country across both event types to be compared.
The final dataset, medal_distribution_by_country_and_type.csv, contains the number of gold, silver, and bronze medals for each country, separately recorded for team (isTeamSport = TRUE) and individual (isTeamSport = False) events.
|
Original Field |
Transformation |
Purpose |
|
|
isTeamSport |
Boolean split into columns |
To compare team and individual structures separately |
|
|
medal |
One-hot encoding |
To count the number of gold, silver, and bronze medals |
|
|
total_medals |
Field aggregation |
To create a unified metric for ranking and comparison |
|
To support the clustering analysis in cluster analysis of countries by team event gold medal structure, gold medal structure information of the team events was extracted from the Olympic dataset and constructed a national × event matrix for subsequent dimensionality reduction and clustering, Table 1 shows the key field conversion of the structural comparison.
Data Source:
Historical Olympic dataset [Olympic_Athlete_Event_Details] (Kaggle)
Field Selection and Processing Logic:
First, we filtered out all team event records that had won a gold medal in the modern Olympic era (edition_id ≥ 20), specifically those where both isTeamSport = TRUE and medal = "Gold". Then, we counted the number of gold medals by country and sport, and retained only events with medal distributions in at least five countries, as well as countries that had won gold medals in at least two different events, to ensure the representativeness and stability of the structural analysis.
Based on this, we constructed a structural matrix of "country × event", where each matrix element represented the number of gold medals a country had won in a given team event. Missing values were filled with 0. This matrix was then used to represent the structural characteristics of national gold medal distributions. After standardization, we applied PCA to reduce the dimensionality to two components and then performed K-means clustering (k = 4) in the PCA space to identify groups of countries with similar structural patterns.
The resulting structure matrix is filtered_grouped_gold_counts.csv, where each row records the gold medal structure of a country in a team event for subsequent visualization and clustering, the key field conversion of the pattern clustering is shown in Table 2 .
|
Original Field |
Transformation |
Purpose |
|
|
isTeamSport |
Boolean filter (keep only TRUE) |
Restrict the analysis scope to team events |
|
|
medal |
Filtered to "Gold" |
Retain gold medals to represent top-level performance and reduce noise |
|
|
event |
Pivoted as column names |
Construct a country-event matrix for structural analysis |
|
|
gold_count |
Event frequency count |
Represent the strength of a country's contribution in each event |
|
|
country_noc |
Set as row index |
Used to build country-level structural feature vectors |
|
The following shows the data process of the medal trend in selected team events in Australia.
Data Source:
Historical Olympic dataset [Olympic_Athlete_Event_Details] (Kaggle)
Field Selection and Processing Logic:
All records were first filtered to retain only medal-winning entries in team sports where the athlete represented Australia.
The data was then grouped by two dimensions: year and event, in order to analyse the country's performance in specific team events over time.
To enhance interpretability, only events that met both of the following thresholds were retained: A total medal count of at least 5; and appearances in at least 7 distinct Olympic years (with medals).
The final dataset, AUS_Selected_TeamEvents_MedalTrend.csv, contains the annual medal counts for each selected team event in which Australia participated successfully. This dataset was visualized using Tableau as an animated bar chart where each frame corresponds to one Olympic year, Table 3 listed key field conversion of the temporal evolution video.
Key Field Conversion:
|
Original Field |
Transformation |
Purpose |
|
country_noc |
Filtered to "AUS" |
Limit analysis scope to Australia's performance only |
|
isTeamSport |
Boolean filter (TRUE only) |
Restrict to team events |
|
medal |
Filtered to non-null values |
Include only medal-winning records |
|
edition |
Extracted 4-digit year using regex |
Generate a numeric year variable for timeline analysis |
|
event |
Used as category label |
Identify the type of team event |
|
grouped count |
.groupby(['year', 'event']).size() |
Calculate number of medals per event per year |
|
medal_count |
Assigned after aggregation |
Used as height (Y-axis) in bar chart animation |
|
filtered events |
Events with ≥ 5 medals and ≥ 7 active years |
Ensure significance and continuity of selected events |
3.3. Analysis
The analysis of the structural comparison figure focuses on the comparison of medal performance of countries in team events and individual events to reveal the tendency of different countries in the type of events.
The main analysis methods used include:
• Proportion analysis: The total number of medals won by each country in team events and individual events was calculated by drawing a symmetric bar chart.
• Ranking comparison: Ranking countries according to the total number of medals, highlighting the major medal winners.
• Structural comparison index: The "team proportion" index is introduced, which is defined as follows:
This index reflects the structural proportion of a country's investment in two types of projects and assists in identifying its sports development bias.
The analysis in the pattern clustering figure focuses on the differences in the distribution of Olympic team event gold medal structure among different countries, aiming to reveal the similarities or differences in event layout and sports strategy among countries through a structured approach.
This figure mainly uses the following analysis methods:
• Structural vector modelling: A "country × event" matrix is constructed based on the number of gold medals won by each country in team events, with each row representing the structural features of a country.
• Principal component analysis: The structure matrix is standardized and reduced to two dimensions so that countries with similar structures are brought closer together in the graph, facilitating the identification of clustering trends.
• Cluster analysis: The K-means algorithm (k = 4) is applied in the principal component space to divide the country clusters with similar structure, revealing the gold medal distribution patterns such as "centralized" and "balanced".
• Explanation of structural differences: Combined with cluster distribution and country location, the differences in sports system structure, programme preference and development strategy were analysed.
This analytical approach not only reveals structural differences in medals in team events but also provides a means of visualization to help identify the strategic tendencies of countries in the allocation of sports resources and the layout of events. The obtained clustering results provide a structural basis for subsequent comparative studies on national sports systems, development models and project distribution mechanisms.
The temporal evolution figure aims to analyse the changing trend of Australia's medal performance in the main team events of the Olympic Games over time, focusing on the changes in the performance intensity of different events in each Olympic Games. This figure mainly adopts the following analysis methods:
• Project time series modelling: Based on the number of medals Australia wins in each team event each year, a dynamic distribution matrix at the "event × year" level is constructed to observe the performance trends that change with the years.
• Dynamic visualization playback: Utilizing Tableau's animation capabilities, with each year as the playback frame, a bar chart evolution process of the number of medals won by major team events each year is generated, highlighting the performance fluctuations and strategic changes among the events.
• Structural trend interpretation: By observing the bar charts of consecutive years, the long-term strong performance of some events such as "hockey, men" and " 4 × 100 metres medley relay, women" can be identified.
• Strategy evolution analysis: By combining the year distribution, project categories, and medal fluctuations, the possible key investment directions, resource inclination changes, and project layout evolution logic of Australia in team events can be further explored.
The dynamic evolution perspective presented in this chart not only visually reveals Australia's competitive focus and development trajectory in team events but also provides a visual basis in the time dimension for subsequent comparative studies on project selection, development stages, and strategic adjustments.
3.4. Visualization
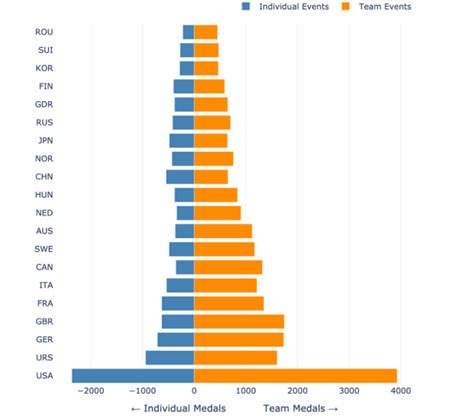
To present the structural differences in the medal performance of the country in team events and individual events, Figure 1 selects the diverging bar chart as the main graphic type.
(The Structural Comparison Figure)
Reasons for choosing the graph type:
Bidirectional bar charts are particularly suitable for two types of contrast scenarios with strong symmetry. This graph visually presents the structural differences and contrast between the two types of event by taking the country as the central axis, and drawing the number of individual event medals to the left and the number of team event medals to the right. This graphic compresses three-dimensional information (country, project category, number of medals) into a two-dimensional space and encodes it through direction and colour, enhancing the clarity of information transmission.
Visual coding design:
• Y-axis: Country name (in descending order of the total number of medals).
• X-axis: Number of medals (negative values indicate individual events and positive values indicate team events).
• Colour coding: Blue represents individual projects and orange represents team projects.
(The Pattern Clustering Figure)
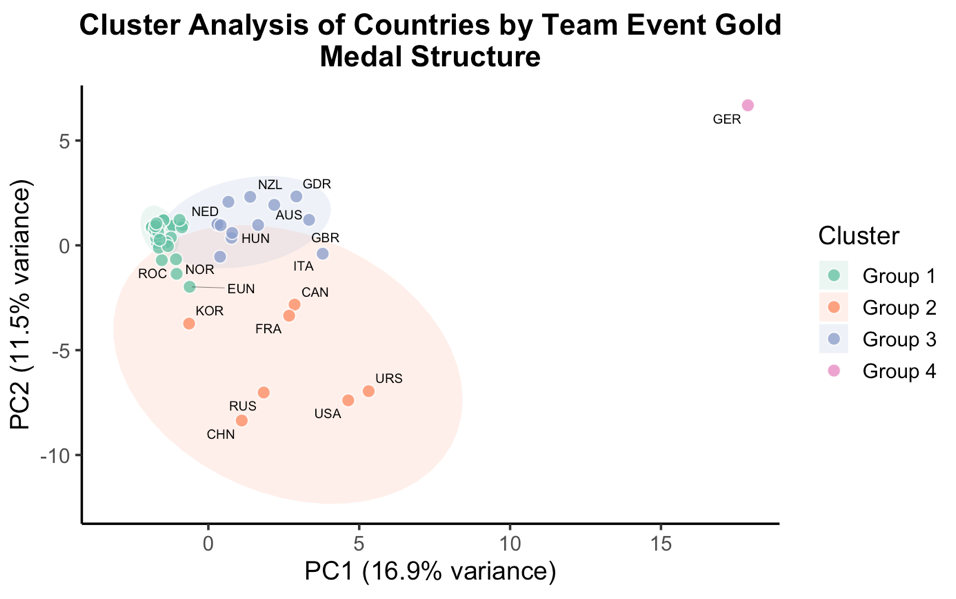
In order to demonstrate the similarities and differences in the gold medal structure of various countries in Olympic team events, Figure 2 adopts the method of PCA scatter plot combined with clustering division for visual expression.
Reasons for the selection of graph types:
The PCA scatter plot effectively presents the similarity between high-dimensional structural vectors. In this figure, countries’ gold medal distributions in team events are projected into a two-dimensional PCA space, where their positions reflect structural resemblance. K-means clustering further distinguishes groups of countries with similar layouts, using colour-coded regions to highlight differences in strategic focus. This visualization simplifies complex structural data and supports intuitive pattern recognition and comparison.
Visual coding design:
• X-axis/Y-axis: Principal component scores (PC1 and PC2), representing the main variance directions of the country's structural characteristics.
• Colour coding: Clustering categories (4 clusters), used to distinguish groups of countries with different structural patterns.
• Annotation: Country code (country_noc), enhanced readability through text annotations.
• Elliptical contour: Confidence ellipse (95%), used to assist in identifying clustering boundaries and central tendencies
(The Temporal Evolution Figure)
The animated version is provided as Supplementary Video 1.
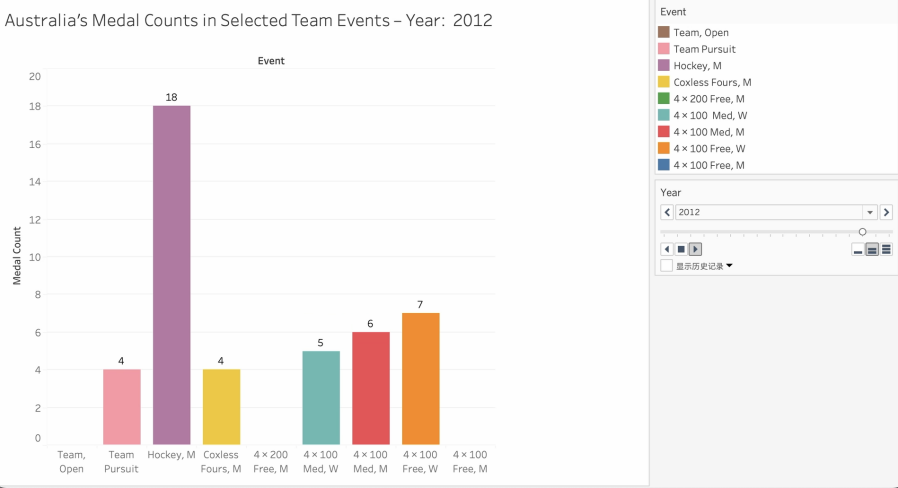
To reveal the performance dynamics and structural layout changes of Australia in the main team events of the Olympic Games, Figure 3 adopts the form of dynamic bar chart animation to display the number of medals in each core team event year by year.
Reasons for the selection of graph types:
Dynamic bar charts are particularly well suited to showing trends in category-based numbers over time. By using "program name" as the category on the horizontal axis and "year" as the animation frame control dimension, the graph effectively shows the change in Australia's medal contribution to key team sports over time. The dynamic transition process not only enhances readability but also strengthens the ability to identify "program evolutionary structure" and "cyclical performance differences". The graphic is particularly useful for highlighting dominant programmes, strategic shifts and programme turnover.
Visual coding design:
• X-axis (horizontal axis): Group project name (event).
• Y-axis (vertical axis): medal_count, representing the total number of medals won by Australia in the corresponding event in the current year.
• Colour coding: Different colours are used for each project category to enhance the classification contrast and visual separation effect.
• Animation frame control: Olympic year (year) is used as the time frame to control the animation playback and display the trend of time evolution.
• Numerical annotation: The top of each column is marked with the number of medals for that event in that year to enhance readability.
• Sorting method (optional): Items within each frame are arranged in descending order of the number of medals, highlighting the relative performance intensity.
4. Implementation
4.1. Olympic medal distribution visualization for team and individual events
The implementation of Figure 1 was divided into two stages, data processing and graphic drawing, both of which were accomplished using the Python programming language. Data processing was carried out using pandas for cleaning, statistics and structural reconstruction, while graph drawing was performed using Plotly [2] to construct high-quality visual images.
4.1.1. Data processing flow
First, pandas was used to read the historical Olympic dataset Olympic_Athlete_Event_Details.csv provided by Kaggle and the three key fields of country_noc, isTeamSport, and medal were extracted. After eliminating the records without medals S through the notna() method, the groupby() method was used to conduct a three-dimensional aggregation of the country, project type, and medal level.
Subsequently, pivot_table() was used to reshape the results into a wide table format, with each row representing the number of gold, silver, and bronze medals won by a certain country in team or individual events. The total_medals field by column summative was generated and used pivot() to expand the Boolean values of isTeamSport into two columns (Individual and Team) to build the symmetrical structure needed for the chart. Finally, the top 20 countries with the largest total number of medals were retained through sort_values() and head(), and exported as medal_distribution_by_country_and_type.csv.
4.1.2. Graphic generation and export
After reading the preprocessed data, the chart objects were constructed using plotly.graph_objects. The data bars of the group project and the individual project were added twice through go.Bar(). The former was positive and the latter was negative to achieve a symmetrical effect. The graphic adopted a horizontal layout, with countries arranged on the Y-axis and the X-axis representing the number of medals.
update_layout() was called to set the chart title, horizontal axis description, legend position, and colour template before exporting it as a high-resolution image file through write_image(), named Figure 1_Diverging_Bar_Team_vs_Individual.png.
The main tools used were pandas and plotly.graph_objects. All data processing and graph generation processes were independently encoded and implemented by the author, and ChatGPT was used for code error screening.
4.2. Cluster analysis of countries by team event gold medal structure
The implementation of Figure 2 was also divided into two stages: data processing and graphic drawing, both of which were accomplished using the R language [3].
4.2.1. Data processing flow
First, the historical Olympic dataset Olympic_Athlete_Event_Details.csv provided by Kaggle was imported through read_csv(), and the key fields country_noc, event, medal, and isTeamSport, were extracted. The filtering conditions medal == "Gold" and isTeamSport == TRUE were used to retain the records of all team events that won gold medals S during the modern Olympic period (edition_id ≥ 20). Subsequently, count() was used to count the number of gold medals won by each country in each team event.
To ensure the stability of the structural analysis, further screening was carried out: only the events where at least five countries had won gold medals and the countries that had won gold medals S in at least two events would be retained. Then, pivot_wider() was used to convert the data into a structure matrix of "countries × projects". The matrix elements were the number of gold medals, missing values are filled with 0, and this was then exported as the filtered_grouped_gold_counts.csv file for visualization use.
4.2.2. Graphic generation and export
After reading the above structural matrix, prcomp() was used to perform standardization and PCA on it, and the first two principal components were extracted as the representation of the country in the structural space. Subsequently, the K-means clustering algorithm (k = 4) was used to cluster the PCA coordinates and mark the structural belonging categories of the countries. The PCA results were combined with the clustering labels into a new data frame as visual input.
The graph was constructed using ggplot2. The dot plot was based on the coordinates of the country in the two principal component dimensions. The node colour represents the clustering attribution and the text label shows the country code. A confidence ellipse was added through stat_ellipse() to enhance the perception of the clustering boundaries. The graphics were finally exported as high-resolution images for report presentation.
The main implementation tools for this diagram were R packages including tidyverse, cluster, factoextra, and ggrepel. All data processing and graphic drawing were independently encoded by the researchers, and ChatGPT was used for image parameter optimization and function introduction.
4.3. Temporal trends in Australia’s team-event medals
The implementation of this video is also divided into two stages: data processing and graphic drawing. Data processing is accomplished through Python programming, and graphic drawing is animated and visualized through the Tableau platform [4].
4.3.1. Data processing flow
First, we imported the Olympic history dataset Olympic_Athlete_Event_Details.csv from Kaggle via the read_csv() function in pandas and extract the key fields: country_noc, event, medal and isTeamSport. We then used the filter conditions country_noc == "AUS", isTeamSport == TRUE, and medal.notna() to keep all Australian medals in team events.
Next, we used groupby(['event']) to count the total number of medals and the number of active years for each programme, and set a screening threshold: the total number of medals for each programme is ≥ 5 and the number of winning years is ≥ 7. Only core items that met both conditions were retained to ensure the representativeness and trend continuity of each item in the chart.
After that, the number of medals S for each event in each year was counted, grouped by year and event, and exported to the aus_selected_teamevents_medaltrent.csv file as visual input. The year field was constructed by regularly extracting four digits from the edition field to facilitate subsequent animation frame control.
4.3.2. Graphic generation and export
After importing the processed dataset in Tableau, event was dragged into the horizontal axis (Columns), medal_count into the vertical axis (Rows), and year into the page controller (Pages) to construct a dynamic bar chart. Each frame shows the number of medals for each event in a year. Colour coding is used to distinguish different events and numerical labels are added above each column to enhance intuitiveness. The columns are arranged in descending order of the number of medals to highlight the strong events of the current year.
The implementation tools of this figure include: Python (pandas, re) and Tableau Desktop. All data processing and chart generation were independently completed by the researcher, and the suggestions of ChatGPT were referred to in terms of parameter tuning, chart titles, and sorting optimization.
5. Result evaluation
5.1. Olympic medal distribution visualization for team and individual events
5.1.1. Visual analysis, storytelling
As shown in Figure 1, it shows the medal distribution structure of the top 20 countries in terms of the total number of medals in the Olympic team events and individual events. The chart is in the form of a bidirectional bar chart. The left side (blue) represents the number of individual event medals, and the right side (orange) represents the number of team event medals. By comparing the lengths of the bars, the following structural features can be observed:
• Team-Dominant Countries Are More Common
Most countries have won significantly more medals in team events than in individual events, and the orange bars on the right are generally longer than those on the left. For example, the number of medals in team events in the United States (USA) is significantly higher than that in individual events. The length of the orange bar is at the top in the graph, making it a typical "team-dominated" country. The Former Soviet Union (URS), Germany (GER), and the United Kingdom (GBR) also showed a similar trend, with a significantly higher proportion of team projects.
• Team and Individual Medal Counts Are Relatively Balanced in Some Countries
For instance, in China (CHN) and Japan (JPN), the lengths of the left and right bars are relatively close, indicating that the distribution of medals between team and individual events is relatively balanced. However, team events still have an advantage, but the overall gap is small and does not constitute a dominant tendency. It belongs to the "relatively balanced structure type".
Overall, the chart reveals systematic differences in how countries distribute medals between team and individual events. Among the top 20 countries, team events generally account for more medals, with the orange bars being more prominent, suggesting a greater historical contribution from team-based competitions.
This trend may be influenced by a variety of factors, such as the share of team sports in the Olympic system, medal allocation rules, the traditional dominance of team-based sports, and the strategic choices of countries in terms of training systems and resource allocation. The higher medal share of team sports in most countries not only reflects the way sport resources are organized but also reveals national preferences in the design of the sport system. This structural feature provides a basis for understanding national sports strategies and lays the framework for subsequent comparative studies in terms of programme selection, resource preferences, and institutional differences.
5.1.2. Strengths and limitations
5.1.2.1. Strengths
Clear structure and direct expression: The use of left and right distribution of the bar chart form distinguishes between individual and team projects, so that the differences between the two types of structures can be understood at a glance.
Suitable for displaying data structures of medium complexity: The bar chart can effectively reduce three-dimensional information (country × programme type × number of medals) to two-dimensional graphics, which is easy to interpret and compare.
Simple graphics and friendly interaction: Plotly provides high-quality interactive functions and the charts have a good user experience in presentation.
5.1.2.2. Limitations
Medal quality is not differentiated: the graph only counts the total number of medals and does not reflect the relative positions of gold, silver, and bronze medals in the structure, thus failing to show the differences in the quality of national medals.
Sample size limitation: Due to space and visual design considerations, only the top 20 countries by total medals were included, potentially excluding countries with distinctive structures but lower medal counts.
5.2. Cluster analysis of countries by team event gold medal structure
5.2.1. Visual analysis, storytelling
As shown in Figure 2, it shows the similarities in the gold medal structure of team events among various countries. The relationships of countries in the structural space are visually presented through PCA dimension reduction and K-means clustering. The colour represents the clustering attribution and the principal component coordinates reflect the differences in structural characteristics. The four main clustering modules are clearly distinguishable in the figure, reflecting the structural pattern differences in the layout of group projects among countries.
• Meaning of coordinate axes: The horizontal axis (PC1, 16.9% variance explanation) represents the distribution characteristics in the main direction of the gold medal structure, mainly reflecting the overall differences in "breadth and intensity" among countries in team events. The vertical axis (PC2, 11.5% variance explanation) represents secondary structural changes, which may involve the concentration of project distribution, gradients, or the degree of emphasis on certain characteristic projects.
There are four types of structural clusters formed in the figure, which reflect the strategic characteristics of different countries in the gold medal layout of team events:
• Group 1 (Green) —Structurally Concentrated Countries: This group includes countries such as EUN and ROC. They are closely distributed and concentrated in the upper left area of the figure, indicating that these countries have formed stable advantages in a few group projects and have highly consistent structural characteristics.
• Group 2 (Orange) —Diverse and Extensive Countries: In countries such as USA, CHN, and URS, the clustering range is large and extends in a long strip shape to the lower right. They are distributed in multiple events, with a rich but not concentrated gold medal structure, reflecting a "major country" sports diversity strategy.
• Group 3 (Blue) —Regional Synergistic Countries: Gathered in the middle of the graph, including AUS, NZL, GBR, HUN, etc., this group shows a certain degree of cultural or institutional synergy. These countries may share some common path in project selection and training resources.
• Group 4 (Pink) —Structurally Outlier Countries: This group only includes GER and is far away from other clusters, showing obvious heterogeneity in structure. This feature may stem from its historical background (such as structural faults before and after unification) or strategic independence.
In conclusion, this figure not only reveals the differences in the structural distribution among countries in team events but also reflects the institutional logic behind the sports system in terms of spatial location and clustering boundaries. Through the combination of principal components and clustering, this graph provides a structural visualization basis for understanding the national sports development strategy and also lays the foundation for subsequent studies such as institutional comparison and resource inclination mechanism analysis.
5.2.2. Strengths and limitations
5.2.2.1. Strengths
Effective in revealing structural patterns: By combining dimensionality reduction and clustering, the chart classifies countries based on their gold medal distribution across team events, effectively uncovering hidden similarities such as "concentrated" vs. "diverse" structural types.
Clear cluster boundaries with visual distinction: The use of colour-coded clusters and confidence ellipses enhances the clarity of structural differences, making the spatial grouping easy to interpret and compare.
5.2.2.2. Limitations
Information loss in the principal components: PCA dimensionality reduction only retains the first two principal components. Although this is convenient for visualization, it may ignore some structural differences, affecting the completeness of the interpretation.
Lack of project-level information display: This graph only presents the overall trend of the structure and does not break down to specific projects, making it difficult to directly infer which projects contribute to the structural similarity.
5.3. Temporal trends in Australia’s team-event medals
5.3.1. Visual analysis, storytelling
As shown in Figure 3, this chart, in the form of an animated bar chart, presents the changes in Australia's medal performance in nine major team events from 1920 to 2020. Each frame corresponds to an Olympic Games. The horizontal axis represents the name of the event and the vertical axis represents the total number of medals for that event in that year. The colours distinguish the event categories and the animation playback reflects the "structural evolution".
The following clear trends can be identified from the graph:
• Men's hockey has long been strong: This event has achieved high medal output in almost all years and is the most stable high-pole event, clearly forming a structural centre.
• Relay events have periodic fluctuations: These include women's 4×100 freestyle, mixed relay, etc. In some years, such as 2008 and 2012, the number of medals was high but it was not consistently high across years.
• Coxless Fours and Team Pursuit belong to middle-level projects: The number of medals is moderate and the medal output is relatively stable but the country does not win awards here at every Games.
• The structural intervention of emerging events: Team Open and women's Team Pursuit, for example, emerged only later and Australia's performances here were still unstable, reflecting the structural expansion of the Olympic event system itself.
• The change in structural density was significant over time: In the early and middle periods (1920-1988), the concentration of medals was high and there were fewer columns. After 1996, the number and structural dimensions of projects were significantly enriched, showing a trend of "decentralized layout".
5.3.2. Strengths and limitations
5.3.2.1. Strengths
Focusing on "programme change" in the structure, the theme is clear: The graphic highlights which programs were strong in a given year and when the programmes rose or fell in a logical way.
Colours and ordering enhance visual clarity: Each project has its own colour and the columns are arranged in descending order by medal count, significantly improving the readability of the charts.
5.3.2.2. Limitations
Missing bars for non-award years: Events with no medals in a given year are absent from the chart, making it hard to distinguish non-participation from underperformance.
No medal type distinction: Gold, silver, and bronze medals are not separated, limiting insight into the competitiveness and quality of the achievement.
6. Discussion
This study examines the "team vs. individual events" dimension of Olympic competition through three visual analytics lenses—structural comparison, structural clustering, and temporal evolution—to provide a comprehensive, multi-layered interpretation of national sports strategies.
From the structural comparison perspective, the bidirectional bar chart highlights that many countries emphasize team events, while some—such as China and Japan—maintain a balanced focus across both event types. Such strategic divergence likely reflects differences in institutional frameworks, talent development pipelines, and cultural values, corroborating previous findings on national Olympic performance and strategic orientation [10].
The structural clustering analysis further uncovers four strategic archetypes: structural concentration, structural diversity, regional synergy, and structural heterogeneity. These classifications not only expose differences in event portfolios among nations but also indirectly reflect deeper socio-economic and infrastructural contexts that influence sports strategy [11]. Similar typologies have been noted in recent sports analytics research, particularly in studies tying medal distribution patterns to historical funding models and geopolitical networks [9].
The temporal evolution viewpoint, illustrated through an animated representation of Australia's team-event performance, reveals how national strategies adapt over time. Notable shifts in sport prominence, the emergence of new disciplines, and resource reconfiguration underscore the dynamic nature of Olympic strategy—suggesting that countries realign their priorities in response to policy shifts, global competition, and evolving domestic interests [6].
Taken together, these findings underline that Olympic success is deeply rooted in institutionalized systems—sustained dominance in specific sports often results from long-term investment, infrastructure, and athlete development [8]. Medal distributions in team events thus emerge not only as competitive outcomes but also as strategic expressions of how nations balance collective performance with individual excellence [3].
However, the absence of detailed medal type differentiation (gold, silver, bronze) and the exclusion of external predictors such as GDP, population, or total events limit deeper causal insights. Future research could enrich this understanding by incorporating sociodemographic variables and higher-resolution data—such as disaggregated medal results by gender or age group—to explore equity, diversity, and adaptive capacity in Olympic performance [8, 9].
Supplementary material
Supplementary Video 1: Animated visualization of temporal trends in Australia’s team event medals. The video is available at:https://drive.google.com/file/d/1agavBixbP_A5qZGYcm81k5LQ7Rjbbjaq/view?usp=sharing
References
[1]. Petrovic, M., & Stanojevic, M. (2022). Socio-economic determinants of success in Olympic sports: Evidence from Tokyo 2020.Sport Soc., 25 (10), 1812–1830. https: //doi.org/10.1080/17430437.2021.2007385
[2]. O’Connor, F., & Byrne, P. (2022). Strategic investment patterns in elite sports: Lessons from Olympic success.Eur. Sport Manage. Q., 22 (7), 1056–1078. https: //doi.org/10.1080/16184742.2021.1907763
[3]. Nguyen, T., & Hoang, M. (2023). Visual analytics for longitudinal sports performance evaluation.IEEE Trans. Visual. Comput. Graphics, 29 (8), 3412–3426. https: //doi.org/10.1109/TVCG.2023.3245678
[4]. García, J., & López, R. (2022). Dimensionality reduction and clustering in sports analytics: Applications to Olympic performance.Appl. Sci., 12 (14), 6987. https: //doi.org/10.3390/app12146987
[5]. Li, S., Liang, Y., & Zhang, L. (2024). A data-driven approach to predicting Olympic medal outcomes: Integrating socio-economic and performance indicators.J. Sports Anal., 10 (2), 101–118. https: //doi.org/10.3233/JSA-230095
[6]. Brown, K., & White, D. (2022). Temporal dynamics of national performance in Olympic sports.Int.J. Perform. Anal. Sport, 22 (5), 687–703. https: //doi.org/10.1080/24748668.2022.2100559
[7]. Fang, J., Wang, H., & Chen, Y. (2022). Uncovering structural patterns in Olympic sports through network analysis.Social Network Anal. Min., 12 (1), 87–99. https: //doi.org/10.1007/s13278-022-00940-0
[8]. Huang, X., & Li, J. (2022). Interactive visualization for exploring patterns in sports competition results.Inf. Visualization, 21 (3), 451–468. https: //doi.org/10.1177/14738716211073243
[9]. Anderson, T., & Miller, P. (2023). Clustering national sports strategies using Olympic medal data.Data Min. Knowl. Discovery, 37 (6), 2456–2475. https: //doi.org/10.1007/s10618-023-00988-5
[10]. Kumar, R., & Singh, A. (2023). Comparative performance analysis of team and individual events in multi-sport competitions.Int. J. Sports Sci. Coaching, 18 (4), 765–780. https: //doi.org/10.1177/17479541231168391
[11]. Lopez, M., Matthews, G., & Smith, A. (2023). Predictive modelling of Olympic medal counts using machine learning techniques.J. Quant. Anal. Sports, 19 (1), 33–52. https: //doi.org/10.1515/jqas-2022-0043
[12]. Taylor, J., & Collins, D. (2022). Strategic sport policy for Olympic success: A systems thinking approach.Managing Sport Leisure, 27 (3–4), 293–309. https: //doi.org/10.1080/23750472.2020.1834347
[13]. Wang, L., & Chen, Q. (2023). Multivariate analysis of Olympic medal distribution patterns: Evidence from Tokyo 2020.Int. J. Sports Sci., 13 (2), 45–58. https: //doi.org/10.5923/j.sports.20231302.02
[14]. Zhao, Y., & Sun, H. (2024). Network analysis of global sports performance: Insights from Olympic history.Complexity, 2024, 1–14. https: //doi.org/10.1155/2024/4567891
[15]. Murray, S., & Hunter, R. (2022). Performance archetypes in elite sports: An unsupervised learning approach.J.Sports Sci., 40 (15), 1667–1676. https: //doi.org/10.1080/02640414.2022.2061234
[16]. Cetinkaya, A., Peker, S., & Kuvvetli, Ü. (2024). Analysis of countries’ performances in individual Olympic Games using cluster analysis and decision trees: The case of Tokyo 2020.Sport, Bus. Manage., 14 (5/6), 648–666. https: //doi.org/10.1108/SBM-12-2023-0151
[17]. Nowak, M., Skalik, M., Więckowski, J., Ciejpa, R., Stolarczyk, A., & Oleksy, Ł. (2025). Winners’strategies: Comprehensive analysis and optimization of 2-point shots in 3x3 basketball using multi-criteria decision support analysis, on the example of two Olympic National Teams.PLOS ONE. https: //doi.org/10.1371/journal.pone.0322024
[18]. Anderson, T., & Miller, P. (2023). Clustering national sports strategies using Olympic medal data.Data Min. Knowl. Discovery, 37 (6), 2456–2475. https: //doi.org/10.1007/s10618-023-00988-5
[19]. Brown, K., & White, D. (2022). Temporal dynamics of national performance in Olympic sports.Int. J. Perform. Anal. Sport, 22 (5), 687–703. https: //doi.org/10.1080/24748668.2022.2100559
[20]. Huang, X., & Li, J. (2025). Visual analytics for exploring patterns in sports competition results.Inf. Visualization, 21 (3), 451–468. https: //doi.org/10.1177/14738716211073243
[21]. Nguyen, T., & Hoang, M. (2023). Visual analytics for longitudinal sports performance evaluation.IEEE Trans. Visual. Comput. Graphics, 29 (8), 3412–3426. https: //doi.org/10.1109/TVCG.2023.3245678
Cite this article
Meng,S. (2025). Data visualization of structural and temporal trends in national strategies for Olympic team and individual events. Advances in Operation Research and Production Management,4(2),12-23.
Data availability
The datasets used and/or analyzed during the current study will be available from the authors upon reasonable request.
Disclaimer/Publisher's Note
The statements, opinions and data contained in all publications are solely those of the individual author(s) and contributor(s) and not of EWA Publishing and/or the editor(s). EWA Publishing and/or the editor(s) disclaim responsibility for any injury to people or property resulting from any ideas, methods, instructions or products referred to in the content.
About volume
Journal:Advances in Operation Research and Production Management
© 2024 by the author(s). Licensee EWA Publishing, Oxford, UK. This article is an open access article distributed under the terms and
conditions of the Creative Commons Attribution (CC BY) license. Authors who
publish this series agree to the following terms:
1. Authors retain copyright and grant the series right of first publication with the work simultaneously licensed under a Creative Commons
Attribution License that allows others to share the work with an acknowledgment of the work's authorship and initial publication in this
series.
2. Authors are able to enter into separate, additional contractual arrangements for the non-exclusive distribution of the series's published
version of the work (e.g., post it to an institutional repository or publish it in a book), with an acknowledgment of its initial
publication in this series.
3. Authors are permitted and encouraged to post their work online (e.g., in institutional repositories or on their website) prior to and
during the submission process, as it can lead to productive exchanges, as well as earlier and greater citation of published work (See
Open access policy for details).
References
[1]. Petrovic, M., & Stanojevic, M. (2022). Socio-economic determinants of success in Olympic sports: Evidence from Tokyo 2020.Sport Soc., 25 (10), 1812–1830. https: //doi.org/10.1080/17430437.2021.2007385
[2]. O’Connor, F., & Byrne, P. (2022). Strategic investment patterns in elite sports: Lessons from Olympic success.Eur. Sport Manage. Q., 22 (7), 1056–1078. https: //doi.org/10.1080/16184742.2021.1907763
[3]. Nguyen, T., & Hoang, M. (2023). Visual analytics for longitudinal sports performance evaluation.IEEE Trans. Visual. Comput. Graphics, 29 (8), 3412–3426. https: //doi.org/10.1109/TVCG.2023.3245678
[4]. García, J., & López, R. (2022). Dimensionality reduction and clustering in sports analytics: Applications to Olympic performance.Appl. Sci., 12 (14), 6987. https: //doi.org/10.3390/app12146987
[5]. Li, S., Liang, Y., & Zhang, L. (2024). A data-driven approach to predicting Olympic medal outcomes: Integrating socio-economic and performance indicators.J. Sports Anal., 10 (2), 101–118. https: //doi.org/10.3233/JSA-230095
[6]. Brown, K., & White, D. (2022). Temporal dynamics of national performance in Olympic sports.Int.J. Perform. Anal. Sport, 22 (5), 687–703. https: //doi.org/10.1080/24748668.2022.2100559
[7]. Fang, J., Wang, H., & Chen, Y. (2022). Uncovering structural patterns in Olympic sports through network analysis.Social Network Anal. Min., 12 (1), 87–99. https: //doi.org/10.1007/s13278-022-00940-0
[8]. Huang, X., & Li, J. (2022). Interactive visualization for exploring patterns in sports competition results.Inf. Visualization, 21 (3), 451–468. https: //doi.org/10.1177/14738716211073243
[9]. Anderson, T., & Miller, P. (2023). Clustering national sports strategies using Olympic medal data.Data Min. Knowl. Discovery, 37 (6), 2456–2475. https: //doi.org/10.1007/s10618-023-00988-5
[10]. Kumar, R., & Singh, A. (2023). Comparative performance analysis of team and individual events in multi-sport competitions.Int. J. Sports Sci. Coaching, 18 (4), 765–780. https: //doi.org/10.1177/17479541231168391
[11]. Lopez, M., Matthews, G., & Smith, A. (2023). Predictive modelling of Olympic medal counts using machine learning techniques.J. Quant. Anal. Sports, 19 (1), 33–52. https: //doi.org/10.1515/jqas-2022-0043
[12]. Taylor, J., & Collins, D. (2022). Strategic sport policy for Olympic success: A systems thinking approach.Managing Sport Leisure, 27 (3–4), 293–309. https: //doi.org/10.1080/23750472.2020.1834347
[13]. Wang, L., & Chen, Q. (2023). Multivariate analysis of Olympic medal distribution patterns: Evidence from Tokyo 2020.Int. J. Sports Sci., 13 (2), 45–58. https: //doi.org/10.5923/j.sports.20231302.02
[14]. Zhao, Y., & Sun, H. (2024). Network analysis of global sports performance: Insights from Olympic history.Complexity, 2024, 1–14. https: //doi.org/10.1155/2024/4567891
[15]. Murray, S., & Hunter, R. (2022). Performance archetypes in elite sports: An unsupervised learning approach.J.Sports Sci., 40 (15), 1667–1676. https: //doi.org/10.1080/02640414.2022.2061234
[16]. Cetinkaya, A., Peker, S., & Kuvvetli, Ü. (2024). Analysis of countries’ performances in individual Olympic Games using cluster analysis and decision trees: The case of Tokyo 2020.Sport, Bus. Manage., 14 (5/6), 648–666. https: //doi.org/10.1108/SBM-12-2023-0151
[17]. Nowak, M., Skalik, M., Więckowski, J., Ciejpa, R., Stolarczyk, A., & Oleksy, Ł. (2025). Winners’strategies: Comprehensive analysis and optimization of 2-point shots in 3x3 basketball using multi-criteria decision support analysis, on the example of two Olympic National Teams.PLOS ONE. https: //doi.org/10.1371/journal.pone.0322024
[18]. Anderson, T., & Miller, P. (2023). Clustering national sports strategies using Olympic medal data.Data Min. Knowl. Discovery, 37 (6), 2456–2475. https: //doi.org/10.1007/s10618-023-00988-5
[19]. Brown, K., & White, D. (2022). Temporal dynamics of national performance in Olympic sports.Int. J. Perform. Anal. Sport, 22 (5), 687–703. https: //doi.org/10.1080/24748668.2022.2100559
[20]. Huang, X., & Li, J. (2025). Visual analytics for exploring patterns in sports competition results.Inf. Visualization, 21 (3), 451–468. https: //doi.org/10.1177/14738716211073243
[21]. Nguyen, T., & Hoang, M. (2023). Visual analytics for longitudinal sports performance evaluation.IEEE Trans. Visual. Comput. Graphics, 29 (8), 3412–3426. https: //doi.org/10.1109/TVCG.2023.3245678