


0. Introduction
Climate change is widely acknowledged as one of the most significant challenges facing the world today. Global warming has led to frequent extreme weather events, impacting agricultural production, water resource supply, and ecosystem health. The agricultural sector plays a crucial role in climate change and, at the same time, is severely affected by it. Agriculture is a major source of greenhouse gas emissions, including carbon dioxide, methane, and nitrous oxide. Agricultural carbon emissions primarily stem from soil management, animal and plant production, and agricultural machinery. Therefore, understanding and reducing agricultural carbon emissions are of paramount importance [1].
Studying agricultural carbon emissions contributes to the formulation of more effective policies and strategies by governments, agricultural departments, and decision-makers to reduce greenhouse gas emissions, achieve carbon neutrality, and promote sustainable agriculture. Furthermore, mitigating agricultural carbon emissions is crucial for global climate change adaptation. Reducing carbon emissions can mitigate the greenhouse effect, alleviate the negative impacts of climate change on agriculture, such as droughts, floods, and rising sea levels. Reducing carbon emissions is often closely linked to enhancing agricultural sustainability. Adopting sustainable agricultural practices can reduce resource wastage, improve soil quality, and enhance agricultural productivity.
Research on agricultural carbon emissions is also related to global food security. As the global population continues to grow, reducing carbon emissions helps ensure that agricultural systems can meet people's food needs.
In conclusion, studying agricultural carbon emissions is not only significant for addressing the challenges of climate change but also contributes to achieving sustainable development goals, ensuring future food security, and promoting environmental health. Research in this field will provide valuable guidance and decision support for the sustainable development of the agricultural sector. This paper focuses on the analysis of the correlation of agricultural carbon emissions in Liaoning Province using the Spearman correlation coefficient algorithm.
1. Data collection and processing
1.1 Data collection
To address the requirements of Question 1, we first chose to collect historical data that meets the specified criteria. Therefore, we gathered relevant historical monitoring data from various sources such as the National Bureau of Statistics and China Rural Network for all provinces and direct-controlled municipalities in China from 2000 to 2020. The collected data is presented in Table 1:
Table 1: Historical Monitoring Data from 2000 to 2020
Region |
Year |
Fertilizer Usage (10,000 tons) |
Plastic Film Usage (tons) |
Agricultural Diesel Usage (10,000 tons) |
Pesticide Usage (tons) |
Crop Sowing Area (thousand hectares) |
Irrigation Area (thousand hectares) |
Fertilizer Carbon Emissions (10,000 tons) |
|||||||||||||
Beijing |
2000 |
17.90 |
9825.00 |
7.90 |
5440.00 |
457.30 |
328.19 |
15.9310 |
|||||||||||||
Tianjin |
2000 |
16.60 |
8718.00 |
16.60 |
3605.00 |
533.10 |
353.15 |
14.7740 |
|||||||||||||
Hebei |
2000 |
270.60 |
62518.00 |
184.90 |
72839.00 |
9024.40 |
4482.32 |
240.8340 |
|||||||||||||
Shanxi |
2000 |
87.00 |
27601.00 |
22.70 |
17516.00 |
4042.40 |
1105.04 |
77.4300 |
|||||||||||||
Inner Mongolia |
2000 |
74.80 |
34586.00 |
29.90 |
8905.00 |
5914.40 |
2371.67 |
66.5720 |
|||||||||||||
Liaoning |
2000 |
109.80 |
80678.00 |
45.20 |
35635.00 |
3622.00 |
1440.69 |
97.7220 |
|||||||||||||
... |
... |
... |
... |
... |
... |
... |
... |
... |
|||||||||||||
Shaanxi |
2020 |
201.90 |
44724.00 |
93.40 |
11951.00 |
4160.80 |
1336.80 |
179.6910 |
|||||||||||||
Gansu |
2020 |
80.40 |
152956.00 |
36.10 |
40312.00 |
3931.80 |
1338.60 |
71.5560 |
|||||||||||||
Qinghai |
2020 |
5.50 |
7378.00 |
6.50 |
1233.00 |
571.40 |
219.20 |
4.8950 |
|||||||||||||
Ningxia |
2020 |
38.10 |
16388.00 |
21.40 |
2174.00 |
1174.20 |
552.50 |
33.9090 |
|||||||||||||
Xinjiang |
2020 |
248.20 |
259674.00 |
85.20 |
21823.00 |
6280.00 |
4893.40 |
220.8980 |
|||||||||||||
Analysis of the table indicates that the agricultural carbon emissions of various provinces and direct-controlled municipalities are mainly associated with several factors:
1.2. Data processing
To ensure the collected data's effectiveness and completeness, we opted to preprocess the data. First, we conducted an outlier check on the data collected in Excel, and no invalid or abnormal data were identified. However, we observed some missing values, specifically in the plastic film usage for Yunnan in 2003 and pesticide usage for Shandong in 2003. To address this, we chose the nearest-neighbor imputation method [1] as a means to handle the outliers. We replaced the missing values with the average values, ensuring data continuity. The imputed data is presented in Table 2:
Table 2: Imputed Data Table
Region |
Year |
Fertilizer Usage (10,000 tons) |
Plastic Film Usage (tons) |
Agricultural Diesel Usage (10,000 tons) |
Pesticide Usage (tons) |
Crop Sowing Area (thousand hectares) |
Irrigation Area (thousand hectares) |
Fertilizer Carbon Emissions (10,000 tons) |
Yunnan |
2003 |
129.20 |
59882.50 |
44.60 |
26873.00 |
5756.00 |
1457.00 |
114.9880 |
Shandong |
2003 |
432.70 |
305676.00 |
172.20 |
158819.50 |
10885.30 |
4760.79 |
385.1030 |
2. Solution of carbon emissions based on IPCC emission coefficient method
Given the previous analysis, the first step is to calculate the carbon emissions from fertilizer, film, diesel, tillage, and irrigation.
The Intergovernmental Panel on Climate Change (IPCC) Emission Coefficient Method [1] is employed to assess carbon emissions produced during various activities or processes. The IPCC, established in 1988 by the World Meteorological Organization, is an international organization for climate change assessment. The calculation formula is as follows:
 (1)
(1)
In the equation,  represents the total agricultural carbon emissions,
  represents the agricultural carbon emissions from the i-th carbon source,
  represents the input of the ith carbon source, and
  represents the emission coefficient of the i-th carbon source.
After consulting relevant literature and drawing on related sources, carbon emission coefficients for various sources have been collected. The specific sources and values are detailed in Table 3:
Table 3: Reference Table for Carbon Emission Coefficients of Carbon Sources
Carbon Source |
Emission Coefficient |
|
Diesel |
0.59kg/kg |
IPCC 2013 |
Fertilizer |
0.89kg/kg |
Oak Ridge National Laboratory, USA |
Pesticide |
4.93kg/kg |
Oak Ridge National Laboratory, USA |
Film |
5.18kg/kg |
Institute of Agricultural Resources and Environmental Sciences, Nanjing Agricultural University, China |
Irrigation |
266.48kg/hm2 |
Duan Huaping et al. |
Tillage |
312.60kg/km2 |
Li Bo et al. |
Using these coefficients, the carbon emissions from six agricultural sources are calculated for all provinces and direct-controlled municipalities in China from 2000 to 2020, along with the total carbon emissions. Taking Liaoning Province as an example, the results are visualized using MATLAB in Figure 2:
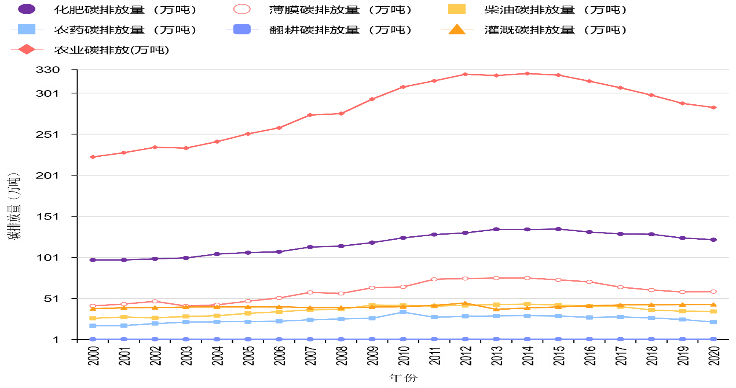
Figure 1: Carbon Source Emissions in Liaoning Province
Analysis of Figure 2 reveals that the carbon emissions in Liaoning Province are primarily associated with fertilizer usage, followed by plastic film usage, irrigation area, agricultural diesel usage, and lastly, crop sowing area.
3. Preliminary analysis of the relationships between carbon emission sources
Upon calculating the carbon emissions from various sources in Liaoning Province, we initiate a preliminary analysis of the relationships between these sources. The chosen analytical method involves creating scatter plots for each pair of carbon sources [3]. A total of  scatter plots were generated, as shown in Figure 3:
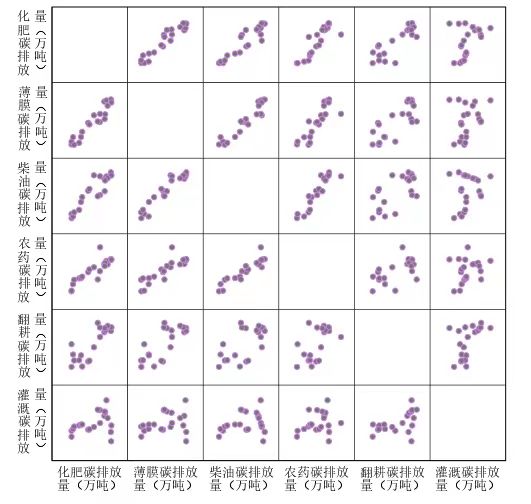
Figure 3: Scatter Plots Between Various Carbon Sources
Based on the analysis of Figure 3, it is observed that the scatter plots for two types of carbon sources, namely fertilizer carbon emissions and film carbon emissions, tend to converge on a straight line. Similarly, there may be linear relationships between diesel carbon emissions and film carbon emissions, pesticide carbon emissions and fertilizer carbon emissions, as well as pesticide carbon emissions and diesel carbon emissions. However, there may not be apparent linear relationships among other influencing factors. Therefore, further analysis is warranted.
4. In-depth analysis of the relationships between carbon emission sources based on Spearman correlation coefficient
In the field of statistics, the Spearman correlation coefficient [4-5] is a commonly used non-parametric measure of correlation. Introduced by Spearman in 1904, it has found widespread application in areas such as pattern recognition. We choose to employ the Spearman correlation coefficient for a more thorough analysis of the relationships between the six carbon emission sources in Liaoning Province.
Let X and Y represent the carbon emissions of any two out of the six categories in Liaoning Province.
The Spearman correlation coefficient is given by:
 (2)
(2)
In the equation,  represents the rank difference between X and Y. If there are identical values, their positions are averaged arithmetically.
Based on the aforementioned analysis, we conducted an in-depth analysis using SPSS software. Analysis of Figure 4 reveals that there is a strong correlation between fertilizer carbon emissions and film carbon emissions, fertilizer carbon emissions and pesticide carbon emissions, film carbon emissions and diesel carbon emissions, and pesticide carbon emissions and diesel carbon emissions. In contrast, the correlation between the other two factors is weaker.
5. Conclusion
This study focused on exploring the correlations among various agricultural carbon emissions in Liaoning Province. After calculating the numerical values of the six carbon emissions in Liaoning Province, the research findings indicate that among the six types of agricultural carbon emissions, the strongest correlation exists between fertilizer carbon emissions and film carbon emissions, followed by diesel carbon emissions and pesticide carbon emissions, diesel carbon emissions and film carbon emissions, fertilizer carbon emissions and pesticide carbon emissions, diesel carbon emissions and fertilizer carbon emissions, tillage carbon emissions and fertilizer carbon emissions, tillage carbon emissions and film carbon emissions, and tillage carbon emissions and diesel carbon emissions. The correlations among other types of agricultural carbon emissions are relatively weaker. Therefore, considering the above analysis, relevant recommendations and decisions can be proposed for the agricultural carbon emissions in Liaoning Province.
6. Recommendations
(1) Enhancing Agricultural Productivity and Sustainability: Promote modern agricultural technologies and management practices, including precision farming, greenhouse gas emission reduction technologies, and smart agriculture, to enhance agricultural efficiency, reduce the use of fertilizers and pesticides, and lower greenhouse gas emissions. Encourage organic farming and the protection of farmland ecosystems, improve soil quality through measures such as integrated farming, crop rotation, and green manure to enhance carbon storage capacity. Advance agricultural comprehensive utilization and resource recycling, such as the reuse of agricultural waste and energy recovery, to reduce methane emissions from organic waste.
(2) Strengthening Greenhouse Gas Emission Measurement and Monitoring: Establish a robust measurement and monitoring system for agricultural greenhouse gas emissions, including estimating and monitoring the emissions of major greenhouse gases such as nitrous oxide, methane, and carbon dioxide. Train and support farmers and agricultural professionals in mastering greenhouse gas emission measurement methods and skills to enhance data accuracy and reliability. Utilize modern technology and innovative approaches, such as satellite remote sensing and drone monitoring, for real-time tracking of greenhouse gas emissions from agricultural activities.
(3) Promoting Low-Carbon Agricultural Production Systems: Support farmers in adopting low-carbon agricultural cultivation and breeding methods, such as greenhouse gas reduction measures in rice fields, organic farming, and low-nitrogen agriculture. Encourage the agricultural sector to shift towards renewable energy sources, such as solar and biomass energy, to reduce dependence on fossil fuels. Drive the greening of the agricultural production and supply chain, promoting the production, processing, and sale of low-carbon agricultural products, and enhancing consumer awareness and demand for low-carbon agricultural products.
(4) Reinforcing Climate-Smart Decision Support: Establish decision support systems for climate adaptation and carbon reduction in agriculture, providing scientific foundations for agricultural management and decision-making. Strengthen the collection and sharing platforms for agricultural climate information, offering data on weather forecasts, climate change trends, and disaster risks to assist farmers in devising flexible agricultural production plans.
(5) Rural Energy Transition and Carbon Market Development: Promote the widespread adoption of clean energy in rural areas, including biomass energy, solar energy, and small-scale wind power. Develop an agricultural carbon market, encouraging farmers and agricultural enterprises to participate in carbon trading. Incentivize and support the implementation of agricultural carbon reduction measures by allowing the generation of carbon reduction benefits through agricultural carbon reduction projects.
References
[1]. Hu, Y., Zhang, K., Hu, N., et al. (2023). Overview of research on carbon emissions estimation in Chinese agriculture. Chinese Journal of Eco-Agriculture, 31(02), 163-176.
[2]. Qian, F., Wang, X., Gu, H., et al. (2023). Spatiotemporal variations and key driving factors of agricultural carbon emissions in the three northeastern provinces of China. Chinese Journal of Eco-Agriculture. Advance online publication. [DOI: 10.3724/SP.J.1011.2023.11104]
[3]. Ren, J., Dong, L., Wang, J., et al. (2010). Research on spatial differences in economic development at the county level in Liaoning Province based on spatial statistical analysis. Economic Geography, 30(09), 1435-1439.
[4]. Li, Y., Liu, Y., Feng, L. (2023). Extraction of nonlinear dynamic process features and fault detection based on Spearman correlation analysis. Journal of Shandong University of Science and Technology (Natural Science Edition), 42(02), 98-107.
[5]. Lan, W., Che, C., Tao, C. (2020). Selection of single spectral components based on Spearman rank correlation and its application in SAR target recognition. Journal of Wave Science, 35(03), 414-421.
Cite this article
Gao,J.;Gao,Z.;Zhao,Z.;Wang,J.;Liu,J. (2023). A study on the correlation of agricultural carbon emissions in Liaoning Province based on the Spearman correlation coefficient. Advances in Operation Research and Production Management,1,20-26.
Data availability
The datasets used and/or analyzed during the current study will be available from the authors upon reasonable request.
Disclaimer/Publisher's Note
The statements, opinions and data contained in all publications are solely those of the individual author(s) and contributor(s) and not of EWA Publishing and/or the editor(s). EWA Publishing and/or the editor(s) disclaim responsibility for any injury to people or property resulting from any ideas, methods, instructions or products referred to in the content.
About volume
Journal:Advances in Operation Research and Production Management
© 2024 by the author(s). Licensee EWA Publishing, Oxford, UK. This article is an open access article distributed under the terms and
conditions of the Creative Commons Attribution (CC BY) license. Authors who
publish this series agree to the following terms:
1. Authors retain copyright and grant the series right of first publication with the work simultaneously licensed under a Creative Commons
Attribution License that allows others to share the work with an acknowledgment of the work's authorship and initial publication in this
series.
2. Authors are able to enter into separate, additional contractual arrangements for the non-exclusive distribution of the series's published
version of the work (e.g., post it to an institutional repository or publish it in a book), with an acknowledgment of its initial
publication in this series.
3. Authors are permitted and encouraged to post their work online (e.g., in institutional repositories or on their website) prior to and
during the submission process, as it can lead to productive exchanges, as well as earlier and greater citation of published work (See
Open access policy for details).
References
[1]. Hu, Y., Zhang, K., Hu, N., et al. (2023). Overview of research on carbon emissions estimation in Chinese agriculture. Chinese Journal of Eco-Agriculture, 31(02), 163-176.
[2]. Qian, F., Wang, X., Gu, H., et al. (2023). Spatiotemporal variations and key driving factors of agricultural carbon emissions in the three northeastern provinces of China. Chinese Journal of Eco-Agriculture. Advance online publication. [DOI: 10.3724/SP.J.1011.2023.11104]
[3]. Ren, J., Dong, L., Wang, J., et al. (2010). Research on spatial differences in economic development at the county level in Liaoning Province based on spatial statistical analysis. Economic Geography, 30(09), 1435-1439.
[4]. Li, Y., Liu, Y., Feng, L. (2023). Extraction of nonlinear dynamic process features and fault detection based on Spearman correlation analysis. Journal of Shandong University of Science and Technology (Natural Science Edition), 42(02), 98-107.
[5]. Lan, W., Che, C., Tao, C. (2020). Selection of single spectral components based on Spearman rank correlation and its application in SAR target recognition. Journal of Wave Science, 35(03), 414-421.