


1 Introduction
1.1 Background
Transportation Security Administration (TSA) comes under sharp criticism for extremely long waiting lines, and several changes have been made to take care of the highly congested airports. As one of the biggest airports in the US and in the world, Chicago O’Hare International Airport (ORD) is suffering from the extremely long waiting lines for the security check. There are always a lot of complaints by passengers, and some of them even fail to get on the plane due to the long security check time. In addition to the issues at ORD, there are also incidents of unexplained and unpredicted long lines at other airports, as we can see on the news and the Internet. This high variance in checkpoint lines can be extremely costly to passengers as they decide between arriving unnecessarily early or potentially missing their scheduled flight.
We estimated the average passenger throughput per day for each terminal in ORD, and the throughput for busy days and the vacancy days. It shows that the total number of passengers in ORD in 2015 is 76,949,336, and 4 terminals are mainly used for civil transportation. If we assume that the airport works for 18 hours per day, then we get the average flow of passengers in the whole year: 2928 persons are coming for security check every hour in each terminal.
However, dealing with 2928 is not an easy task for a single terminal in one hour. After cautiously analysing the data provided by ORD, we acquire the expectation of the time needed for a person to get through the Zone A, document check, and Zone B, baggage and body screening. Besides, we also estimate the average time needed in security check for those who belong to the trusted travellers of Pre-Check. The information is important for our simulations.
1.2 Our Work
At the beginning, we design a simple model to illustrate the problems that ORD has in the busy seasons or days, by just assuming the flow of coming people to be approximately constant (small fluctuation is decided by a random number), and people tend to stand in the shortest line when they come. We find that the crowd are accumulating for the insufficient dealing ability of the check point, which means it is a saturation situation, and apparently that is why people always find long lines in the airports.
For the purpose of calculating the best solution for the crowded problem, we carefully design a statistic model, where statistic distribution is also considered for getting more precise outcomes. Moreover, more factors are also included in the model, such as the distribution of the check time, distribution of the coming-in flow, and so on. With the help of numerical simulations, we figure out the corresponding solution, after balancing plenty of factors that impact the average waiting time and waiting time variance.
We also refer to queuing theory to evaluate the efficiency of our model. Due to the complexity of model and pre-conditions, we decided not to calculate the analytic solutions to find the variance, but use numerical method instead to find the best solution for the airport.
More parameters are also included for describing different social customs, so that the model can be used in different countries or regions. We develop a new way to calculate the best operation for the airports, which positively enhanced the efficiency of security check, and minimize the cost or the investment of the airports. This method is suitable in many different airports around the world, because of the plenty parameters we have included. Evaluations are also provided in the last part of this paper. We point out the weakness and the strengths of the models we have created, and readers are welcome to offer their suggestions towards our models.
1.3 Assumptions
• The flow of passengers is approximately constant when they come to the airport, and all of them are required to get through the security check.
• We only deal with the situations that the crowd are over the dealing ability of certain number of available check entrances, which means that no opening entrance is vacant during the busy days and busy hours.
• We assume that there are busy days and vacant days in the whole year. In busy days, more passengers and travelers are prepared to get aboard and leave for another places, such as summer vacation, the Christmas, winter vacation, etc. In these busy days, the airport is sure to face a more stressed situation and people also have to suffer from the long lines. So, we decide that the passenger current is constant in the whole day, but the daily total throughput varies from day to day because it may be busy or vacant.
2 Model
2.1 Simple Model
For ORD, the rate between regular security check entrances and Pre-Check entrances is \( 3:1 \) , and the amount of coming people is 2928 per hour, on average 0.81333 person per second. In this simple model we assume that each people would choose the shortest line when he starts waiting in the line. The total checking time, including document check in Zone A and screening in Zone B, is constantly set as 39 seconds, referring to the data from ORD. We use C++ to simulate the waiting process, and compute the average waiting time, and variance for everyone in the whole checking process.
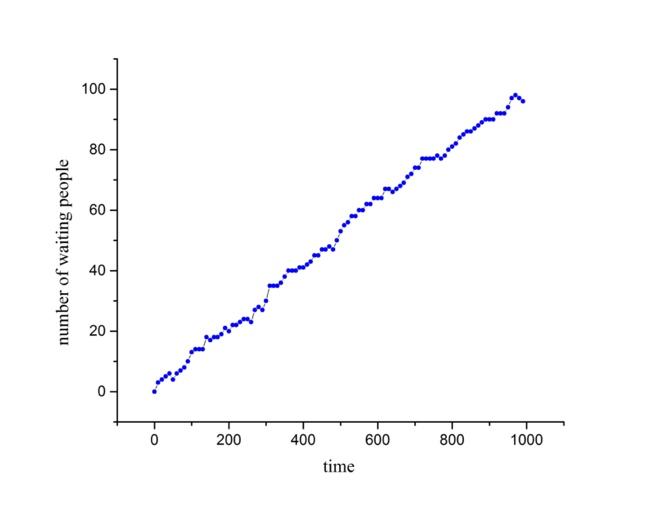
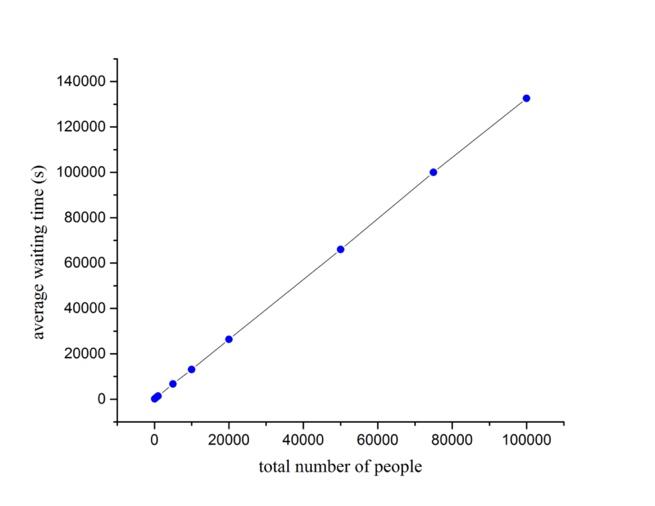
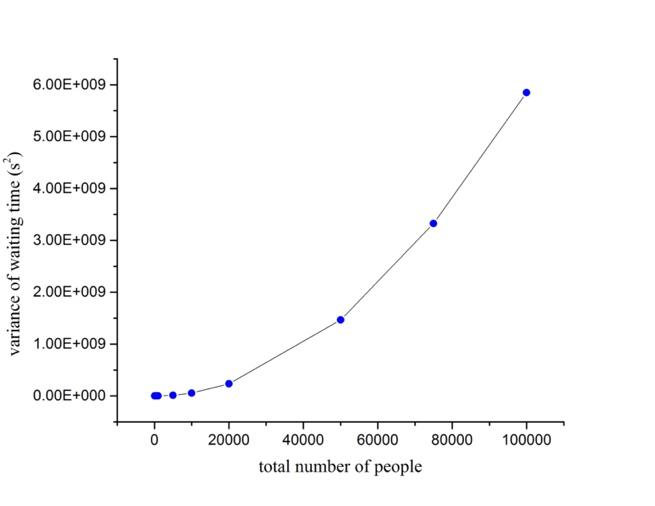
Because of insufficient gates available for the waiting people, and on average each person needs 39 seconds to get through the security check, so a mass of congested crowd is inevitable in such an embarrassed situation, as shown in Fig.(1, 2, 3). As demonstrated in the figures, when the passengers are coming in constant flow, and only 4 gates are open for security check, which apparently indicates that there are not enough check entrances for such a busy passenger flow. For the simple reason that the dealing ability of all the available gates is weaker than the rate of new people coming into the lines, people cannot avoid the fact that get congested before the check point, wasting huge amount of time in vain. We think the current problems that most airports face can be described by this simple model.
|
|||
Figure 1. The number of waiting people that accumulates as time goes by, in the unit of second. |
|||
|
|
||
Figure 2. Average waiting time increases as total amount of people increases. |
Figure 3. Variance of waiting time increases as total amount of people increases. |
||
2.2 Modifications
We make a statistic model to describe the queuing problem and find the best solutions in this issue more precisely. The model mentioned above lacks many factors compared to the real situations, so that the former simple model cannot provide precise estimate for what is really happening in those crowded airports. Consequently, after referring to the queueing theory, we make a creative solution for solving the problem. We figure out how many gates are exactly needed when facing with different passenger flow. Hence, the staffs will easily know how many check entrances should be open when certain number of passengers are waiting for security check. In order to describe the true situation in the crowded airports, we add some factors:
• The statistic distribution of checking time for each person, include document check, baggage and body screening.
• The fluctuation of coming flow in a single day and in different days in a single year.
• The efficiency of security check.
• Number of serving check entrances.
• What influence of different queuing customs have to our model, such as various customs in America, China, Switzerland, or slower passengers.
• The cost needed for an airport.
2.3 Mathematical Theory
When passengers are coming for security check at a constant flow, say there are \( λ \) passengers coming into one terminal each second, then the number of arrived passengers between \( [0, t] \) follows Poisson distribution:
\( P\lbrace X(t)=k\rbrace =\frac{(λt)^{k}e^{-λt}}{k!},\ \ \ (1) \)
which means the possibility of finding \( k \) people at time of \( t \) is \( P\lbrace X(t)=k\rbrace \) .
Moreover, we carefully analyze what statistic rule controls the distribution of checking time. Considering time spent by screening devices are almost the same, and according to the distribution of screening time in ORD, we find that checking time follow Gaussian distribution:
\( P(a=x)=\frac{1}{\sqrt[]{2π}σ}e^{-\frac{(x-μ)^{2}}{2σ^{2}}},\ \ \ (2) \)
where \( μ \) is the average security checking time for each passenger, and \( σ^{2} \) is the variance of security check time for each passenger. For the case of ORD, we get \( μ= 39.02s \) , \( σ^{2}=191.68s^{2} \) , then the standard deviation is \( σ=13.854s \) . So obviously \( 1/μ \) represents how many people can get through the security check for only one entrance, meanwhile \( S/μ \) represents how many people can get through when there are \( S \) gates for security check.
In the simulation program, we use Monte Carlo 'acceptance rejection sampling' method to sample checking time, and in the algorithm checking time obeys Gaussian distribution.
Furthermore, by referring to queuing theory, when the number of passengers \( n \) is larger than number of gates \( S \) , we can directly define
\( ρ=\frac{λ}{S}μ\ \ \ (3) \)
as the disposing ability of the security checkpoint. \( ρ \) is the ratio between the increasing rate of amount needed to be disposed \( λ \) , and speed of disposing \( S/μ \) . Or in another word, \( ρ \) reflects the efficiency of the checking system. Apparently, with the balance state theory in the queuing theory, when \( ρ \lt 1 \) , namely disposing ability \( S/μ \) is greater than \( λ \) , the so-called congested crowded line is not likely to appear.
|
Figure 4. Diagram for state transitions. |
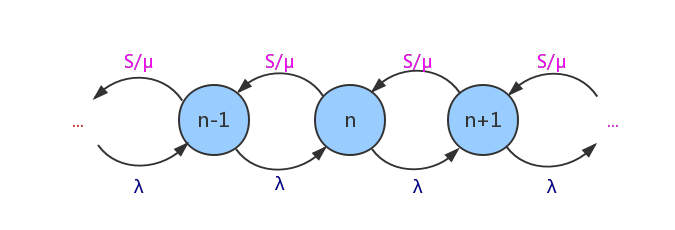
On the other hand, regarding the state-transition equations in the queuing theory, the possibility of \( n \) people waiting in lines is determined by equations
\( \lbrace (n+1)P_{n+1}\frac{1}{μ}+λP_{n-1}=(λ+\frac{n}{μ})P_{n}, 1≤n≤S; \frac{S}{μ}P_{n+1}+λP_{n-1}=(λ+\frac{S}{μ})P_{n}, n \gt S, \ \ \ (4) \)
which means the state diverts as illustrated in Fig.(4).
Taking into the influence given by two types of lanes, the Pre-Check lane and regular lane, and in the saturation state, we define the incoming mission for Pre-Check lanes as \( 0.45λ \) and that for regular lanes as \( 0.55λ \) . Let \( S_{p} \) denote the number of opening Pre-Check gates, and \( μ_{p} \) the expectation of total check time for each person in Pre-Check lane. For regular check and Pre-Check, the gate number rate is \( S/S_{p} =3/1 \) , so the dealing time rate for each person is \( μ/μ_{p} =3∙45/55=2.454 \) .
2.4 Simulations
In this part we provide some result given by the numerical simulations, so that we can easily understand how to solve the problem most efficiently.
The coming flow is set as the normal situation, namely 2928 people coming per hour, so that on average 0.81333 person are coming per second. This passenger flow represents the average flow within the whole year. Most importantly, the algorithm uses Monte Carlo sampling to generate total checking time randomly, decided by the rules of Gaussian distribution. Still, people come and find the shortest line when they arrive.
We study the different situations when number of check gate varies from 12 to 28 in each terminal. The result of modeling is clearly shown in the figures. In the diagram we set the time unit in second (s) and variance in \( s^{2} \) .
|
|
|
Figure 5. Relationship between average waiting time for every person, and number of gates, when passenger flow \( λ \) is at average value 0.81333. |
Figure 6. Relationship between variance of waiting time for every person, and number of gates, when passenger flow \( λ \) is at average value 0.81333. |
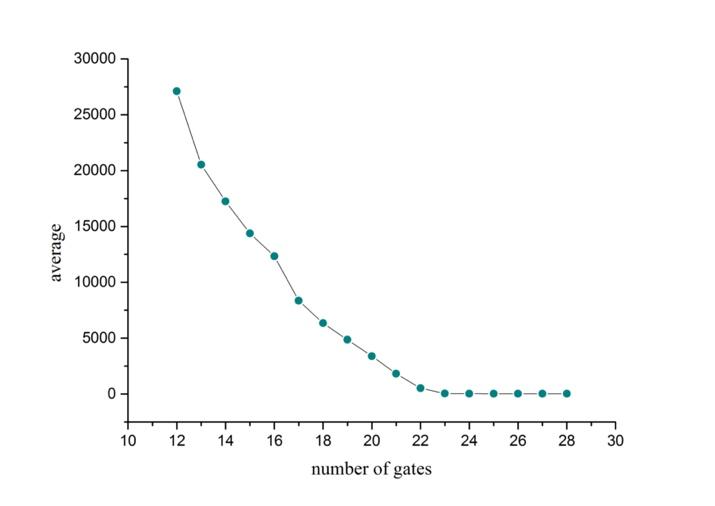
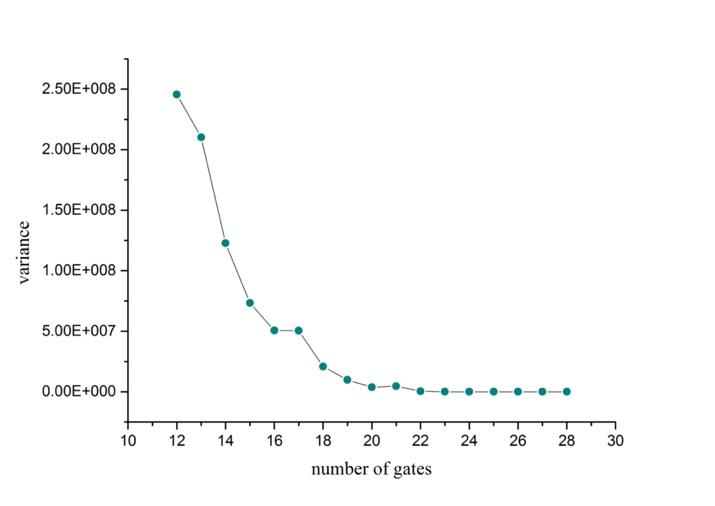
The balance solution for normal situation \( λ=0.81333 \) is calculated in Section.2.3. The answer turns out to be that 24 gates would not cause congestion due to disposing ability is equal to flow value, as illustrated in Fig.(5,6). But is it wasteful to directly open 24 gates in each terminal?
The figures tell us the convincing fact that both average waiting time and variance decrease as more gates are available. In Fig.(6) the variance of waiting time for 20 to 28 gates is almost the same. In Fig.(5) average waiting time for 20 gates is about 3300 seconds, that is about 55 minutes, and average time for 21 gates is 1812 seconds, that is about 30 minutes. Hence, if the airport mainly wants to reduce variance in waiting lines, we reckon that 20 to 24 gates are just okay. Considering that people only need to wait half an hour when 21 gates are open, we therefore suggest that 21 is the optimal solution.
2.5 Optimal Solution
We also add financial cost into this model. Just assume that the cost of operating each gate, the equipment fee, the salary, electricity, maintaining fee are all the same for each gate and screening equipment, then we naturally draw the presumption that total cost of operating security checkpoint is linear to the total number of gates \( S \) , that is to say, the cost can be described as \( C_{total}=C∙S \) .
By using a common method of finding optimal solution in physics and engineering, if two variables have opposite tendency as certain parameter changes, we can calculate the product of two variables and look for the extremum value of the product. In this case, with more gates open for security check, the cost of operating the system becomes higher, but the average value of total waiting time \( W_{s} \) , and variance of total waiting time \( V_{s} \) decrease. Therefore, we define the product of \( C_{total} \) and \( W_{s} \) as \( Pro_{A} \) and the product of \( C_{total} \) and \( V_{s} \) as \( Pro_{V} \) :
\( Pro_{A}=C∙S∙W_{s},\ \ \ (5) \)
\( Pro_{V}=C∙S∙V_{s}.\ \ \ (6) \)
Then we just need to find extremum value within reasonable range and figure out what the most appropriate gate number is when \( λ=0.81333 \) . In the computer program we simulate the process of waiting and draw the diagram for \( Pro_{A} \) and \( Pro_{V} \) . Since \( C \) has no influence on the solution, we can simply set \( C=1 \) .
Similar to Section.2.4, we simulate \( Pro_{A} \) and \( Pro_{V} \) , as function of gate number. According to Fig.(5,6), we know that the best range is from 20 to 24 gates. After taking the cost into consideration, we find that the cost and fee do not have notable impact to the whole system, as \( Pro_{V} \) is almost equal to each other when 20 to 24 gates are open, which reveals that 21 gates are suitable. Therefore, in the case of \( λ=0.81333 \) , after taking financial cost, average waiting time and waiting time variance into account, we finally draw the conclusion that 21 gates is the most appropriate solution, and the waiting time variance has been greatly decreased compared to former situation.
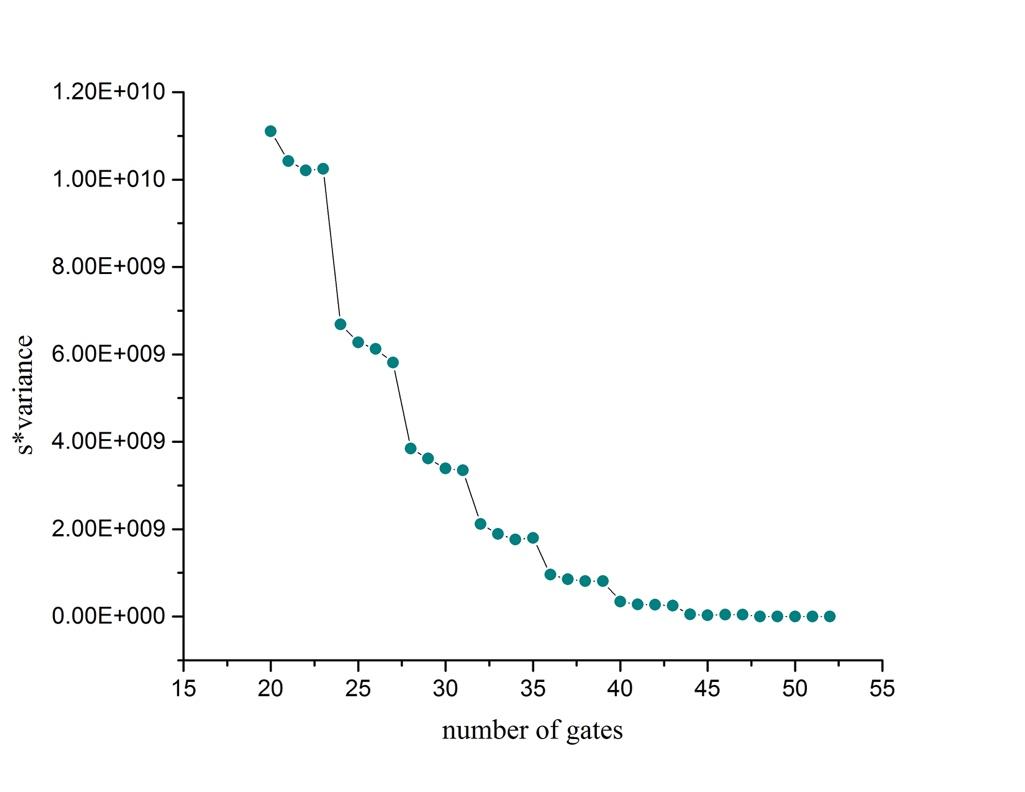
Likewise, we can also deal with other passenger flow in the same way. For instance, when it comes to larger passenger flow, like double the average flow, \( λ=1.62667 \) , after analyzing variance and waiting time, and \( Pro_{V} \) as well, we decide that 44 gates are just okay. Fig.(7) shows \( Pro_{V} \) when \( λ \) comes to crest value.
|
Figure 7. Relationship between \( Pro_{V} \) and gate number \( S \) , when \( λ=1.62667 \) . |
With the help of this model, in a similar way, we can also calculate the best solution when the flow value \( λ \) is at other value. In our solution for ORD, the possibility of waiting two more hours is only \( 0.3\% \) . It is really a good thing that we manage to reduce variance \( V_{s} \) successfully, such that standard deviation of waiting time \( σ_{s} \) is only 30 to 40 minutes, which guarantees \( 99.7\% \) of passengers will never wait more than 2 hours. More than 70 percent of the passengers will finish security check at most one hour, and the average waiting time is only half an hour.
3 Cultural Norms
3.1 Basic assumptions
Different countries and regions have their own cultural norms that shape the local rules of social interaction. We introduce two more parameters to depict this issue: \( P_{c} \) , the percentage of people finding the shortest line as they arrive, and \( E_{l} \) , the error rate when people picking the shortest line. We pick the following parameter to simulate different cultures in different situations:
Situations |
\( P_{c} \) |
\( E_{l} \) |
Standard model |
1.00 |
0.00 |
USA |
0.50 |
0.10 |
China |
0.80 |
0.05 |
Slower travellers |
0.00 |
0.05 |
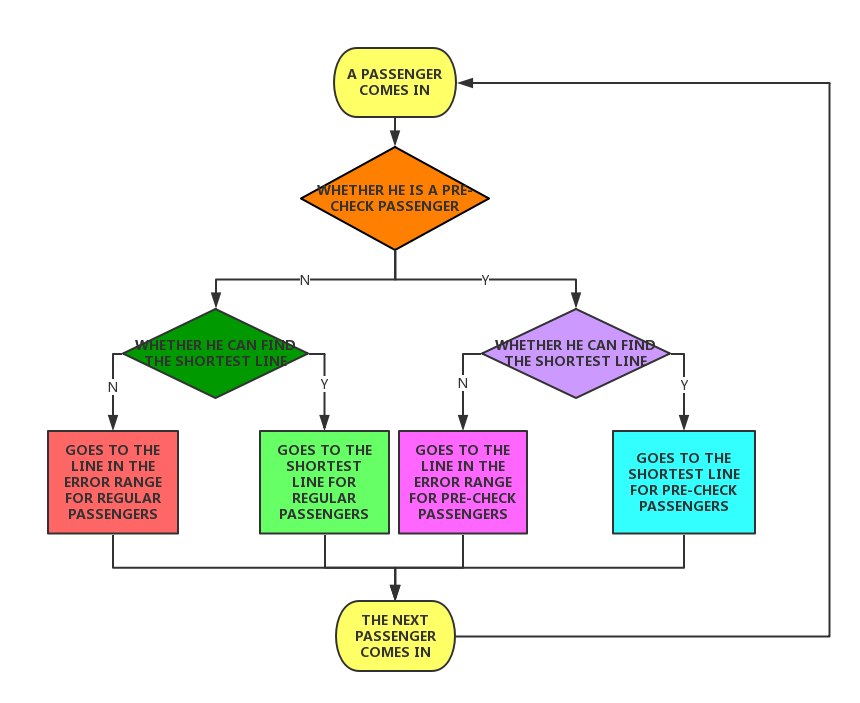
The algorithm is shown in Fig.(8). All the judgement is made by random numbers in the algorithm.
|
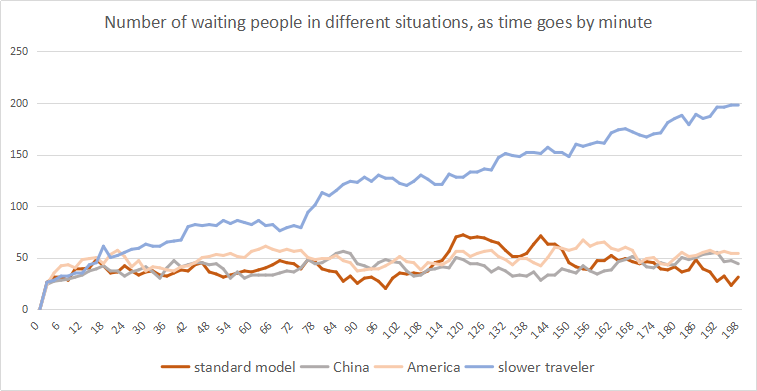
Figure 8. Process of the country-related model, also the main process of the algorithm. 3.2 Simulations By utilizing the idea above, we study how different customs influence the amount of waiting people. Firstly, as shown in Fig.(9), which shows that except for slower travelers, the normal model, American and Chinese almost have same amount of waiting people when the input flow is fixed. We can easily draw the conclusion that if passengers are not interested in choosing the shortest time when they come in, the number of congested passengers increases greatly so that the efficiency gets lower compared to that of other models. Besides, the slower traveler style can describe the place where the living pace is not fast, like North Europe, or South America. The model of America and China are suitable to describe fast-speed society, like London, Tokyo, Hong Kong or Singapore, etc. |
|
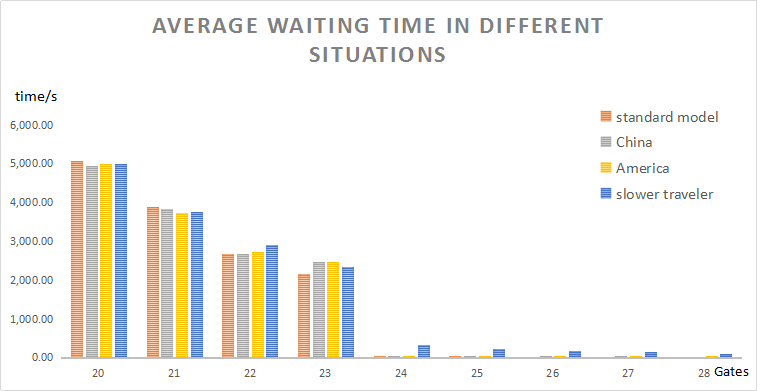
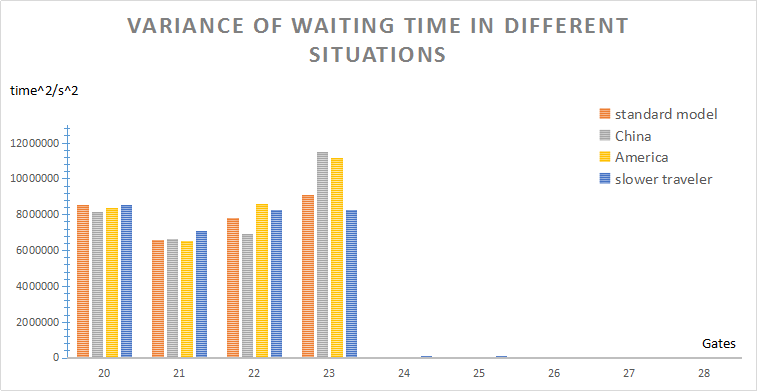
Figure 9. Number of waiting people, in different queuing style. Furthermore, we are curious about the impact of these different customs and manners to the average waiting time \( W_{s} \) and variance \( V_{s} \) . The custom's impact is shown in Fig.(10,11), for different gate number setup. To our surprise, the different customs and manners have small effects on \( W_{s} \) and \( V_{s} \) . Furthermore, we find that in Fig.(11), in the range of 20 to 23 gates, the variance is still the smallest at 21 gates. That is to say, the regional differences, like manners and norms, have little influence on choosing the number of gates \( S \) . |
|
|
|
Figure 10. Average waiting time \( W_{s} \) in different situations, as the gate number changes from 20 to 28. |
Figure 11. Variance of time \( V_{s} \) in different situations, as the gate number changes. |
4 Conclusions
We figure out the optimal solution to avoid endless waiting lines, by studying the data and security check setup for ORD. We mainly focus on the statistical rule the variables obey, so that we are able to find their influence more reasonably and precisely.
Our work points out the best solution when various passenger flows are coming and gives a relationship between the optimal entrance number and passenger flow, with the help of Monte Carlo method. Moreover, we also introduce the impact of different cultural norms to our model. By designing the parameters creatively, we exhibit how our model are affected by these additional factors. The solution we offer have greatly reduced the variance, for the standard deviation is only about 30 minutes, and the average waiting time is also half an hour. We prove that in our solution only \( 0.3\% \) of the passengers may wait for more than 2 hours, even when the passenger flow is extremely large.
References
[1]. https://en.wikipedia.org/wiki/O%27Hare_International_Airport
[2]. Sundarapandian, V. (2009). "7. Queueing Theory". Probability, Statistics and Queueing Theory. PHI Learning. ISBN 978-81-203-3844-9.
[3]. Kendall, D. G. (1953). "Stochastic Processes Occurring in the Theory of Queues and their Analysis by the Method of the Imbedded Markov Chain". The Annals of Mathematical Statistics. 24 (3): 338–354. doi:10.1214/aoms/1177728975. JSTOR 2236285.
[4]. https://www.comap.com/contests/mcm-icm
[5]. Bramson, M. (1999). "A stable queueing network with unstable fluid model". The Annals of Applied Probability. 9 (3): 818–853. doi:10.1214/aoap/1029962815. JSTOR 2667284.
[6]. Hastings, W. K. (1 April 1970). "Monte Carlo sampling methods using Markov chains and their applications". Biometrika. 57 (1): 97–109.
[7]. Kolokoltsov, Vassili (2010). Nonlinear Markov processes. Cambridge University Press. p. 375.
[8]. Pankaj Mehta, Marin Bukov, Ching-Hao Wang, Alexandre G.R. Day, Clint Richardson, Charles K. Fisher, David J. Schwab, A high-bias, low-variance introduction to Machine Learning for physicists, Physics Reports, Volume 810, 2019, https://doi.org/10.1016/j.physrep.2019.03.001.
[9]. James, Gareth; Witten, Daniela; Hastie, Trevor; Tibshirani, Robert (2013). An Introduction to Statistical Learning: with Applications in R (1st ed.). Springer. ISBN 978-1-4614-7137-0.
[10]. Fanfei Meng, Branden Ghena. (2023) Research on Text Recognition Methods Based on Artificial In-telligence and Machine Learning. Advances in Computer and Communication, 4(5), 340-344.
[11]. Fanfei Meng and David Demeter. Sentiment analysis with adaptive multi-head attention in transformer, 2023.
[12]. Manijeh Razeghi, Arash Dehzangi, Donghai Wu, Ryan McClintock, Yiyun Zhang, Quentin Durlin, Jiakai Li, and Fanfei Meng. Antimonite-based gap-engineered type-ii superlattice materials grown by mbe and mocvd for the third generation of infrared imagers. In Infrared Technology and Applications XLV, volume 11002, pages 108–125. SPIE, 2019.
[13]. Fanfei Meng, Lele Zhang, and Yu Chen. Fedemb: An efficient vertical and hybrid federated learning algorithm using partial network embedding.
[14]. Fanfei Meng, Lele Zhang, and Yu Chen. Sample-based dynamic hierarchical trans-former with layer and head flexibility via contextual bandit.
[15]. Fanfei Meng and Chen-Ao Wang. Adynamic interactive learning interface for computer science education: Program-ming decomposition tool.
[16]. Chang Ling, Chonglei Zhang, Mingqun Wang, Fanfei Meng, Luping Du, and Xiaocong Yuan, "Fast structured illumination microscopy via deep learning," Photon. Res. 8, 1350-1359 (2020)
[17]. Meng, Fanfei, Lalita Jagadeesan, and Marina Thottan. "Model-based reinforcement learning for service mesh fault resiliency in a web application-level." arXiv preprint arXiv:2110.13621 (2021).
[18]. Chen, Jin-Jin, et al. "A dataset of diversity and distribution of rodents and shrews in China." Scientific Data 9.1 (2022): 304
[19]. Fanfei Meng, Yuxin Wang, Lele Zhang, Yingxin Zhao. Joint detection algorithm for multiple cognitive users in spectrum sensing. AEI (2023) Vol. 4: 16-25. DOI: 10.54254/2977-3903/4/2023053.
Cite this article
Wang,Y.;Meng,F.;Wang,X.;Xie,C. (2023). Optimizing the passenger flow for airport security check. Advances in Operation Research and Production Management,1,45-53.
Data availability
The datasets used and/or analyzed during the current study will be available from the authors upon reasonable request.
Disclaimer/Publisher's Note
The statements, opinions and data contained in all publications are solely those of the individual author(s) and contributor(s) and not of EWA Publishing and/or the editor(s). EWA Publishing and/or the editor(s) disclaim responsibility for any injury to people or property resulting from any ideas, methods, instructions or products referred to in the content.
About volume
Journal:Advances in Operation Research and Production Management
© 2024 by the author(s). Licensee EWA Publishing, Oxford, UK. This article is an open access article distributed under the terms and
conditions of the Creative Commons Attribution (CC BY) license. Authors who
publish this series agree to the following terms:
1. Authors retain copyright and grant the series right of first publication with the work simultaneously licensed under a Creative Commons
Attribution License that allows others to share the work with an acknowledgment of the work's authorship and initial publication in this
series.
2. Authors are able to enter into separate, additional contractual arrangements for the non-exclusive distribution of the series's published
version of the work (e.g., post it to an institutional repository or publish it in a book), with an acknowledgment of its initial
publication in this series.
3. Authors are permitted and encouraged to post their work online (e.g., in institutional repositories or on their website) prior to and
during the submission process, as it can lead to productive exchanges, as well as earlier and greater citation of published work (See
Open access policy for details).
References
[1]. https://en.wikipedia.org/wiki/O%27Hare_International_Airport
[2]. Sundarapandian, V. (2009). "7. Queueing Theory". Probability, Statistics and Queueing Theory. PHI Learning. ISBN 978-81-203-3844-9.
[3]. Kendall, D. G. (1953). "Stochastic Processes Occurring in the Theory of Queues and their Analysis by the Method of the Imbedded Markov Chain". The Annals of Mathematical Statistics. 24 (3): 338–354. doi:10.1214/aoms/1177728975. JSTOR 2236285.
[4]. https://www.comap.com/contests/mcm-icm
[5]. Bramson, M. (1999). "A stable queueing network with unstable fluid model". The Annals of Applied Probability. 9 (3): 818–853. doi:10.1214/aoap/1029962815. JSTOR 2667284.
[6]. Hastings, W. K. (1 April 1970). "Monte Carlo sampling methods using Markov chains and their applications". Biometrika. 57 (1): 97–109.
[7]. Kolokoltsov, Vassili (2010). Nonlinear Markov processes. Cambridge University Press. p. 375.
[8]. Pankaj Mehta, Marin Bukov, Ching-Hao Wang, Alexandre G.R. Day, Clint Richardson, Charles K. Fisher, David J. Schwab, A high-bias, low-variance introduction to Machine Learning for physicists, Physics Reports, Volume 810, 2019, https://doi.org/10.1016/j.physrep.2019.03.001.
[9]. James, Gareth; Witten, Daniela; Hastie, Trevor; Tibshirani, Robert (2013). An Introduction to Statistical Learning: with Applications in R (1st ed.). Springer. ISBN 978-1-4614-7137-0.
[10]. Fanfei Meng, Branden Ghena. (2023) Research on Text Recognition Methods Based on Artificial In-telligence and Machine Learning. Advances in Computer and Communication, 4(5), 340-344.
[11]. Fanfei Meng and David Demeter. Sentiment analysis with adaptive multi-head attention in transformer, 2023.
[12]. Manijeh Razeghi, Arash Dehzangi, Donghai Wu, Ryan McClintock, Yiyun Zhang, Quentin Durlin, Jiakai Li, and Fanfei Meng. Antimonite-based gap-engineered type-ii superlattice materials grown by mbe and mocvd for the third generation of infrared imagers. In Infrared Technology and Applications XLV, volume 11002, pages 108–125. SPIE, 2019.
[13]. Fanfei Meng, Lele Zhang, and Yu Chen. Fedemb: An efficient vertical and hybrid federated learning algorithm using partial network embedding.
[14]. Fanfei Meng, Lele Zhang, and Yu Chen. Sample-based dynamic hierarchical trans-former with layer and head flexibility via contextual bandit.
[15]. Fanfei Meng and Chen-Ao Wang. Adynamic interactive learning interface for computer science education: Program-ming decomposition tool.
[16]. Chang Ling, Chonglei Zhang, Mingqun Wang, Fanfei Meng, Luping Du, and Xiaocong Yuan, "Fast structured illumination microscopy via deep learning," Photon. Res. 8, 1350-1359 (2020)
[17]. Meng, Fanfei, Lalita Jagadeesan, and Marina Thottan. "Model-based reinforcement learning for service mesh fault resiliency in a web application-level." arXiv preprint arXiv:2110.13621 (2021).
[18]. Chen, Jin-Jin, et al. "A dataset of diversity and distribution of rodents and shrews in China." Scientific Data 9.1 (2022): 304
[19]. Fanfei Meng, Yuxin Wang, Lele Zhang, Yingxin Zhao. Joint detection algorithm for multiple cognitive users in spectrum sensing. AEI (2023) Vol. 4: 16-25. DOI: 10.54254/2977-3903/4/2023053.