


1. Introduction
Depressive disorder refers to a type of mood disorder characterized primarily by prominent and persistent depressive symptoms caused by various factors. Its main features include low mood, slowed thinking, diminished interest, and weakened volition, often accompanied by other psychological and somatic symptoms [1]. In recent years, college students have faced increasing pressure from multiple sources, such as academics, employment, interpersonal relationships, and emotions, leading to a steady rise in the incidence of depressive disorders within this population. Depression has become one of the most common psychological disorders among college students and is a leading cause of suicide and academic withdrawal in universities. Epidemiological data indicate that the incidence rate of depressive disorders among college students has reached 24%, with depressive tendencies and dysthymia being the main manifestations. This suggests that college students have become a high-risk group for depressive disorders [2-4]. Therefore, early identification and intervention of depression in college students are of great significance for reducing depressive symptoms and improving overall mental health. This study adopts the emotional Stroop experimental paradigm—a method widely used in psychology to study the relationship between emotion and cognition—to explore its effectiveness in identifying depressive disorders among college students.
2. Participants and methods
2.1. Participants
A total of 153 college student volunteers were recruited from a university in Tianjin, including 66 males and 87 females. Among them, 32 were graduate students (27 master’s and 5 doctoral) and 121 were undergraduates. The average age was 22.41 ± 3.65 years. All participants had normal or corrected-to-normal vision, no color blindness or color weakness, and were all right-handed.
2.2. Experimental design
This study adopted a single-factor repeated measures design. The independent variable was the type of word (positive, neutral, depressive), and the dependent variables were reaction time, number of errors, and number of omissions.
2.3. Materials
2.3.1. Emotional words
Thirty depressive adjectives were randomly selected from subscales E, F, and G of the Depression Adjective Checklist (Lubin, 1965) [1], and thirty neutral adjectives were randomly selected from the Modern Chinese Dictionary. Eight graduate students majoring in psychology rated the emotional valence and familiarity of the sixty adjectives (30 depressive and 30 neutral) using a 5-point scale. The scale ratings were as follows: 1 = depressive, 2 = slightly depressive, 3 = neutral, 4 = slightly positive, 5 = positive. The evaluation results are shown in Table 1.
|
Emotional Valence |
Familiarity |
||||
|
n |
Mean Valence |
SD |
Mean Familiarity |
SD |
|
|
Depressive Words |
30 |
1.375 |
0.553 |
4.256 |
0.312 |
|
Neutral Words |
30 |
3.152 |
0.434 |
4.417 |
0.256 |
A valence score of 3 was used as the criterion for statistical testing. Depressive words were selected if their emotional valence was significantly lower than 3, while neutral words were selected if their emotional valence did not significantly differ from 3. All words chosen had a familiarity rating higher than 3. Ultimately, 20 depressive adjectives and 20 neutral adjectives that met the criteria were selected as experimental materials. The students who participated in material evaluation did not take part in the formal experiment.
2.3.2. Scales
(1) Zung Self-Rating Depression Scale (SDS)
The Zung Self-Rating Depression Scale (SDS), developed under the direction of Zung, is a self-report tool designed to measure the severity of depressive symptoms. The scale consists of 20 items, primarily assessing symptoms related to depressive states, and provides an intuitive reflection of the respondent’s subjective feelings. The split-half reliability of the scale was reported as 0.92 (1986), and the criterion-related validity (with HRSD) was 0.84 [5].
(2) Patient Health Questionnaire–9 (PHQ-9)
The Patient Health Questionnaire–9 (PHQ-9) is a 9-item self-assessment instrument for screening depressive symptoms, based on the diagnostic criteria for depression in the Diagnostic and Statistical Manual of Mental Disorders (DSM-IV). It has a Cronbach’s α coefficient of 0.85, a 4-week test–retest reliability of 0.88, and structural validity ranging from 0.618 to 0.761 [6].
2.4. Procedure
2.4.1. Emotional stroop experiment
The experiment was programmed and conducted using the DMDX psychological experiment software system. Stimuli were presented via computer, and participants’ responses were recorded automatically. The experiment consisted of two parts: a preparatory practice session followed by the formal test.
(1) Preparatory Practice
To minimize experimental errors due to unfamiliarity with color or keyboard layout, participants first completed a preparatory practice session. In this stage, four colored shapes (red, green, yellow, and blue) were randomly presented on the computer screen. Participants were instructed to respond using corresponding keyboard keys: A – Red, D – Green, J – Yellow, L – Blue. Only participants who achieved 100% accuracy during practice proceeded to the formal test.
(2) Formal Experiment
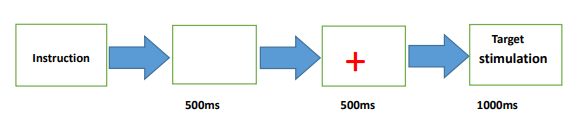
The experimental stimuli were presented in random order. DMDX recorded each participant’s reaction time, number of omissions, and number of errors. Experimental Procedure: Instructions → Blank Screen (500 ms) → Fixation Point (500 ms) → Target Stimulus (1000 ms). The target stimulus disappeared immediately after the participant’s response; if no response was made, it disappeared automatically after 1000 ms (see Figure 1).
2.5. SDS and PHQ-9 tests
After completing the emotional Stroop experiment, 37 participants who exhibited an emotional Stroop effect were included in the study group. These participants subsequently completed the SDS and PHQ-9 depression scales.
2.6. Data processing
After the experiment, all participant data were compiled. Data from participants with an error rate greater than 5% or who failed to follow instructions were excluded. All valid data were statistically analyzed using SPSS 23.0 software.
3. Results
3.1. Results of the emotional stroop experiment among college students
The results of reaction time, number of errors, and omissions for depressive and neutral words in the emotional Stroop experiment are presented in Table 2.
|
Reaction Type |
Depressive Words |
Neutral Words |
t |
|
Reaction Time |
557±4.4410 |
522±2.5166 |
41.708** |
|
Number of Errors |
1.189±1.0498 |
0.622±0.7208 |
2.711** |
|
Number of Omissions |
0.676±0.7837 |
0.243±0.4350 |
2.935** |
*p<0.05,**p<0.01
The results in Table 2 indicate that in the emotional Stroop experiment, the reaction time for depressive words was significantly longer than that for neutral words (t = 41.708, p < 0.01), demonstrating interference of emotional information with non-emotional information processing—namely, the emotional Stroop effect. Furthermore, significant differences were also found in omission rate (t = 2.935, p < 0.01) and error rate (t = 2.711, p < 0.01) between depressive and neutral words, suggesting that the participants exhibited deficiencies in distraction inhibition and attentional bias, consistent with previous findings [7, 8]. Since the overall error and omission rates of both groups were below 0.5%, these differences were considered negligible and were excluded from further statistical analysis.
3.2. Results of the SDS and PHQ-9 depression scale tests
After completing the emotional Stroop experiment, the participants in the study group were assessed using the SDS and PHQ-9 depression scales. The results are presented in Table 3.
|
Group |
SDS |
PHQ-9 |
|
Study Group |
59.89±6.691 |
8.54±5.747 |
Table 3 shows that the mean SDS score was 59.89 ± 6.691, and the mean PHQ-9 score was 8.54 ± 5.747. The distribution of participants across different severity levels is shown in Table 4 and Table 5.
|
Distribution |
53≤ No Depression |
53-62 Mild Depression |
63-72 Moderate Depression |
≥73 Severe Depression |
|
n |
7 |
18 |
10 |
2 |
|
% |
18.92% |
48.65% |
27.03% |
5.41% |
The SDS results were scored using raw scores according to the manual’s guidelines: ≤ 53 = no depression, 53–63 = mild depression, 63–72 = moderate depression, and ≥ 73 = severe depression. As shown in Table 3 and Table 4, 7 participants (18.92%) showed no depression, 18 (48.65%) showed mild depression, 10 (27.03%) showed moderate depression, and 2 (5.41%) showed severe depression. In total, 30 participants (81.08%) fell within the mild-to-severe depression range. These findings indicate that among individuals who exhibited an emotional Stroop effect, the positive detection rate of depression using the SDS scale was 81.08%.
|
Distribution |
0-4 No Depression |
5-9 Mild Depression |
10-14 Moderate Depression |
15-19 Moderately Severe Depression |
20-27 Severe Depression |
|
n |
8 |
17 |
8 |
2 |
2 |
|
% |
21.62% |
45.95% |
21.62% |
5.41% |
5.41% |
According to the PHQ-9 scoring manual, a total score of 0–4 indicates no depression, 5–9 mild depression, 10–14 moderate depression, 15–19 moderately severe depression, and 20–27 severe depression. As shown in Tables 3 to Table 5, 8 participants (21.62%) had no depression, 17 (45.95%) had mild depression, 8 (21.62%) had moderate depression, 2 (5.41%) had moderately severe depression, and 2 (5.41%) had severe depression. Altogether, 29 participants (78.38%) fell within the mild-to-severe depression range. These findings suggest that among individuals who exhibited an emotional Stroop effect, the positive detection rate of depression using the PHQ-9 scale was 78.38%.
3.3. Correlation between reaction time in the emotional stroop experiment and depression scale scores (SDS and PHQ-9)
To further verify the effectiveness of the emotional Stroop effect in identifying depressive disorders among college students, correlation analyses were conducted between reaction times in the Stroop task and the scores of the SDS and PHQ-9 scales. The results are shown in Table 6.
|
Word Type |
SDS |
PHQ-9 |
|
Neutral Words |
0.091 |
0.073 |
|
Depressive Words |
0.757** |
0.739** |
*p<0.05,**p<0.01
As shown in Table 6, the reaction time for depressive words was significantly correlated with the SDS score (r = 0.757, p < 0.01), while the reaction time for neutral words showed no significant correlation (r = 0.091, p > 0.05). Similarly, the reaction time for depressive words was significantly correlated with the PHQ-9 score (r = 0.739, p < 0.01), whereas the reaction time for neutral words was not (r = 0.073, p > 0.05). These results demonstrate that when SDS and PHQ-9 are used as criterion measures, the emotional Stroop effect shows a high level of criterion-related validity with both scales, further confirming that the emotional Stroop effect is an effective tool for identifying depressive disorders among college students.
4. Discussion
This study conducted a confirmatory experiment to examine the effectiveness of the emotional Stroop effect in identifying depressive disorders among college students. The emotional Stroop effect is an experimental paradigm used to investigate how emotional information interferes with the cognitive processing of non-emotional information [9]. By engaging both emotional and cognitive processing through a dual-task parallel structure, the emotional Stroop paradigm provides insights into attentional bias and cognitive processing mechanisms in response to emotional stimuli [10]. It is a classic method for exploring the interaction between emotion and cognition.
In this experiment, the emotional Stroop task was first used to screen 37 participants who demonstrated an emotional Stroop effect from the total pool of recruited college students. These 37 participants were then assessed using the Self-Rating Depression Scale (SDS) and the Patient Health Questionnaire-9 (PHQ-9) to determine the prevalence of depressive disorders and to verify the validity of the emotional Stroop effect in identifying such conditions.
The results showed that among the 37 participants with an emotional Stroop effect, the SDS detected 18 with mild depression, 10 with moderate depression, 2 with severe depression, and 7 without depression. Combining mild to severe cases yielded 30 individuals, accounting for 81.08% of the total, indicating an overall depression detection rate of 81.08% by the SDS among participants showing the emotional Stroop effect. Similarly, the PHQ-9 identified 17 with mild depression, 8 with moderate depression, 2 with moderate-to-severe depression, 2 with severe depression, and 8 without depression, resulting in an overall detection rate of 78.38%.
To further validate the effectiveness of the emotional Stroop effect in identifying depressive disorders among college students, correlation analyses were conducted between the emotional Stroop results and those of the SDS and PHQ-9. The findings revealed a significant correlation between the emotional Stroop effect and the SDS results (r = 0.757, p < 0.01), as well as with the PHQ-9 results (r = 0.739, p < 0.01). These results confirm that the emotional Stroop effect has significant criterion-related validity in identifying depressive disorders among college students.
In addition, the secondary screening results from the SDS and PHQ-9 indicated that mild and moderate depression were the predominant forms among the students. The SDS identified 28 participants (75.68%) with mild or moderate depression, while the PHQ-9 identified 25 participants (67.57%) in these categories—both exceeding half of the total number of students identified with depression by the Stroop experiment. Only two participants (5.41%) were classified as having severe or moderate-to-severe depression. This aligns with observations from practical counseling, where severe depressive disorders are relatively rare among college students. Moreover, results from both the SDS and PHQ-9 indicated that depressive disorders among college students are primarily characterized by depressive mood, somatic symptoms (such as sleep disturbances, appetite loss, constipation, and fatigue), and cognitive impairments (including poor concentration, memory decline, and negative thinking). A few students with severe depression exhibited suicidal ideation or tendencies. These findings highlight the importance of university mental health education and counseling programs, especially for students showing signs of suicidal thoughts or behaviors.
This study further confirms that college students with depressive emotions tend to exhibit cognitive structures biased toward negative evaluation and interpretation of information, and they preferentially process information congruent with their emotional state [11-14]. This insight provides valuable implications for psychological interventions in depressive disorders.
It is also noteworthy that although some students’ SDS and PHQ-9 scores fell below the clinical cutoff for depression, several of them displayed partial positive symptoms. These individuals may fall within the subthreshold depression range and could potentially develop full depressive disorders if not given timely intervention. Therefore, special attention should be given to this group in university mental health education and counseling.
5. Conclusion
This study verified the effectiveness of the emotional Stroop effect in identifying depressive disorders among college students. The results demonstrate that the emotional Stroop effect is an effective method for identifying depressive disorders and serves as a valuable supplement to traditional scale-based screening approaches.
References
[1]. National Health Commission Medical Administration and Medical Reform Bureau. Standards for the Diagnosis and Treatment of Mental Disorders [M]. Beijing: People’s Medical Publishing House, 2020.
[2]. Du Zhaoyun, Wang Keqin. Epidemiological Survey on Depression among 1, 597 College Students [J].Chinese Journal of Behavioral Medicine Science, 1999, 8(3): 172-173.
[3]. Li Tong. A Study on Depression and Its Related Factors among College Students [J].Social Psychological Science, 2008, 23(100): 547-553.
[4]. Cui Qingxia, Wang Zaixiang. Investigation and Analysis on the Status and Influencing Factors of Depression among College Students [J].China Health Administration, 2014, 8: 629-630+633.
[5]. Wang Xiangdong. Manual for Psychological Health Scale Assessment (Revised Edition) [M].Chinese Journal of Mental Health, 1999: 194-200.
[6]. Li Lingjiang, Ma Xin (Eds.). Guidelines for the Prevention and Treatment of Depressive Disorders in China (2nd Edition) [M]. Beijing: Chinese Medical Multimedia Press, 2015.
[7]. Chen Yuchen. The Role of the Emotional Stroop Effect in the Identification of Depression Disorders among College Students [D]. Tianjin University of Sport, 2022.
[8]. Liang Lifu. An Experimental Study on the Emotional Stroop Effect among College Students [J].Journal of Tianjin Medical University, 2009, 15(3): 512-514.
[9]. Frank, P., McKenna, D., Dinkar, S. Intrusive Cognitions: An Investigation of the Emotional Stroop Task [J].Journal of Experimental Psychology, 1995, 21(6): 1595-1607.
[10]. MacLeod, C., Mathews, A., Tatar, P. Attentional Bias in Emotional Disorders [J].Journal of Abnormal Psychology, 1986, 95: 15-20.
[11]. Lichtenstein-Vidne, L., Okon-Singer, H., Cohen, N., et al. Attentional Bias in Clinical Depression and Anxiety: The Impact of Emotional and Non-emotional Distracting Information [J].Biological Psychology, 2017, 122: 4-12.
[12]. Bradley, B.P., Mogg, K., Lee, S.C. Attentional Biases Toward Negative Information in Induced and Naturally Occurring Dysphoria [J].Behaviour Research and Therapy, 1997, 35(16): 911-927.
[13]. Platt, B., Murphy, S.E., Lau, J.Y. The Association between Negative Attention Biases and Symptoms of Depression in a Community Sample of Adolescents [J]. PeerJ, 2015, 3: e1372.
[14]. Fox, R., Dutton, K. Attentional Bias for Threat: Evidence for Delayed Disengagement from Emotional Faces [J].Cognition and Emotion, 2002, 16(3): 355-379.
Cite this article
Chen,Y.;Sun,Y.;Liang,L. (2025). A confirmatory experimental study on the emotional Stroop effect in identifying depressive disorders among college students. Advances in Social Behavior Research,16(8),192-197.
Data availability
The datasets used and/or analyzed during the current study will be available from the authors upon reasonable request.
Disclaimer/Publisher's Note
The statements, opinions and data contained in all publications are solely those of the individual author(s) and contributor(s) and not of EWA Publishing and/or the editor(s). EWA Publishing and/or the editor(s) disclaim responsibility for any injury to people or property resulting from any ideas, methods, instructions or products referred to in the content.
About volume
Journal:Advances in Social Behavior Research
© 2024 by the author(s). Licensee EWA Publishing, Oxford, UK. This article is an open access article distributed under the terms and
conditions of the Creative Commons Attribution (CC BY) license. Authors who
publish this series agree to the following terms:
1. Authors retain copyright and grant the series right of first publication with the work simultaneously licensed under a Creative Commons
Attribution License that allows others to share the work with an acknowledgment of the work's authorship and initial publication in this
series.
2. Authors are able to enter into separate, additional contractual arrangements for the non-exclusive distribution of the series's published
version of the work (e.g., post it to an institutional repository or publish it in a book), with an acknowledgment of its initial
publication in this series.
3. Authors are permitted and encouraged to post their work online (e.g., in institutional repositories or on their website) prior to and
during the submission process, as it can lead to productive exchanges, as well as earlier and greater citation of published work (See
Open access policy for details).
References
[1]. National Health Commission Medical Administration and Medical Reform Bureau. Standards for the Diagnosis and Treatment of Mental Disorders [M]. Beijing: People’s Medical Publishing House, 2020.
[2]. Du Zhaoyun, Wang Keqin. Epidemiological Survey on Depression among 1, 597 College Students [J].Chinese Journal of Behavioral Medicine Science, 1999, 8(3): 172-173.
[3]. Li Tong. A Study on Depression and Its Related Factors among College Students [J].Social Psychological Science, 2008, 23(100): 547-553.
[4]. Cui Qingxia, Wang Zaixiang. Investigation and Analysis on the Status and Influencing Factors of Depression among College Students [J].China Health Administration, 2014, 8: 629-630+633.
[5]. Wang Xiangdong. Manual for Psychological Health Scale Assessment (Revised Edition) [M].Chinese Journal of Mental Health, 1999: 194-200.
[6]. Li Lingjiang, Ma Xin (Eds.). Guidelines for the Prevention and Treatment of Depressive Disorders in China (2nd Edition) [M]. Beijing: Chinese Medical Multimedia Press, 2015.
[7]. Chen Yuchen. The Role of the Emotional Stroop Effect in the Identification of Depression Disorders among College Students [D]. Tianjin University of Sport, 2022.
[8]. Liang Lifu. An Experimental Study on the Emotional Stroop Effect among College Students [J].Journal of Tianjin Medical University, 2009, 15(3): 512-514.
[9]. Frank, P., McKenna, D., Dinkar, S. Intrusive Cognitions: An Investigation of the Emotional Stroop Task [J].Journal of Experimental Psychology, 1995, 21(6): 1595-1607.
[10]. MacLeod, C., Mathews, A., Tatar, P. Attentional Bias in Emotional Disorders [J].Journal of Abnormal Psychology, 1986, 95: 15-20.
[11]. Lichtenstein-Vidne, L., Okon-Singer, H., Cohen, N., et al. Attentional Bias in Clinical Depression and Anxiety: The Impact of Emotional and Non-emotional Distracting Information [J].Biological Psychology, 2017, 122: 4-12.
[12]. Bradley, B.P., Mogg, K., Lee, S.C. Attentional Biases Toward Negative Information in Induced and Naturally Occurring Dysphoria [J].Behaviour Research and Therapy, 1997, 35(16): 911-927.
[13]. Platt, B., Murphy, S.E., Lau, J.Y. The Association between Negative Attention Biases and Symptoms of Depression in a Community Sample of Adolescents [J]. PeerJ, 2015, 3: e1372.
[14]. Fox, R., Dutton, K. Attentional Bias for Threat: Evidence for Delayed Disengagement from Emotional Faces [J].Cognition and Emotion, 2002, 16(3): 355-379.