


1. Introduction
Extended lockdowns of COVID-19 led to widespread social problems, such as stressful living conditions and prolonged isolation, which triggered the development of mental illnesses, deepened health inequalities, and enhanced people’s attention on housing environment [1, 2]. Mental health inequality means that some social groups are more vulnerable to mental distress and disorders [3,4]. However, contemporary research on post-COVID-19 has largely focused on downstream factors of mental health inequality, such as healthcare, with little attention paid to upstream structural factors, such as housing, which play an important role in shaping mental health inequality [4, 5].
Housing-related factors can influence mental health across multiple dimensions [4]. Physical conditions are essential, such as housing quality and space. Issues like overcrowding and mould can not only compromise physical health but also contribute to psychological symptoms like fatigue or anxiety [6]. Economic insecurity is also a significant factor in housing, such as the affordability of housing and fuel poverty. Insecurity brought by low affordability and physical unhealth caused by fuel poverty often forms anxiety, which can lead to insecurity and the absence of well-being [4,6]. Lastly, socio-environmental factors, including neighbourhood deprivation, crime, and lack of public services, can further exacerbate mental health inequalities, though these aspects remain underexplored in current research [4,7].
Based on the background, the research aims to explore the extent to which housing factors contribute to mental health inequality across London boroughs in the post-COVID-19 context, so that the gap in upstream determinants of post-pandemic well-being can be addressed. It focuses on three dimensions of mental health inequalities: internal housing conditions, economic conditions and wider socio-spatial structures. To guide this investigation, the following hypotheses are proposed:
2. Data and methods
|
Dimension |
Variable |
Description |
Type |
Source |
|
Mental Health |
Life Satisfaction |
Life satisfaction is from the personal well-being table. This table includes four indicators: life satisfaction, happiness, worthwhile and anxiety. The personal well-being scale ranges from 0 to 10, where 0 signifies an individual not experiencing the specific measure at all and 10 represents experiencing it to the highest level. In this study, life satisfaction was used to represent the degree of mental health inequality. |
Dependent |
Trust for London (2022) [8] |
|
Housing Conditions |
Overcrowding Rate (%) |
% of household accommodation has sufficient space by borough |
Independent |
Greater London Authority (2021) [9] |
|
Housing Conditions |
Housing_Quality(%) |
% of homes meeting at least 'Good’ standard by borough (based on Care Quality Commission Rating) |
Independent |
Greater London Authority (2021) [9] |
|
Economic Insecurity |
Fuel_Poverty(%) |
% of households in fuel poverty by borough |
Independent |
Department for Energy Security and Net Zero (2022) [10] |
|
Economic Insecurity |
Housing_Ability(%) |
% of house prices to earnings by borough This is a key indicator of housing affordability in London boroughs. The ratio is calculated by dividing the average house price by the median income of a borough. |
Independent |
Office for National Statistics (2024) [11] |
|
Socio-environmental factor |
IMD_Score (Index of Multiple Deprivation average score) |
IMD has been aggregated in seven dimensions to score the relative deprivation of local authorities in the UK. In this study, a borough-level 'average score’ was used to reflect inequalities in mental health resulting from social environment at the district level. |
Independent |
Greater London Authority (2019) [12] |
|
Labor&Income |
Income_Equality |
% of earning above the London minimum wage by borough |
Control |
Greater London Authority (2021) [9] |
|
Labor&Income |
Unemployment |
% of unemployment per borough for 16-64 year olds in 2021 |
Control |
Office for National Statistics (2024) [13] |
The data sources of the study are in Table 1. Most data in this study were collected between 2021 and 2022 due to the post-pandemic research context. This period was the peak of the COVID-19 crisis with high housing stress and mental health [14]. Focusing on this point can capture the lasting impacts of the pandemic on housing and mental health inequalities. The analysis was conducted at the level of London borough, covering 33 boroughs (22 outer and 11 inner), ensuring spatial consistency and comparability across key variables [15].
2.1. Variable selection
This study selected variables across three dimensions to investigate the relationship between housing and mental health inequality. Internal housing conditions (overcrowding rate and housing quality), economic insecurity (housing affordability and fuel poverty), and social environment (Index of Multiple Deprivation (IMD). IMD reflected deprivation across seven dimensions (income, employment, health, education, housing and services, environment, and crime) [16], which allowed for more systematic assessments of disadvantaged social environments and their impact on mental health inequality. The dependent variable was life satisfaction, a widely used and stable proxy for mental health [17].
Finally, to prevent extraneous variables from distorting the relationship between housing and mental health inequalities [18], this study included two control variables, unemployment and income equality, because the unemployment and income may affect mental health through stress and economic insecurity [19, 20].
2.2. Method
This study used R and R Studio to conduct descriptive and statistical analysis and construct multiple regressions for correlation analysis through R packages, such as Simple Features, ggplot2, dplyr, and car [21-23]. Firstly, some missing values were deleted since the fewer missing values. Then, scatter plots [24]were used for descriptive analysis, illustrating the distribution and relationship of variables. Then, Pearson correlation coefficient and the clustered heatmap were used to assess the correlation between the five variables of the three housing dimensions and life satisfaction [24, 25]. Furthermore, multiple linear regression models were constructed of variables related to housing and life satisfaction, and Variance Inflation Factor (VIF) and residual diagnostics were used to assess the validity of the models [26]. At this step, by diagnosing the model, this study identified and removed outliers, and then introduced control variables to enhance the robustness of the multiple regression model Finally, spatial visualization [27] was used to compare life satisfaction with key predictors.
3. Results and analysis
3.1. Descriptive analysis
Firstly, this study used scatterplots to visualise the relationship between the three dimensions of the variables (housing conditions, economic insecurity, and socio-environmental factors) and life satisfaction using scatterplots [24].
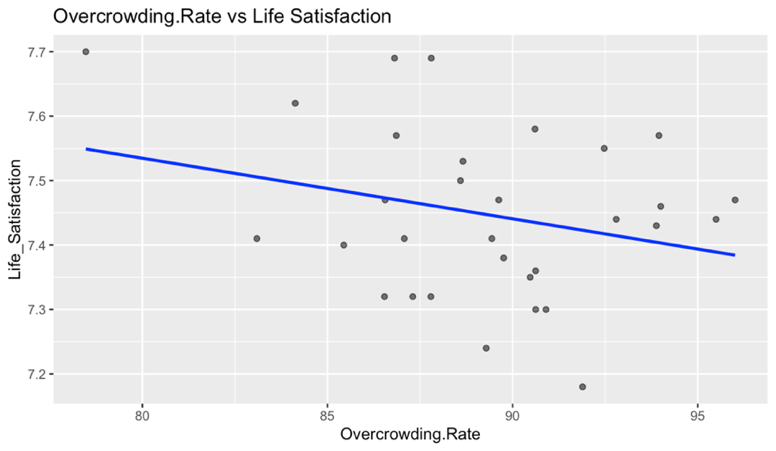
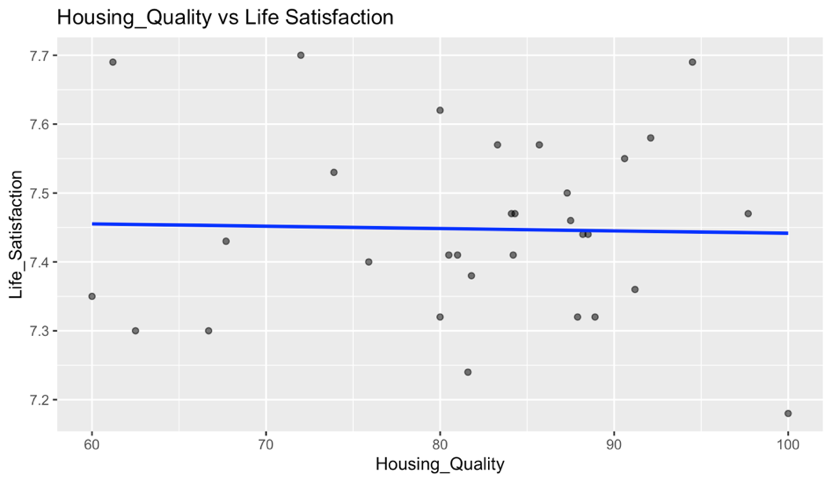
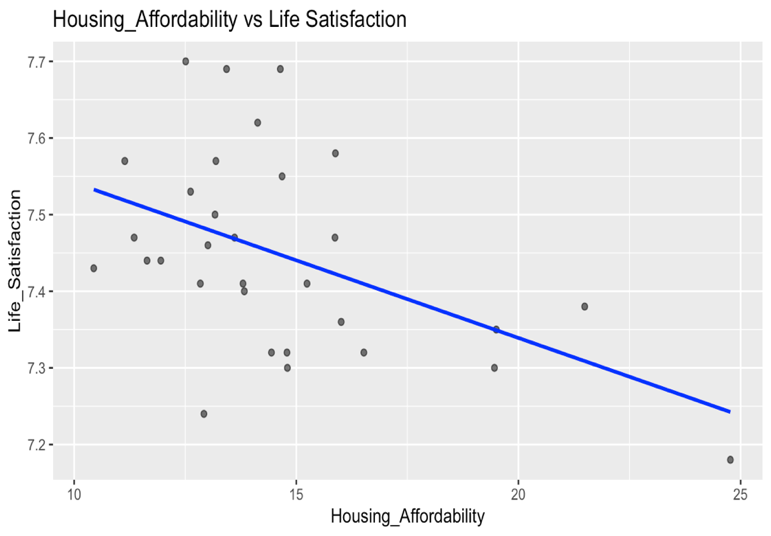
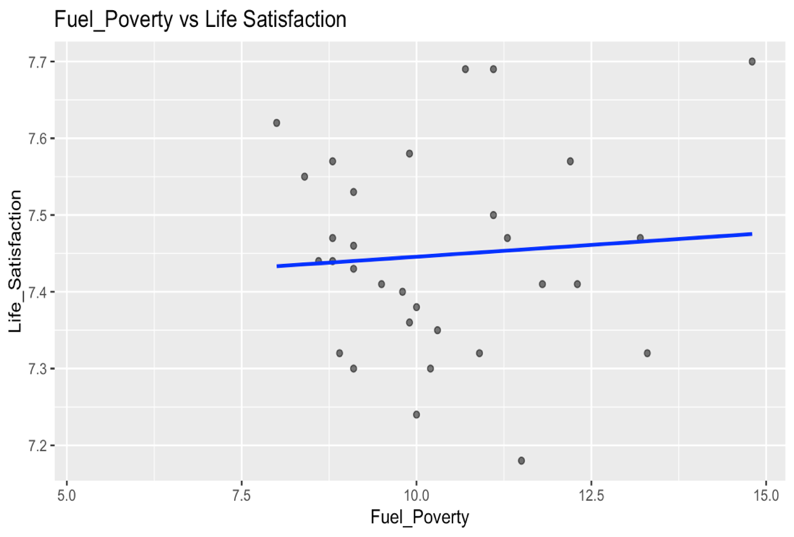
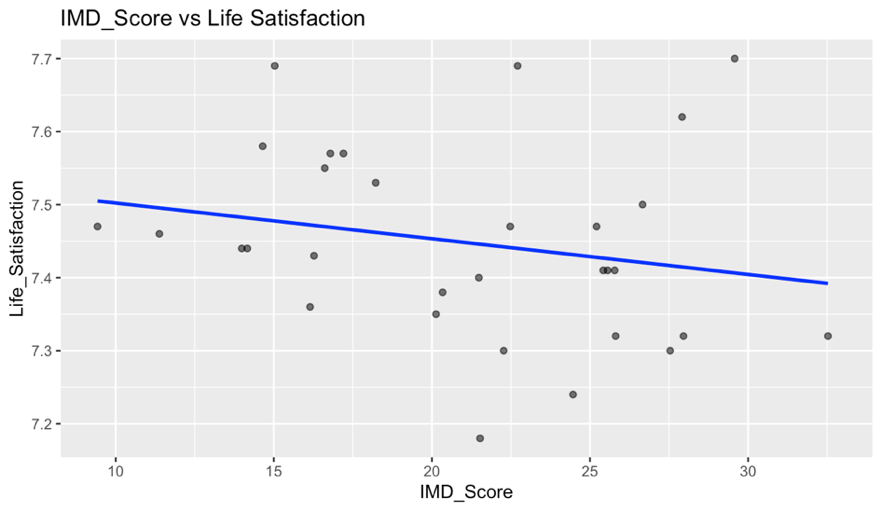
For the housing conditions, based on Figures 1 and 2, the overcrowding rate and life satisfaction were negatively correlated, indicating that boroughs with more crowded housing tend to report lower subjective well-being. In contrast, no clear pattern was observed between housing quality and life satisfaction. The second dimension was economic security, categorised as housing affordability and fuel poverty. Figures 3 and 4 showed that housing affordability and life satisfaction were negatively correlated, suggesting that areas with less affordable housing tended to report lower well-being. Unexpectedly, fuel poverty and life satisfaction were slightly positively correlated, which contradicted existing literature findings and indicated the need for further investigation. The third dimension was the social environment. Figure 5 showed that the average IMD score and life satisfaction were negatively correlated, indicating that residents in more deprived boroughs reported lower levels of subjective well-being.
3.2. Correlation analysis
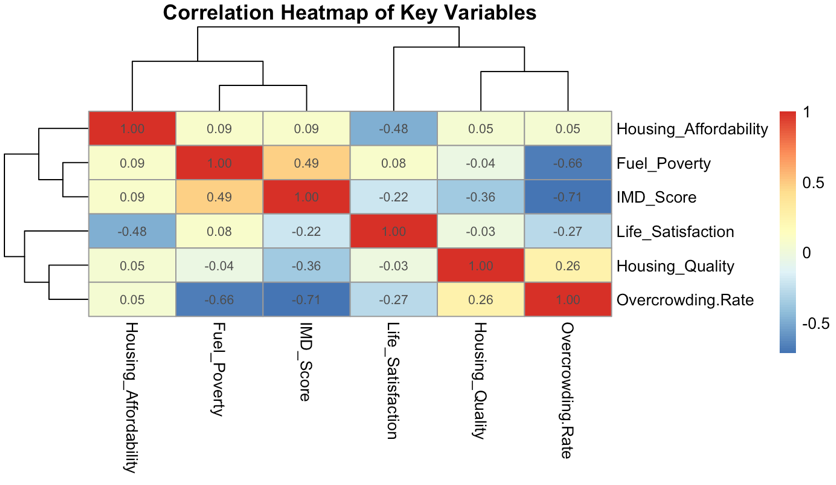
To quantify the strength and direction of these associations, Pearson correlation coefficients (r) were calculated (Table 2) [24]. Only housing affordability showed a statistically significant negative correlation with life satisfaction (r = -0.479, p = 0.0064<0,01), suggesting that affordability was the most influential economic factor in the dataset. Other variables, including overcrowding rates, fuel poverty, IMD scores, and housing quality, were not statistically significant (all P>0.05). A clustered heatmap (Figure 6) was also used to visualise intercorrelations between the independent variables (McKenna, 2016). A strong correlation was found between the overcrowding rate, fuel poverty (r=-0.66) and IMD score (r=-0.71), indicating potential multicollinearity in the regression model.
|
Variable |
Correlation |
p_value |
CI_lower |
CI_upper |
|
Housing_Quality |
-0.027 |
0.8863 |
-0.378 |
0.331 |
|
Overcrowding.Rate |
-0.270 |
0.1419 |
-0.570 |
0.093 |
|
Housing_Affordability |
-0.479 |
0.0064 |
-0.712 |
-0.150 |
|
Fuel_Poverty |
0.076 |
0.6830 |
-0.286 |
0.419 |
|
IMD_Score |
-0.216 |
0.2438 |
-0.530 |
0.150 |
3.3. Multiple regression
Correlation analysis only reveals individual relationships, but multiple linear regression can evaluate the joint effects of all independent variables on life satisfaction while controlling for unemployment and income equality [28].
As shown in Table 3 and Table 4, the overall model was statistically significant (p = 0.000749 < 0.01), explaining approximately 46.3% of the variance in life satisfaction (adjusted R² = 0.4626). Looking at the three dimensions of the variable, housing conditions: overcrowding rate (β = -0.0287, p = 0.0014<0.01) was a significant negative predictor of life satisfaction. Specifically, β = -0.0287 indicated that a 1 percentage point increase in overcrowding was associated with a 0.0287 decrease in life satisfaction score. In contrast, housing quality (p = 0.6274 > 0.05) was not statistically significant, indicating that this predictor was not significantly related to life satisfaction. Economic Security: Housing affordability (β = -0.0150, p = 0.0172<0.05) showed a statistically significant negative correlation, whereas fuel poverty (p = 0.6927 > 0.05) was not statistically significant, indicating that this predictor was not significantly related to life satisfaction. Social environment: The IMD score (β = -0.0174, p=0.0009 < 0.01) was highly significant and negatively associated with life satisfaction.
In summary, only the overcrowding rate, housing affordability, and IMD score had significant effects on life satisfaction, while fuel poverty and housing quality were not significant. This means that the current model does not meet the assumption that all three factors are related to the level of mental health inequality. Therefore, the alternative hypothesis
|
Variable |
Estimate |
Std. Error |
t value |
Pr(>|t|) |
Significance |
|
(Intercept) |
10.7277792 |
0.8470478 |
12.665 |
2.24e-12 |
*** |
|
Overcrowding.Rate |
-0.0286854 |
0.0080158 |
-3.579 |
0.001449 |
** |
|
Housing_Quality |
-0.0009131 |
0.0018580 |
-0.491 |
0.627394 |
|
|
Fuel_Poverty |
-0.0059371 |
0.0148505 |
-0.400 |
0.692704 |
|
|
Housing_Affordability |
-0.0149712 |
0.0058648 |
-2.553 |
0.017175 |
* |
|
IMD_Score |
-0.0172378 |
0.0045780 |
-3.765 |
0.000903 |
*** |
|
Statistic |
Value |
|
Residual standard error |
0.09614 (on 25 DF) |
|
Observations deleted due to missingness |
2 |
|
Multiple R-squared |
0.5521 |
|
Adjusted R-squared |
0.4626 |
|
F-statistic |
6.164 (on 5 and 25 DF) |
|
p-value |
0.000749 |
3.4. Model diagnostics and refinement
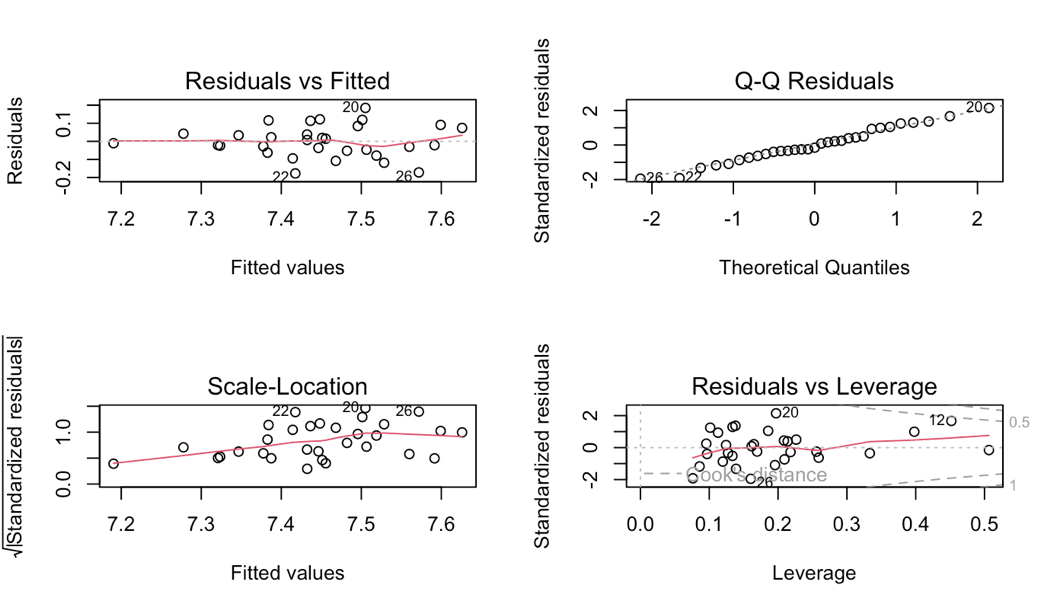
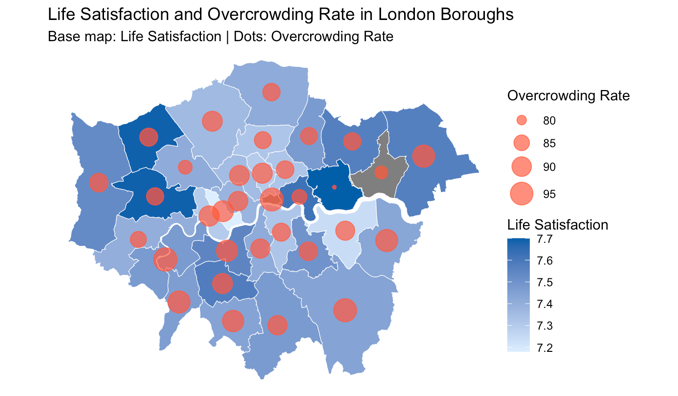
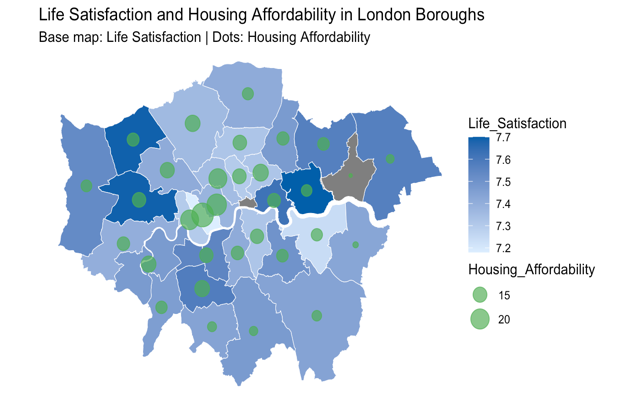
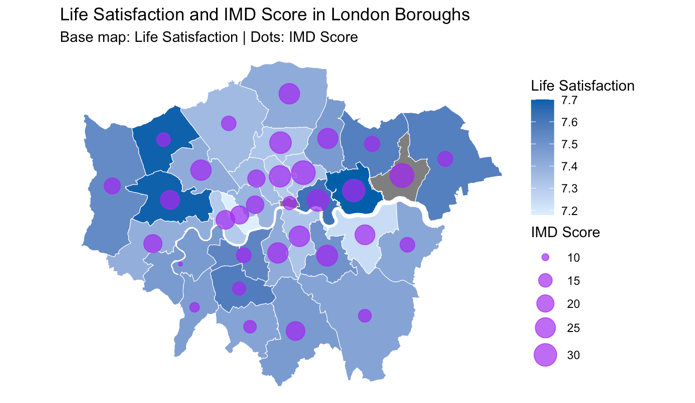
To ensure robustness, diagnostic tests were performed. Multiple covariance and outlier problems need to be checked in multiple regression to ensure that the regression results are accurately determined [26]. According to Table 5, there is no significant multicollinearity problem in the model (VIF <5). Meanwhile, residual plots (Figure 7) showed that the assumptions of linearity and homoscedasticity were satisfied. However, two outliers (boroughs 12 and 20) were identified and removed to improve the model. After removing the outliers, the updated regression (Table 6 and 7) achieved an adjusted R² = 0.505 (p = 0.002). Overcrowding rate, housing affordability, and IMD score remained significant predictors of lower life satisfaction. It can also be reflected in figures 8, 9 and 10. Figure 8 showed that areas with low life satisfaction and high overcrowding rates were concentrated in inner London, suggesting that high-density housing harms mental health. Figure 9 showed that boroughs with poorer housing affordability (larger percentages) were associated with reduced life satisfaction. Figure 10 showed that boroughs with higher IMD scores (higher levels of deprivation) tended to have lower life satisfaction.
3.5. Summary of findings
The regression results indicate that overcrowding, housing affordability, and deprivation (IMD score) are robust predictors of life satisfaction. However, this study explores the common relationship between all three dimensions of housing conditions, economic insecurity, and social environment and mental health inequality, which means this study requires that the p-value of all factors be less than 0.05 to meet the hypothesis in this research. However, housing quality and fuel poverty still did not reflect a significant relationship with life satisfaction (p > 0.05). This means that the study is still unable to recognise the
This does not exactly match the findings of the literature, which consistently emphasise the strong influence of physical housing conditions, economic stability, and the social environment on mental health outcomes [4, 5, 7]. One possible reason is the scale of analysis [29], concentrating on data at the London borough level rather than the more granular ward level, which may mask inequalities within boroughs. Other limitations include the relatively small sample size (33 London boroughs), missing data points for some indicators, and confounding factors (such as educational level), which may have weakened the statistical and analytical power for the multi-dimensional variables. Finally, the analysis is based on a linear regression framework and cross-sectional analysis, which may not fully capture the potentially non-linear relationship between housing and mental health and infer causality [30, 31]. To enhance the credibility of the model, future studies should use more granular data (e.g., London Lower Super Output Area or ward level) and expand the range of indicators.
|
Variable |
VIF |
|
Overcrowding.Rate |
2.957969 |
|
Housing_Quality |
1.190828 |
|
Fuel_Poverty |
1.893866 |
|
Housing_Affordability |
1.072247 |
|
IMD_Score |
2.277975 |
|
Variable |
Estimate |
Std. Error |
t value |
Pr(>|t|) |
Significance |
|
(Intercept) |
9.317509 |
0.965118 |
9.654 |
5.7e-09 |
*** |
|
Overcrowding.Rate |
-0.023089 |
0.008565 |
-2.696 |
0.013910 |
* |
|
Housing_Quality |
0.001675 |
0.001903 |
0.880 |
0.389295 |
|
|
Fuel_Poverty |
0.018730 |
0.017665 |
1.060 |
0.301647 |
|
|
Housing_Affordability |
-0.017717 |
0.007083 |
-2.501 |
0.021170 |
* |
|
IMD_Score |
-0.016635 |
0.003992 |
-4.167 |
0.000476 |
*** |
|
Unemployment |
-0.017877 |
0.011776 |
-1.518 |
0.144635 |
|
|
Income_Equality |
0.006845 |
0.005806 |
1.179 |
0.252278 |
|
Statistic |
Value |
|
Residual standard error |
0.08069 on 20 degrees of freedom |
|
Observations deleted due to missingness |
3 |
|
Multiple R-squared |
0.6333 |
|
Adjusted R-squared |
0.505 |
|
F-statistic |
4.935 on 7 and 20 DF |
|
p-value |
0.002269 |
4. Conclusion
This study investigated the relationship between housing-related factors and mental health inequality, as measured by life satisfaction across the post-COVID-19 context in London boroughs. Through a multidimensional framework, the analysis considered five key variables across three domains: internal housing conditions, economic insecurity, and socio-environmental disadvantage. The final regression model revealed that overcrowding, housing affordability and IMD scores were statistically significant and negatively associated with life satisfaction. By contrast, fuel poverty and housing quality were not significant predictors. Therefore, while the overall model explained approximately 50 % of the variation in life satisfaction, it did not support the hypothesis that all three housing dimensions significantly influence mental health inequality in this study.
This result is not entirely consistent with the literature's emphasis on the impact of material housing conditions, economic stability and social environment on mental health. From a data perspective, the reasons for this result lie in the small scale of the analyzed data, the scarcity of data samples, the absence of data, and the confusion of other factors. These possible factors have greatly weakened the model's statistical and analytical capabilities. In addition, from the perspective of the analysis model, the linear regression framework and cross-sectional analysis may not be able to fully capture the potential nonlinear relationship between housing and mental health and infer the causal relationship. Therefore, in the future, improvements can be made in terms of the quantity of data and the quality of the model to enhance accuracy.
Whilst the overall model does not prove the hypotheses of this study, the contribution of individual variables such as overcrowding rates, housing affordability and IMD scores to mental health inequalities still demonstrates that the dimensions of housing in influencing mental health inequalities are complex and multidimensional. These findings in the post-COVID-19 highlight the importance of addressing structural housing inequalities in the post-urban context since safe, affordable and dignified living conditions are more important than ever.
References
[1]. Bil, J. S., Buława, B., & Świerzawski, J. (2021). Mental health and the city in the post-COVID-19 era.Sustainability, 13(14), 7533. https: //doi.org/10.3390/su13147533
[2]. Ghimire, J., Carswell, A. T., Ghimire, R., & Turner, P. R. (2021). The impact of US housing type and residential living situations on mental health during COVID-19.International Journal of environmental research and public health, 18(16), 8281. https: //doi.org/10.3390/ijerph18168281
[3]. Elliott, L., & Masters, H. (2009). Mental health inequalities and mental health nursing.Journal of Psychiatric and Mental Health Nursing, 16(8), 762-771. https: //doi-org.libproxy.ucl.ac.uk/10.1111/j.1365-2850.2009.01453.x
[4]. Evans, G. W., Wells, N. M., & Moch, A. (2003). Housing and mental health: a review of the evidence and a methodological and conceptual critique.Journal of Social Issues, 59(3), 475-500. https: //doi.org/10.1111/1540-4560.00074
[5]. Gibson, M., Petticrew, M., Bambra, C., Sowden, A. J., Wright, K. E., & Whitehead, M. (2011). Housing and health inequalities: a synthesis of systematic reviews of interventions aimed at different pathways linking housing and health.Health & place, 17(1), 175-184. https: //doi.org/10.1016/j.healthplace.2010.09.011
[6]. Borrell, C., Novoa, A. M., & Perez, K. (2023). Housing conditions, health and health inequalities.Frontiers in Environmental Health, 1, 1080846. https: //doi.org/10.3389/fenvh.2022.1080846
[7]. Marí-Dell’Olmo, M., Novoa, A. M., Camprubí, L., Peralta, A., Vásquez-Vera, H., Bosch, J., ... & Borrell, C. (2017). Housing policies and health inequalities.International Journal of Health Services, 47(2), 207-232. https: //doi-org.libproxy.ucl.ac.uk/10.1177/0020731416684292
[8]. Trust for London. (2022).Wellbeing. Retrieved May 3, 2025, from https: //trustforlondon.org.uk/data/wellbeing/#: ~: text=The%20average%20anxiety%20score%20increased, of%20the%20COVID%2D19%20pandemic
[9]. Greater London Authority (GLA). (2021). London Wellbeing and Sustainability Measure.London Datastore. Retrieved May 3, 2025, from https: //data.london.gov.uk/dataset/london-wellbeing-and-sustainability-measure
[10]. Department for Energy Security and Net Zero. (2024). Sub-regional fuel poverty data 2024 (2022 data). GOV.UK. Retrieved May 3, 2025, from https: //www.gov.uk/government/statistics/sub-regional-fuel-poverty-data-2024-2022-data
[11]. Office for National Statistics (2024). Ratio of House Prices to Earnings, Borough.London Datastore. Retrieved May 3, 2025, from https: //data.london.gov.uk/dataset/ratio-house-prices-earnings-borough
[12]. Greater London Authority. (2019). Indices of Deprivation 2019.London Datastore. Retrieved May 3, 2025, from https: //data.london.gov.uk/dataset/indices-of-deprivation
[13]. Office for National Statistics (ONS). (2024).Nomis – Official Labour Market Statistics. Retrieved May 3, 2025, from https: //www.nomisweb.co.uk/
[14]. Akbari, P., Yazdanfar, S. A., Hosseini, S. B., & Norouzian-Maleki, S. (2021). Housing and mental health during outbreak of COVID-19.Journal of Building Engineering, 43, 102919. https: //doi.org/10.1016/j.jobe.2021.102919
[15]. Petris, P., Dotsis, G., & Alexakis, P. (2022). Bubble tests in the London housing market: A borough level analysis.International Journal of Finance & Economics, 27(1), 1044-1063. https: //doi-org.libproxy.ucl.ac.uk/10.1002/ijfe.2199
[16]. Watson, V., Dibben, C., Cox, M., Atherton, I., Sutton, M., & Ryan, M. (2019). Testing the expert based weights used in the UK’s index of multiple deprivation (IMD) against three preference-based methods.Social Indicators Research, 144(3), 1055-1074. https: //doi.org/10.1007/s11205-018-02054-z
[17]. Fergusson, D. M., McLeod, G. F. H., Horwood, L. J., Swain, N. R., Chapple, S., & Poulton, R. (2015). Life satisfaction and mental health problems (18 to 35 years).Psychological Medicine, 45(11), 2427–2436. doi: 10.1017/S0033291715000422.
[18]. Bernerth, J. B., & Aguinis, H. (2016). A critical review and best‐practice recommendations for control variable usage.Personnel psychology, 69(1), 229-283. https: //doi.org/10.1111/peps.12103
[19]. Yao, R., & Wu, W. (2021). Mental disorders associated with COVID-19 related unemployment.Applied Research in Quality of Life, 17(2), 949. doi: 10.1007/s11482-021-09950-6
[20]. Donnelly, R., & Farina, M. P. (2021). How do state policies shape experiences of household income shocks and mental health during the COVID-19 pandemic?.Social Science & Medicine, 269, 113557. https: //doi.org/10.1016/j.socscimed.2020.113557
[21]. Team, T. R. D. C. (2025). The R project for statistical computing. Retrieved May 3, 2025, from https: //www.r-project.org/
[22]. Allaire, J. (2012). RStudio: integrated development environment for R. Boston,MA, 770(394), 165-171. https: //www.r-project.org/conferences/useR-2011/abstracts/180111-allairejj.pdf .
[23]. Hair, J. F., Hult, G. T. M., Ringle, C. M., Sarstedt, M., Danks, N. P., & Ray, S. (2021). Overview of R and RStudio. Partial least squares structural equation modeling (PLS-SEM) using R, 31. https: //doi.org/10.1007/978-3-030-80519-7
[24]. McKenna, S., Meyer, M., Gregg, C., & Gerber, S. (2016). s-CorrPlot: an interactive scatterplot for exploring correlation.Journal of Computational and Graphical Statistics, 25(2), 445-463. https: //doi.org/10.1080/10618600.2015.1021926
[25]. Sedgwick, P. (2012). Pearson’s correlation coefficient. Bmj, 345. https: //doi.org/10.1136/bmj.e4483
[26]. Osemeke, R. F., Igabari, J. N., & Christian, N. D. (2024). Detection and correction of violations of linear model assumptions by means of residuals.Journal of Science Innovation and Technology Research. https: //africanscholarpub.com/ajsitr/article/view/139
[27]. Ślusarski, M., & Jurkiewicz, M. (2019). Visualisation of spatial data uncertainty. A case study of a database of topographic objects.ISPRS International Journal of Geo-Information, 9(1), 16. https: //doi.org/10.3390/ijgi9010016
[28]. York, R. (2012). Residualization is not the answer: Rethinking how to address multicollinearity.Social science research, 41(6), 1379-1386. https: //doi.org/10.1016/j.ssresearch.2012.05.014
[29]. Labib, S. M., Lindley, S., & Huck, J. J. (2020). Spatial dimensions of the influence of urban green-blue spaces on human health: A systematic review.Environmental research, 180, 108869. https: //doi.org/10.1016/j.envres.2019.108869
[30]. Cortina, J. M. (1993). Interaction, nonlinearity, and multicollinearity: Implications for multiple regression.Journal of Management, 19(4), 915-922. https: //doi.org/10.1016/0149-2063(93)90035-L
[31]. Kesmodel, U. S. (2018). Cross‐sectional studies–what are they good for?.Acta obstetricia et gynecologica Scandinavica, 97(4), 388-393. https: //doi.org/10.1111/aogs.13331
Cite this article
Li,X. (2025). Housing and mental health inequality in post-COVID-19 London. Advances in Social Behavior Research,16(10),20-30.
Data availability
The datasets used and/or analyzed during the current study will be available from the authors upon reasonable request.
Disclaimer/Publisher's Note
The statements, opinions and data contained in all publications are solely those of the individual author(s) and contributor(s) and not of EWA Publishing and/or the editor(s). EWA Publishing and/or the editor(s) disclaim responsibility for any injury to people or property resulting from any ideas, methods, instructions or products referred to in the content.
About volume
Journal:Advances in Social Behavior Research
© 2024 by the author(s). Licensee EWA Publishing, Oxford, UK. This article is an open access article distributed under the terms and
conditions of the Creative Commons Attribution (CC BY) license. Authors who
publish this series agree to the following terms:
1. Authors retain copyright and grant the series right of first publication with the work simultaneously licensed under a Creative Commons
Attribution License that allows others to share the work with an acknowledgment of the work's authorship and initial publication in this
series.
2. Authors are able to enter into separate, additional contractual arrangements for the non-exclusive distribution of the series's published
version of the work (e.g., post it to an institutional repository or publish it in a book), with an acknowledgment of its initial
publication in this series.
3. Authors are permitted and encouraged to post their work online (e.g., in institutional repositories or on their website) prior to and
during the submission process, as it can lead to productive exchanges, as well as earlier and greater citation of published work (See
Open access policy for details).
References
[1]. Bil, J. S., Buława, B., & Świerzawski, J. (2021). Mental health and the city in the post-COVID-19 era.Sustainability, 13(14), 7533. https: //doi.org/10.3390/su13147533
[2]. Ghimire, J., Carswell, A. T., Ghimire, R., & Turner, P. R. (2021). The impact of US housing type and residential living situations on mental health during COVID-19.International Journal of environmental research and public health, 18(16), 8281. https: //doi.org/10.3390/ijerph18168281
[3]. Elliott, L., & Masters, H. (2009). Mental health inequalities and mental health nursing.Journal of Psychiatric and Mental Health Nursing, 16(8), 762-771. https: //doi-org.libproxy.ucl.ac.uk/10.1111/j.1365-2850.2009.01453.x
[4]. Evans, G. W., Wells, N. M., & Moch, A. (2003). Housing and mental health: a review of the evidence and a methodological and conceptual critique.Journal of Social Issues, 59(3), 475-500. https: //doi.org/10.1111/1540-4560.00074
[5]. Gibson, M., Petticrew, M., Bambra, C., Sowden, A. J., Wright, K. E., & Whitehead, M. (2011). Housing and health inequalities: a synthesis of systematic reviews of interventions aimed at different pathways linking housing and health.Health & place, 17(1), 175-184. https: //doi.org/10.1016/j.healthplace.2010.09.011
[6]. Borrell, C., Novoa, A. M., & Perez, K. (2023). Housing conditions, health and health inequalities.Frontiers in Environmental Health, 1, 1080846. https: //doi.org/10.3389/fenvh.2022.1080846
[7]. Marí-Dell’Olmo, M., Novoa, A. M., Camprubí, L., Peralta, A., Vásquez-Vera, H., Bosch, J., ... & Borrell, C. (2017). Housing policies and health inequalities.International Journal of Health Services, 47(2), 207-232. https: //doi-org.libproxy.ucl.ac.uk/10.1177/0020731416684292
[8]. Trust for London. (2022).Wellbeing. Retrieved May 3, 2025, from https: //trustforlondon.org.uk/data/wellbeing/#: ~: text=The%20average%20anxiety%20score%20increased, of%20the%20COVID%2D19%20pandemic
[9]. Greater London Authority (GLA). (2021). London Wellbeing and Sustainability Measure.London Datastore. Retrieved May 3, 2025, from https: //data.london.gov.uk/dataset/london-wellbeing-and-sustainability-measure
[10]. Department for Energy Security and Net Zero. (2024). Sub-regional fuel poverty data 2024 (2022 data). GOV.UK. Retrieved May 3, 2025, from https: //www.gov.uk/government/statistics/sub-regional-fuel-poverty-data-2024-2022-data
[11]. Office for National Statistics (2024). Ratio of House Prices to Earnings, Borough.London Datastore. Retrieved May 3, 2025, from https: //data.london.gov.uk/dataset/ratio-house-prices-earnings-borough
[12]. Greater London Authority. (2019). Indices of Deprivation 2019.London Datastore. Retrieved May 3, 2025, from https: //data.london.gov.uk/dataset/indices-of-deprivation
[13]. Office for National Statistics (ONS). (2024).Nomis – Official Labour Market Statistics. Retrieved May 3, 2025, from https: //www.nomisweb.co.uk/
[14]. Akbari, P., Yazdanfar, S. A., Hosseini, S. B., & Norouzian-Maleki, S. (2021). Housing and mental health during outbreak of COVID-19.Journal of Building Engineering, 43, 102919. https: //doi.org/10.1016/j.jobe.2021.102919
[15]. Petris, P., Dotsis, G., & Alexakis, P. (2022). Bubble tests in the London housing market: A borough level analysis.International Journal of Finance & Economics, 27(1), 1044-1063. https: //doi-org.libproxy.ucl.ac.uk/10.1002/ijfe.2199
[16]. Watson, V., Dibben, C., Cox, M., Atherton, I., Sutton, M., & Ryan, M. (2019). Testing the expert based weights used in the UK’s index of multiple deprivation (IMD) against three preference-based methods.Social Indicators Research, 144(3), 1055-1074. https: //doi.org/10.1007/s11205-018-02054-z
[17]. Fergusson, D. M., McLeod, G. F. H., Horwood, L. J., Swain, N. R., Chapple, S., & Poulton, R. (2015). Life satisfaction and mental health problems (18 to 35 years).Psychological Medicine, 45(11), 2427–2436. doi: 10.1017/S0033291715000422.
[18]. Bernerth, J. B., & Aguinis, H. (2016). A critical review and best‐practice recommendations for control variable usage.Personnel psychology, 69(1), 229-283. https: //doi.org/10.1111/peps.12103
[19]. Yao, R., & Wu, W. (2021). Mental disorders associated with COVID-19 related unemployment.Applied Research in Quality of Life, 17(2), 949. doi: 10.1007/s11482-021-09950-6
[20]. Donnelly, R., & Farina, M. P. (2021). How do state policies shape experiences of household income shocks and mental health during the COVID-19 pandemic?.Social Science & Medicine, 269, 113557. https: //doi.org/10.1016/j.socscimed.2020.113557
[21]. Team, T. R. D. C. (2025). The R project for statistical computing. Retrieved May 3, 2025, from https: //www.r-project.org/
[22]. Allaire, J. (2012). RStudio: integrated development environment for R. Boston,MA, 770(394), 165-171. https: //www.r-project.org/conferences/useR-2011/abstracts/180111-allairejj.pdf .
[23]. Hair, J. F., Hult, G. T. M., Ringle, C. M., Sarstedt, M., Danks, N. P., & Ray, S. (2021). Overview of R and RStudio. Partial least squares structural equation modeling (PLS-SEM) using R, 31. https: //doi.org/10.1007/978-3-030-80519-7
[24]. McKenna, S., Meyer, M., Gregg, C., & Gerber, S. (2016). s-CorrPlot: an interactive scatterplot for exploring correlation.Journal of Computational and Graphical Statistics, 25(2), 445-463. https: //doi.org/10.1080/10618600.2015.1021926
[25]. Sedgwick, P. (2012). Pearson’s correlation coefficient. Bmj, 345. https: //doi.org/10.1136/bmj.e4483
[26]. Osemeke, R. F., Igabari, J. N., & Christian, N. D. (2024). Detection and correction of violations of linear model assumptions by means of residuals.Journal of Science Innovation and Technology Research. https: //africanscholarpub.com/ajsitr/article/view/139
[27]. Ślusarski, M., & Jurkiewicz, M. (2019). Visualisation of spatial data uncertainty. A case study of a database of topographic objects.ISPRS International Journal of Geo-Information, 9(1), 16. https: //doi.org/10.3390/ijgi9010016
[28]. York, R. (2012). Residualization is not the answer: Rethinking how to address multicollinearity.Social science research, 41(6), 1379-1386. https: //doi.org/10.1016/j.ssresearch.2012.05.014
[29]. Labib, S. M., Lindley, S., & Huck, J. J. (2020). Spatial dimensions of the influence of urban green-blue spaces on human health: A systematic review.Environmental research, 180, 108869. https: //doi.org/10.1016/j.envres.2019.108869
[30]. Cortina, J. M. (1993). Interaction, nonlinearity, and multicollinearity: Implications for multiple regression.Journal of Management, 19(4), 915-922. https: //doi.org/10.1016/0149-2063(93)90035-L
[31]. Kesmodel, U. S. (2018). Cross‐sectional studies–what are they good for?.Acta obstetricia et gynecologica Scandinavica, 97(4), 388-393. https: //doi.org/10.1111/aogs.13331