


1 Introduction
Scholars frequently emphasize that mergers and acquisitions (M&A) not only influence the strategic direction of individual firms but are also vital to the overall health of industries and economies. The literature indicates that M&A activities significantly impact corporate performance, market structure, and competition. For instance, a critical review reveals how M&A affects corporate efficiency, ownership structures, and shareholder value, underscoring their profound economic implications. Blonigen and Pierce further analyze the effects of M&A on market power and efficiency, noting that while such activities can enhance operational efficiency, they may also lead to monopolistic behaviors, thereby affecting market competition and consumer welfare.
In emerging capital markets, the performance and motives behind M&A have also been extensively studied. Healy et al. found that corporate performance tends to improve following mergers, while Kiymaz and Baker examine the short-term performance, industry effects, and underlying motives of large-scale M&A, highlighting their influence on financial health and market behavior [1]. The Federal Trade Commission (FTC) provides additional evidence on M&A, focusing on its implications for market competition and consumer welfare, stressing the importance of regulatory oversight to curb potential anti-competitive practices.
In real-world markets, the impact of M&A is equally significant. M&A activities promote market consolidation, increasing industry concentration, reducing excess competition, and optimizing resource allocation. For example, the $69 billion merger of CVS Health and Aetna in 2018 created a healthcare giant with integrated services, enhancing market efficiency.
By integrating the technologies and resources of different companies, M&A fosters innovation, facilitates the introduction of new products and services, and elevates industry standards. Apple's $3 billion acquisition of Beats Electronics in 2014, for instance, spurred innovation in Apple's audio products and expanded its music streaming services.
M&A activities often involve substantial capital flows, boosting capital market activity and liquidity. The series of acquisitions by Alphabet Inc. (Google's parent company) illustrates how strategic M&A can leverage capital to drive growth and innovation across sectors.
Through M&A, companies can bolster their competitiveness, increase market share, and establish a more dominant market position. The 1999 merger of Exxon and Mobil for $81 billion created ExxonMobil, a leading energy company with enhanced competitive capabilities.
Successful M&A can stimulate corporate growth, drive development in related industries and regions, and positively influence overall economic development. The $79 billion acquisition of Time Warner Cable by Charter Communications in 2016 spurred growth in the telecommunications industry and related sectors.
An analysis of more than 50,000 U.S. firms reveals that M&A activity has played a prominent role in the market, with over 75% of firms involved in M&A since 1975, and this proportion increased between 1975 and 2005. Sales by companies engaged in M&A account for over 84% of the 50,000 firms studied, with this figure rising year after year. Key industries involved in M&A include healthcare services and semiconductors, with a growing number of firms in these sectors participating in M&A each year, as depicted in the graph below.
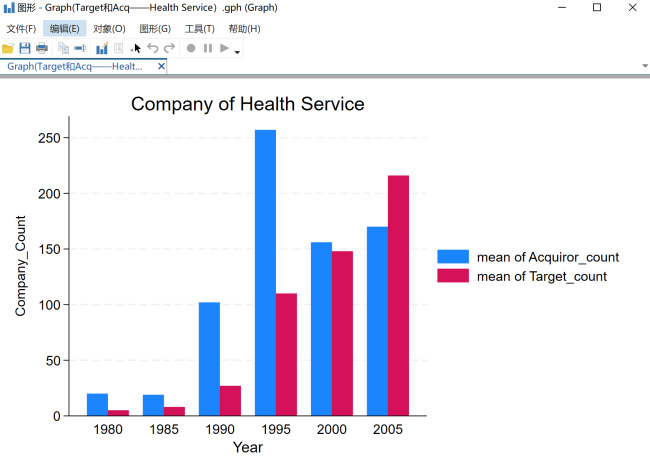
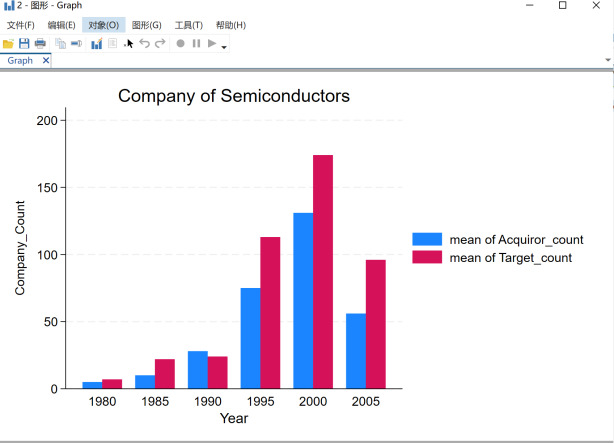
Panel 1 Panel 2
Figure 1. Number of companies involved in M&A in different industries
Note1: Data from compustata and MA7707 in wrds database
Note2: The horizontal coordinate is the year in five-year increments and the vertical coordinate is the number of companies (in units).
Note3: The blue bar is the number of companies acquired by Acquiror Enterprises and the red bar is the number of companies acquired by Target Enterprises.
The importance of studying corporate mergers and acquisitions (M&A) lies in understanding how companies achieve resource integration, market expansion, and strategic adaptation. Our findings indicate that M&A has a significant positive effect on firm size, employee numbers, and profitability, with several key indicators for M&A firms showing year-on-year growth. In summary, examining M&A activities provides critical insights into corporate development strategies and market dynamics, offering valuable information for decision-making by companies and policymakers.
The primary objective of this study is to investigate innovation as a motivating factor behind corporate mergers and acquisitions, as well as the impact of M&A on corporate innovation. Our research builds on a substantial body of literature.
The first set of literature addresses the factors influencing companies' motivations to merge or acquire. Financial and legal constraints play a significant role. For example, Julio and Yook explore the effects of political uncertainty on corporate investment cycles, suggesting that uncertainty can delay investment decisions, including M&A [4]. Similarly, Baker, Bloom, and Davis develop an economic policy uncertainty index, showing a correlation between heightened policy uncertainty, reduced investment, and increased stock price volatility, all of which influence M&A decisions [5]. Financial considerations and government regulations are also important motivators. Moeller, Schlingemann, and Stulz analyze the wealth destruction associated with M&A, finding that many acquisitions result in substantial value loss for acquiring firms [2]. Officer examines the role of termination fees in M&A, illustrating how these fees can safeguard acquirers’ interests and mitigate financial risks from failed transactions [3].
The second body of literature focuses on the classification of M&A impacts, broadly divided into financial performance, market dynamics and competitive effects, and economic and strategic impacts. Recent studies continue to explore the wealth effects of M&A, with Fu, Lin, and Officer presenting mixed results: while some mergers generate value, others lead to wealth destruction. This finding aligns with Moeller, Schlingemann, and Stulz, who also highlight the potential for significant value loss in certain acquisitions [2]. More recent research underscores the importance of strategic alignment and thorough due diligence in ensuring M&A success. Alexandridis, Antypas, and Travlos examine the long-term performance of acquiring firms, emphasizing that success depends on strategic fit and effective post-merger integration. They highlight the critical role of cultural fit and a robust integration process in realizing synergies. Phillips and Zhdanov emphasize the role of market forces in driving M&A, suggesting that firms acquire to enhance their competitive position and market share [18]. This is supported by recent findings showing that M&A can significantly alter market structure and competitive dynamics, often resulting in increased market concentration.
The regulatory environment remains a crucial factor influencing M&A activity. Julio and Yook highlight the role of political uncertainty in corporate investment decisions, while subsequent studies emphasize the need for regulatory clarity and political stability in facilitating successful mergers [4].
There is also extensive literature on the role of innovation in firm performance and how companies can foster innovation. Innovation as a driver of growth is widely accepted. Blundell, Griffith, and Van Reenen provide evidence that technological innovation is a key factor in firm growth, using dynamic count data models to show how innovation activities increase productivity and competitiveness [6]. Beck, Demirgüç-Kunt, and Maksimovic further demonstrate that financial and legal frameworks supporting innovation can significantly enhance firm growth, particularly for small and medium-sized enterprises [7, 8].
Financial systems play a critical role in fostering innovation. Benfratello, Schiantarelli, and Sembenelli use microeconometric evidence from Italian firms to show that access to bank financing is crucial for supporting corporate innovation [9]. Similarly, Black, Jang, and Kim illustrate that strong corporate governance structures are associated with higher innovation output and improved market performance [12].
Managerial styles and social capital also have a significant impact on innovation. Bertrand and Schoar examine the influence of management styles on firm policies, showing that innovative management practices can drive long-term firm development [10]. Belliveau, O'Reilly, and Wade explore the role of social capital among top executives, suggesting that social networks and status can significantly shape corporate innovation strategies [11].
The novelty of this study lies in its examination of the interaction between innovation and M&A. By employing an empirical approach and constructing models using comprehensive data, this research seeks to investigate and confirm the interrelationship between innovation and M&A.
2 Data Description
For the data analysis, I utilized three primary datasets: Compustat from WRDS, the Mergers and Acquisitions dataset from the SDC Database, and the NBER Patent Citations Data File. To construct our M&A sample, we focused on all announced and completed U.S. mergers and acquisitions with announcement dates between January 1, 1984, and December 31, 2016, as recorded in Thomson Reuters Financial’s SDC Database. The SDC dataset includes detailed information on over 50,000 companies involved in M&A activities since 1975. This dataset provides comprehensive data such as industry sector, six-digit CUSIP codes used to identify the immediate parent company of the acquirer, company names, M&A announcement and completion dates, post-merger employee numbers, facilities, and operating performance metrics. These variables were used to assess the impact of M&A on firms' operating performance and overall scale.
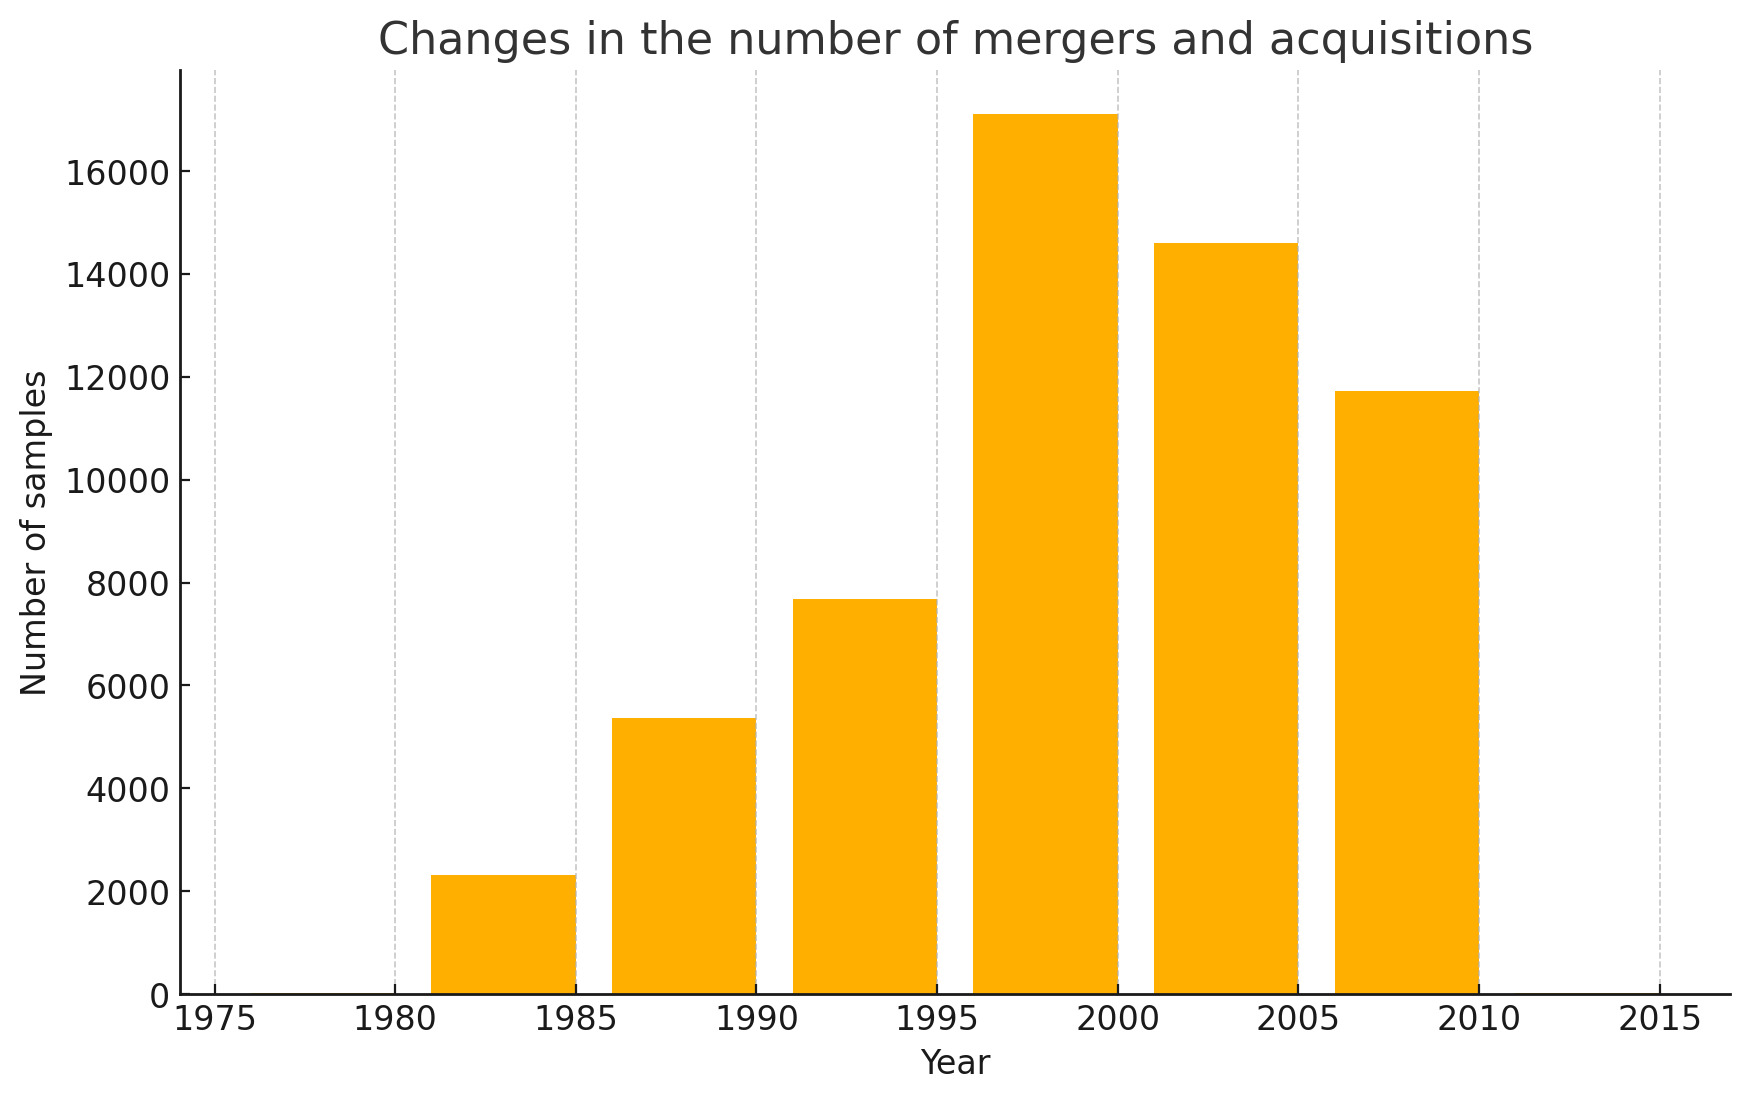
Figure 2. Transaction in the number of M&A
Note: The histogram above is showing the number of mergers grouped by 5-year intervals, with the x-axis representing the year groups and the y-axis representing the number of samples in each group.
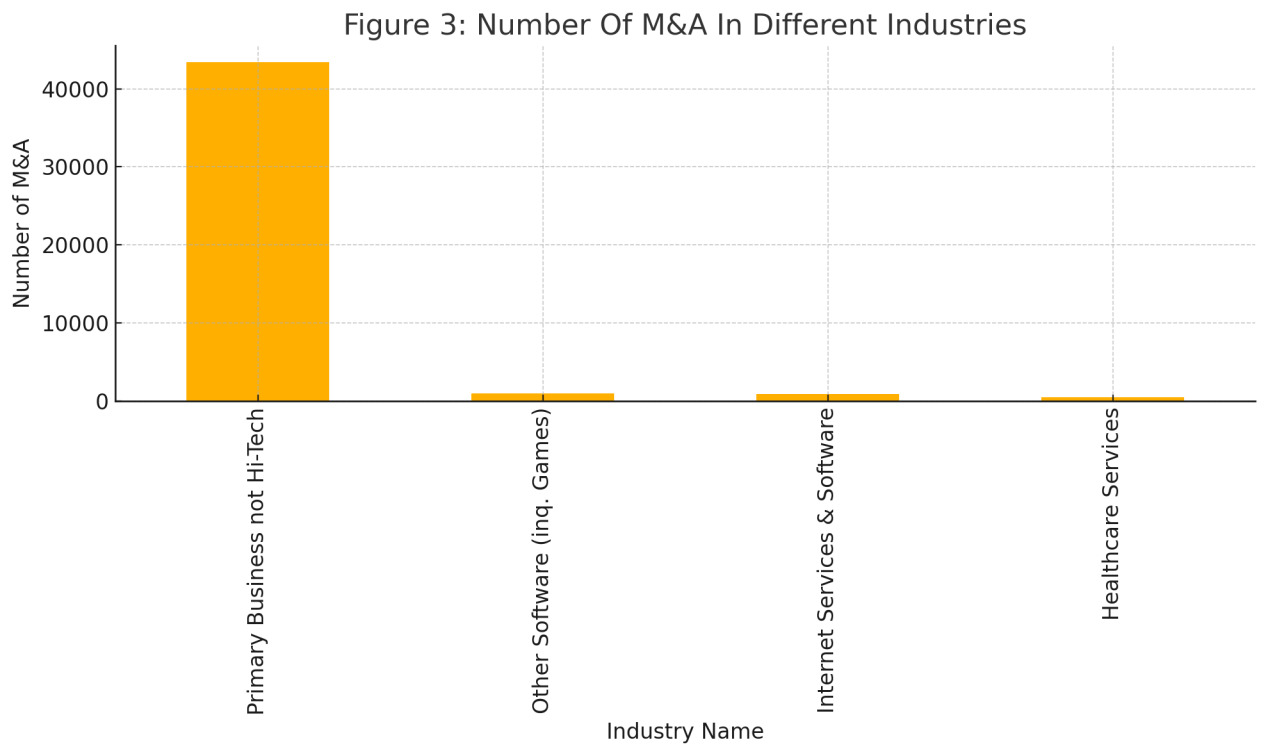
Figure 3. Number of M&A in Different Industries
Note: Here is the updated histogram showing the top 4 industries by sample count from the HighTechIndustry column. The horizontal axis represents the industries, and the vertical axis shows the number of samples for each.
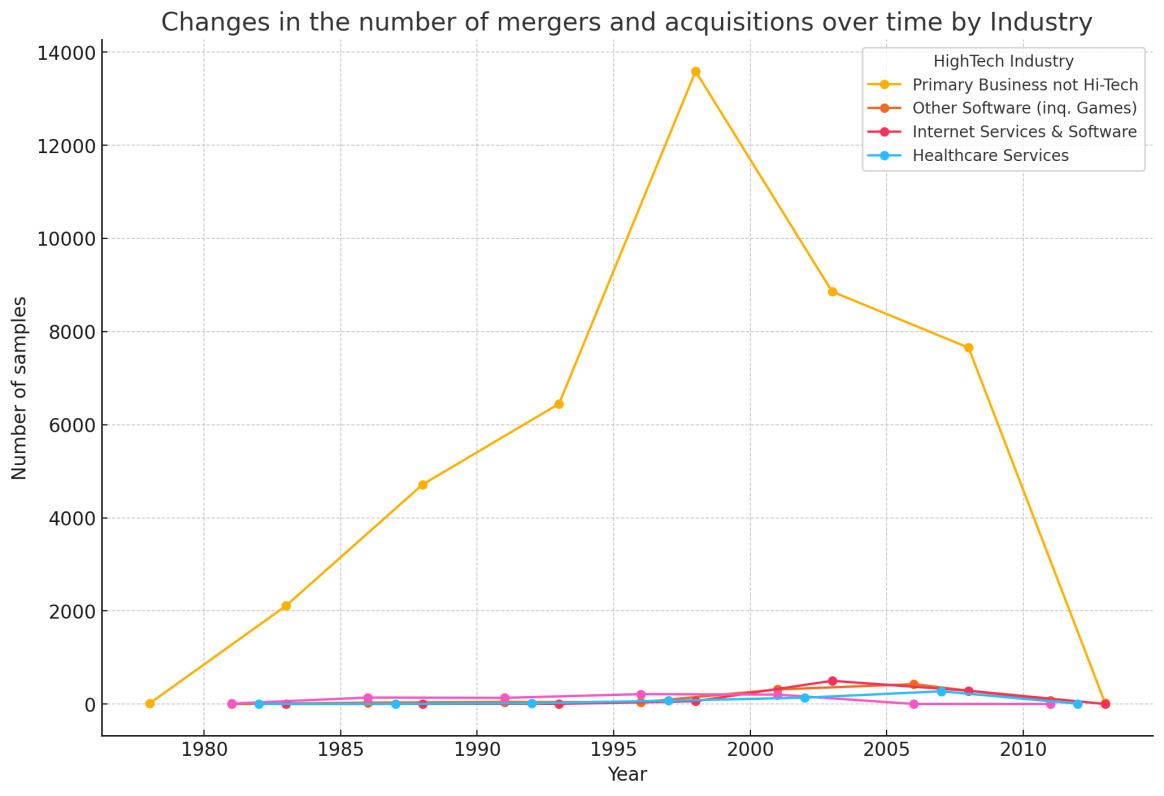
Figure 4. the Transaction of the number of M&A over time by industry
Note: Here is the line chart showing the changes in the number of mergers and acquisitions over time by industry, with the top 4 industries represented in the dataset. Each line represents a different industry, and the data has been aggregated into 5-year intervals for better visualization.
I also utilized data from the WRDS Compustat database, which contains firms' operating data from 1975 to the present. By comparing pre- and post-merger averages, this dataset enables a comprehensive analysis of the effects of M&A on firm performance. During the process of matching the datasets using CUSIP codes, I was able to determine the proportion of firms involved in M&A relative to the total number of firms, as well as their revenue share across various industries over time. This facilitated an analysis of the significance of M&A in the market, highlighting trends and changes over the past two decades.
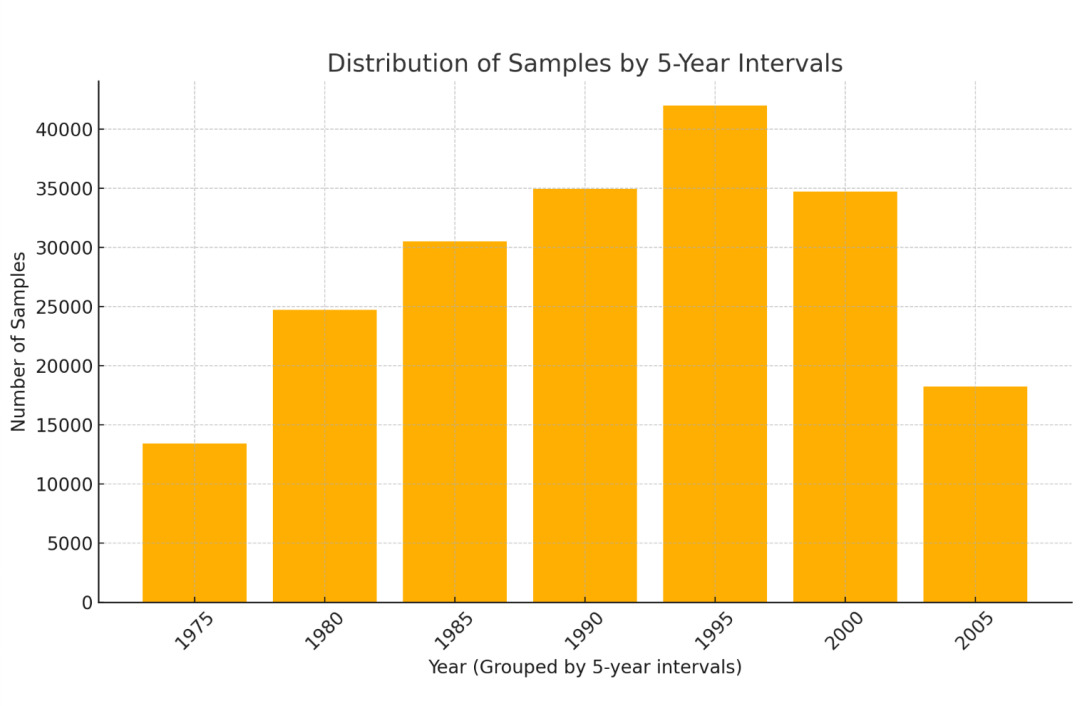
Figure 5. Number of companies over the years
Note: Here is the histogram showing the distribution of samples by 5-year intervals based on the `fyear` column. The horizontal axis represents the grouped years, and the vertical axis shows the sample count for each interval.
For the analysis, I will use two-way fixed effects models to control for potential confounding variables and more accurately assess the impact of M&A on firms' operating performance and scale. This comprehensive approach not only identifies the direct effects of M&A but also provides deeper insights into long-term trends and changes in M&A activities within the market.
Next, by merging the values of the variable _merge, which is derived from this process, we can create a binary variable to indicate whether a firm has undergone a merger or not.
In addition to the core data, we also incorporate patent data to capture firms’ and individuals’ innovation activities. The pat76 dataset contains patent application data over time, including variables such as the year of patent production, individual patent codes, the number of citations each patent receives, and the code of the person to whom the patent was granted. Using this data, we can calculate the total number of patent applications filed and citations received by an individual each year via Stata.
The Dynass dataset includes company affiliations, where pdpass is the code for individuals and gvkey identifies the companies, they are associated with. By merging Dynass with pat76 using pdpass as the key, we can calculate the total number of patent applications and citations for each company on a yearly basis. Additionally, we can aggregate this data year by year to compute the stock of patents for each company annually. Since the patent production year is not always consecutive, we will fill in the missing years and aggregate the data accordingly.
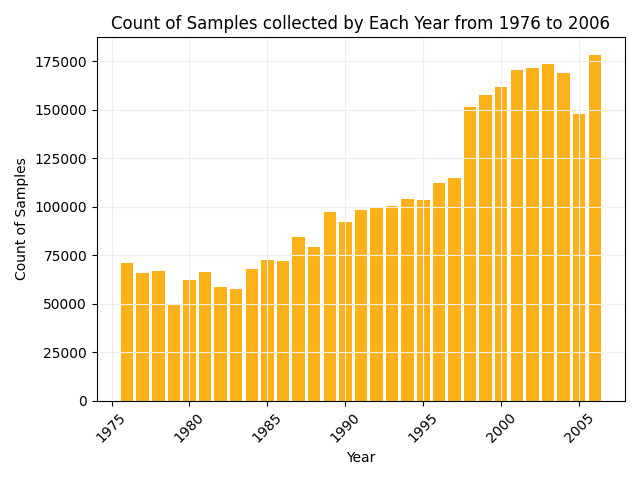
Figure 6. Number of patents collections over the years
Note: The above chart shows the distribution of data in the patent76 dataset. The x-axis indicates the year in which the patent was granted, and the y-axis indicates the number of samples.
Numerous studies and theoretical models demonstrate that the level of innovation in the acquired company can significantly enhance innovation and profitability in the acquiring company. Through mergers and acquisitions, acquiring firms often gain access to the target company's innovation and technological assets, leveraging their research and development capabilities to improve their own innovation performance. Research indicates a positive correlation between research and development intensity and the likelihood of mergers and acquisitions, suggesting that companies with robust innovation portfolios are more attractive acquisition targets [23]. Therefore, the first hypothesis posits that the higher the innovation level of the acquired firm, the greater its contribution to the acquirer's innovative capacity.
Additionally, the knowledge spillover effect from the target company can significantly benefit the acquiring firm, particularly when the technologies involved are similar, thereby promoting innovation growth for both parties in the merger [22]. Thus, the second hypothesis is that the patent output of the acquired firm positively contributes to the acquiring firm's profitability on a per capita basis.
3 Methodology, Key Variables, and Sample Overview
We will test both of these hypotheses using a two-way fixed effects model, and I will run a regression on the processed data. To test the first hypothesis, I constructed the following regression equation:
\( P_{Acq}=α+β_{1}\bar{P}_{Tar}+β_{2}\bar{C}_{Tar}+β_{3}D_{Ind}+β_{4}(D_{Ind}×\bar{C}_{Tar})+β_{5}(D_{Ind}×\bar{P}_{Tar})+∈ \)
Explanation of Each Variable:
\( P_{Acq} \) : The dependent variable representing the acquirer's cumulative patent count over the years (i.e., cumulative innovation output of the acquiring firm).
\( α \) : The intercept term, which represents the baseline level of the dependent variable when all independent variables are zero.
\( \bar{P}_{Tar} \) : Average annual patent output of the target firm before acquisition.
\( \bar{C}_{Tar} \) : Average annual citation count of the target firm’s patents before acquisition.
\( D_{Ind} \) : Dummy variable indicating whether the acquirer and the target firm belong to the same industry (1 if they are in the same industry, 0 otherwise).
\( D_{Ind}×\bar{C}_{Tar} \) : Interaction term between the industry dummy and the target firm's average annual citation count, representing the impact of belonging to the same industry on the citation effect.
\( D_{Ind}×\bar{P}_{Tar} \) : Interaction term between the industry dummy and the target firm's average annual patent output, representing the impact of being in the same industry on the target firm's patent production.
\( ∈ \) : Error term accounting for the residual variance not explained by the model.
This format maintains clarity and properly aligns the terms, as shown in the original expression.
The dependent variable \( P_{Acq} \) is the amount of patents accumulated by the acquiring firm after the acquisition. We first calculated the cumulative patents of all the involved companies from the previously mentioned datasets pat76 and dynass, and filled in the missing years due to the absence of patent output, in which there was no change in the cumulative patents of these years, so that we got the change in the cumulative patents of the companies in the consecutive years from 1975 to 2016. Afterwards, we filtered the patent accumulation of companies after mergers and acquisitions by merging this data with MA7707, which reflects the mergers and acquisitions of companies through the gvkey codes of the acquired companies, and then by corresponding the year of mergers and acquisitions with the consecutive years of the patent records, and created the variable \( P_{Acq} \) .
Our five independent variables are \( \bar{P}_{Tar} \) , \( \bar{C}_{Tar} \) , \( D_{Ind} \) , \( D_{Ind}×\bar{C}_{Tar} \) and \( D_{Ind}×\bar{P}_{Tar} \) , of which the first two are ordinary variables, the third and fourth are variables that interact with the The first two are normal variables, the third and fourth are interactions with samebra, and \( D_{Ind} \) is a dummy variable. To ensure the removal of the fixed effects of merged firms on the regression results, we standardize these independent variables.
\( \bar{P}_{Tar} \) is the average annual patent output of the acquired firm before the acquisition. Starting from the pat76 and dynass datasets, the number of individual patent applications per year can be calculated by adding the number of samples with the same patent applicant ID in the same year, and then the total number of patent applications per year for each company can be calculated by using the information of the company where the individual is located in the dynass, which constitutes the consecutive years of patent data by filling in the corresponding vacant years. After that, it is merged with the MA7707 dataset according to the gvkey of the acquired company, and divided into before and after mergers and acquisitions by the year of mergers and acquisitions in MA7707, and finally the average annual patent output of the acquired company before mergers and acquisitions is calculated, and the variable \( \bar{P}_{Tar} \) is created.
\( \bar{C}_{Tar} \) is the average annual patent citations of the acquired firm before the acquisition. Similar to \( \bar{P}_{Tar} \) , the number of patent citations per year for an individual can be calculated by adding up the number of citations for the same patent applicant ID in the same year from the pat76 and dynass datasets, and the total number of patent applications per year for each company can be calculated by using the information of the company where the individual is located in the dynass and filling the corresponding The total number of patent applications per year for each company can be calculated by using the information of the company of the individual in dynass. After that, it is merged with MA7707 dataset according to the gvkey of the acquired company, and divided into before and after mergers and acquisitions by the year of mergers and acquisitions in MA7707, and then finally calculated the average number of patents cited per year of the acquired company before mergers and acquisitions, and created the variable \( \bar{C}_{Tar} \) .
The dummy variable \( D_{Ind} \) is a variable that characterizes whether the acquiring or acquired firm is in the same industry; if the acquiring and acquired firms are in the same industry, \( D_{Ind} \) is 1, otherwise it is 0. This variable is derived from the industry classification of the two types of firms as reflected in MA7707, and it is used to test whether the industry of the acquiring and acquired firms affects their innovations.
\( D_{Ind}×\bar{C}_{Tar} \) and \( D_{Ind}×\bar{P}_{Tar} \) are derived by multiplying \( \bar{C}_{Tar} \) and \( \bar{P}_{Tar} \) with samebra.
For the other hypothesis, we constructed another regression model:
\( ∆EBITDA_{Acq}=α+β_{1}\bar{P}_{Tar}+β_{2}\bar{C}_{Tar}+β_{3}D_{Ind}+β_{4}(D_{Ind}×\bar{C}_{Tar})+β_{5}(D_{Ind}×\bar{P}_{Tar})+∈ \)
Explanation of Each Variable
\( ∆EBITDA_{Acq} \) : The dependent variable representing the percentage change in EBITDA per employee for the acquiring company after the acquisition.
The dependent variable \( ∆EBITDA_{Acq} \) is the percentage change in the profitability of the acquirer's firm before and after the merger. This variable is derived from two datasets, MA7707 and Compustat, by reshaping Compustat wide by year in terms of cusip and then merging it with the MA7707 dataset in terms of cusip of acquirer firms. The average of the acquirer firm's earnings in the three years prior to the merger is confirmed by the year in which the merger occurred in MA7707, after which the difference between it and the acquirer firm's post-merger earnings is used to calculate the percentage change in earnings as \( ∆EBITDA_{Acq} \) .
The remaining independent variables are the same as in the previous hypothetical model.
4 Result
4.1 Innovative Synergistic Impacts
The regression results are presented in the table below. The first column displays the results of a simple OLS regression without fixed effects, the second column includes year fixed effects, the third column incorporates firm fixed effects, and the fourth column includes both year and firm fixed effects.
For the first hypothesis, the dependent variable is the patent stock of the acquiring company from 1975 to 2016. The independent variables include the average number of citations and the average number of patents produced by the acquired company each year, along with interaction terms involving the variable \( D_{Ind} \) . The results, shown in the table below, indicate a significant positive correlation between the cumulative number of patents held by the acquiring company and both the average number of patents produced and cited by the acquired company. Notably, when the acquiring and acquired companies are in different industries, the positive effect of the acquired company’s patent output on the acquiring company's cumulative patent stock is even more pronounced. This relationship also holds for the number of citations of the acquired company's patents.
Therefore, it can be concluded that the innovation level of the acquired firm promotes innovation within the acquiring firm. Acquiring a company with strong innovation capabilities enhances the acquirer's innovation performance, contributing to the sustainability of its development. Cross-industry mergers are particularly beneficial, as synergies emerge when innovation activities in different fields interact within the same organization.
Table 1. Regression results on synergies of innovation
(2) |
(3) |
(4) |
||
VARIABLES |
\( P_{Acq} \) |
|||
\( \bar{P}_{Tar} \) |
7.649*** |
7.549*** |
-2.988 |
114.8*** |
(0.380) |
(0.424) |
(3.427) |
(36.47) |
|
\( \bar{C}_{Tar} \) |
0.0251*** |
0.0254*** |
-0.0236 |
0.0177 |
(0.00180) |
(0.00195) |
(0.125) |
(0.0875) |
|
\( D_{Ind}×\bar{C}_{Tar} \) |
-0.0218*** |
-0.0223*** |
0.0150 |
-2.119*** |
(0.00190) |
(0.00208) |
(26,828) |
(0.607) |
|
\( D_{Ind}×\bar{P}_{Tar} \) |
3.934*** |
4.105*** |
2.615 |
-44.13 |
(0.525) |
(0.567) |
(195,619) |
(42.33) |
|
\( D_{Ind} \) |
-0.369 |
-0.292 |
-5.676 |
105.0*** |
(0.345) |
(0.409) |
(5,589) |
(36.03) |
|
Constant |
0.600** |
8.470*** |
7.614*** |
-45.04** |
(0.276) |
(1.180) |
(1.659) |
(17.62) |
|
Year Fixed Effect |
no |
yes |
no |
yes |
Firm Fixed Effect |
no |
no |
yes |
yes |
Observations |
3,529 |
3,529 |
3,188 |
3,188 |
R-squared |
0.502 |
0.530 |
0.633 |
0.633 |
Standard errors in parentheses
*** p<0.01, ** p<0.05, * p<0.1
4.2 The Profitability-Enhancing Effect of Innovation
The regression results are presented in the table below. The first column shows the results of a simple OLS regression without fixed effects, the second includes only year fixed effects, the third incorporates firm fixed effects, and the fourth includes both year and firm fixed effects.
The profitability of the acquiring company is measured by the percentage change in EBITDA before and after the merger, which serves as the dependent variable. The independent variables include the acquired company's historical patent output and patent citations from 1975 to 2016, as well as the interaction terms between these variables and \( D_{Ind} \) . The regression results indicate that the acquirer's profit growth is significantly and positively correlated with the number of cited patents from the acquired company, while there is no significant correlation with the acquired company's patent output. The negative regression coefficient for the interaction between the acquired company’s cited patents and \( D_{Ind} \) suggests that cross-industry mergers generate greater profit growth per unit for the acquirer compared to mergers within the same industry.
In conclusion, the profitability of the acquiring company is enhanced by the innovation level of the acquired firm, with the impact increasing as the total number of citations of the acquired company’s patents rises. Cross-industry M&As further amplify this effect. This suggests that the citation level of patents in different industries can create synergies, fostering operational and profitability improvements for the acquiring firm post-merger.
Table 2. Regression results on the enhancement effect of profitability
(1) |
(2) |
(3) |
(4) |
|
VARIABLES |
\( ∆EBITDA_{Acq} \) |
|||
\( \bar{P}_{Tar} \) |
-9.67e-05 |
-0.000638*** |
-0.000927 |
-0.0637 |
(0.000144) |
(0.000147) |
(0) |
(0) |
|
\( \bar{C}_{Tar} \) |
1.81e-06*** |
2.42e-06*** |
2.45e-05 |
-1.62e-05 |
(5.96e-07) |
(5.89e-07) |
(0) |
(0) |
|
\( D_{Ind}×\bar{C}_{Tar} \) |
-1.66e-06* |
-1.89e-06** |
-4.78e-05 |
-0.00174 |
(9.24e-07) |
(8.94e-07) |
(0) |
(0) |
|
\( D_{Ind}×\bar{P}_{Tar} \) |
-0.000133 |
0.000762*** |
0.00121 |
0.00852 |
(0.000207) |
(0.000212) |
(0) |
(0) |
|
\( D_{Ind} \) |
-0.000197 |
-0.000775*** |
-0.000405 |
0.00558 |
(0.000167) |
(0.000173) |
(0) |
(0) |
|
Constant |
0.00120*** |
0.00190*** |
0.00148 |
0.0651 |
(0.000130) |
(0.000321) |
(0) |
(0) |
|
Year Fixed Effect |
no |
yes |
no |
yes |
Firm Fixed Effect |
no |
no |
yes |
yes |
Observations |
4,309 |
4,309 |
3,658 |
3,658 |
R-squared |
0.006 |
0.134 |
1.000 |
1.000 |
Standard errors in parentheses
*** p<0.01, ** p<0.05, * p<0.1
5 Conclusion
This paper empirically investigates how mergers and acquisitions (M&As) affect corporate performance and innovation in the United States. The study finds that firms typically improve patent accumulation and profit growth through the innovative strength of the acquired firm after M&As. In particular, cross-industry M&As have a more pronounced positive impact on patent accumulation and profit growth, especially when the acquired firm has a large number of patent citations. Using fixed-effect models, this article demonstrates the synergy between M&A activity and innovation and profitability.
The study shows that the patent performance and number of citations of the acquired companies are significantly and positively correlated with the cumulative patent count of the acquiring companies. Cross-industry mergers and acquisitions show stronger synergies in terms of innovation. Similarly, the profitability of acquiring companies benefits from the innovation of acquired companies, especially when the acquired companies have a large number of patent citations. These results provide theoretical support for corporate merger and acquisition strategies and show that acquiring innovative companies can significantly improve the innovativeness and profitability of acquiring firms.
While this study provides valuable insights into the relationship between mergers and acquisitions and corporate innovation and performance, it also has some limitations. Firstly, the data focuses only on the US market and may not be representative of merger and acquisition activity in other regions. Secondly, the study uses patent output and patent citations as the main indicators of innovation, while ignoring other forms of innovation indicators such as R&D investment or technology transfer. Furthermore, the study does not thoroughly examine the cultural and managerial challenges of post-merger integration, which are key factors for the success of mergers and acquisitions.
Future research could extend the analysis to a global scale and examine the impact of mergers and acquisitions on innovation in different market conditions. It could also incorporate broader innovation indicators such as research and development efficiency or technology diffusion. Furthermore, a deeper analysis of the challenges of post-merger integration, including the integration of corporate cultures and their long-term impact on innovation and performance, would contribute to a more comprehensive understanding of the outcomes of mergers and acquisitions.
References
[1]. Healy, P. M., Palepu, K. G., & Ruback, R. S. (1992). Does corporate performance improve after mergers? Journal of Financial Economics, 31, 135–175.
[2]. Moeller, S. B., Schlingemann, F. P., & Stulz, R. M. (2005). Wealth destruction on a massive scale? A study of acquiring-firm returns in the recent merger wave. Journal of Finance, 60(2), 757–782.
[3]. Officer, M. S. (2003). Termination fees in mergers and acquisitions. Journal of Financial Economics, 69(3), 431–467.
[4]. Julio, B., & Yook, Y. (2012). Political uncertainty and corporate investment cycles. Journal of Finance, 67(1), 45–83.
[5]. Baker, S. R., Bloom, N., & Davis, S. J. (2016). Measuring economic policy uncertainty. Quarterly Journal of Economics, 131(4), 1593–1636.
[6]. Blundell, R., Griffith, R., & Van Reenen, J. (1995). Dynamic count data models of technological innovation. Economic Journal, 105(429), 333–344.
[7]. Beck, T., Demirgüç-Kunt, A., & Maksimovic, V. (2005). Financial and legal constraints to firm growth: Does firm size matter? Journal of Finance, 60(1), 137–177.
[8]. Beck, T., Demirgüç-Kunt, A., & Maksimovic, V. (2008). Financing patterns around the world: Are small firms different? Journal of Financial Economics, 89(3), 467–487.
[9]. Benfratello, L., Schiantarelli, F., & Sembenelli, A. (2008). Banks and innovation: Microeconometric evidence on Italian firms. Journal of Financial Economics, 90(2), 197–217.
[10]. Bertrand, M., & Schoar, A. (2003). Managing with style: The effect of managers on firm policies. Quarterly Journal of Economics, 118(4), 1169–1208.
[11]. Belliveau, M. A., O’Reilly, C. A., & Wade, J. B. (1996). Social capital at the top: Effects of social similarity and status on CEO compensation. Academy of Management Journal, 39(6), 1568–1593.
[12]. Black, B., Jang, H., & Kim, W. (2006). Does corporate governance predict firms’ market values? Evidence from Korea. Journal of Law, Economics, and Organization, 22(2), 366–413.
[13]. Blonigen, B., & Pierce, J. R. (2015). The effect of mergers and acquisitions on market power and efficiency.
[14]. Bena, J., & Li, K. (2014). Corporate innovations and mergers and acquisitions. Journal of Finance, 69(5), 1923–1960.
[15]. Hoberg, G., & Phillips, G. (2010). Product market synergies and competition in mergers and acquisitions: A text-based analysis. Review of Financial Studies, 23(10), 3773–3811.
[16]. Sevilir, M., & Tian, X. (2012). Acquiring innovation. Journal of Financial Economics, 104(3), 492–512.
[17]. Aghion, P., Bloom, N., Blundell, R., Griffith, R., & Howitt, P. (2005). Competition and innovation: An inverted-U relationship. Quarterly Journal of Economics, 120(2), 701–728.
[18]. Phillips, G., & Zhdanov, A. (2013). R&D and the incentives from merger and acquisition activity. Review of Financial Studies, 26(1), 34–78.
[19]. Entezarkheir, M., & Moshiri, S. (2018). Innovation spillover and merger decisions. Empirical Economics.
[20]. Hackbarth, D., & Morellec, E. (2008). Stock returns in mergers and acquisitions. Journal of Finance, 63(3), 1213–1252.
[21]. Federal Trade Commission. (n.d.). Evidence on mergers and acquisitions.
[22]. Cui, W., & Wu, H. (2023). Knowledge spillover and spatial innovation growth: Evidence from China’s Yangtze River Delta. Sustainability, 15(19), 14370.
[23]. Rohra, N., & Anita. (2023). Impact of mergers & acquisitions: A critical review of literature. Academy of Entrepreneurship Journal, 29(Special Issue 3). University of Delhi.
Cite this article
Gan,Z. (2024). Corporate M&A, Firm Performance, and Innovation-Evidence from the US Market. Journal of Applied Economics and Policy Studies,13,46-54.
Data availability
The datasets used and/or analyzed during the current study will be available from the authors upon reasonable request.
Disclaimer/Publisher's Note
The statements, opinions and data contained in all publications are solely those of the individual author(s) and contributor(s) and not of EWA Publishing and/or the editor(s). EWA Publishing and/or the editor(s) disclaim responsibility for any injury to people or property resulting from any ideas, methods, instructions or products referred to in the content.
About volume
Journal:Journal of Applied Economics and Policy Studies
© 2024 by the author(s). Licensee EWA Publishing, Oxford, UK. This article is an open access article distributed under the terms and
conditions of the Creative Commons Attribution (CC BY) license. Authors who
publish this series agree to the following terms:
1. Authors retain copyright and grant the series right of first publication with the work simultaneously licensed under a Creative Commons
Attribution License that allows others to share the work with an acknowledgment of the work's authorship and initial publication in this
series.
2. Authors are able to enter into separate, additional contractual arrangements for the non-exclusive distribution of the series's published
version of the work (e.g., post it to an institutional repository or publish it in a book), with an acknowledgment of its initial
publication in this series.
3. Authors are permitted and encouraged to post their work online (e.g., in institutional repositories or on their website) prior to and
during the submission process, as it can lead to productive exchanges, as well as earlier and greater citation of published work (See
Open access policy for details).
References
[1]. Healy, P. M., Palepu, K. G., & Ruback, R. S. (1992). Does corporate performance improve after mergers? Journal of Financial Economics, 31, 135–175.
[2]. Moeller, S. B., Schlingemann, F. P., & Stulz, R. M. (2005). Wealth destruction on a massive scale? A study of acquiring-firm returns in the recent merger wave. Journal of Finance, 60(2), 757–782.
[3]. Officer, M. S. (2003). Termination fees in mergers and acquisitions. Journal of Financial Economics, 69(3), 431–467.
[4]. Julio, B., & Yook, Y. (2012). Political uncertainty and corporate investment cycles. Journal of Finance, 67(1), 45–83.
[5]. Baker, S. R., Bloom, N., & Davis, S. J. (2016). Measuring economic policy uncertainty. Quarterly Journal of Economics, 131(4), 1593–1636.
[6]. Blundell, R., Griffith, R., & Van Reenen, J. (1995). Dynamic count data models of technological innovation. Economic Journal, 105(429), 333–344.
[7]. Beck, T., Demirgüç-Kunt, A., & Maksimovic, V. (2005). Financial and legal constraints to firm growth: Does firm size matter? Journal of Finance, 60(1), 137–177.
[8]. Beck, T., Demirgüç-Kunt, A., & Maksimovic, V. (2008). Financing patterns around the world: Are small firms different? Journal of Financial Economics, 89(3), 467–487.
[9]. Benfratello, L., Schiantarelli, F., & Sembenelli, A. (2008). Banks and innovation: Microeconometric evidence on Italian firms. Journal of Financial Economics, 90(2), 197–217.
[10]. Bertrand, M., & Schoar, A. (2003). Managing with style: The effect of managers on firm policies. Quarterly Journal of Economics, 118(4), 1169–1208.
[11]. Belliveau, M. A., O’Reilly, C. A., & Wade, J. B. (1996). Social capital at the top: Effects of social similarity and status on CEO compensation. Academy of Management Journal, 39(6), 1568–1593.
[12]. Black, B., Jang, H., & Kim, W. (2006). Does corporate governance predict firms’ market values? Evidence from Korea. Journal of Law, Economics, and Organization, 22(2), 366–413.
[13]. Blonigen, B., & Pierce, J. R. (2015). The effect of mergers and acquisitions on market power and efficiency.
[14]. Bena, J., & Li, K. (2014). Corporate innovations and mergers and acquisitions. Journal of Finance, 69(5), 1923–1960.
[15]. Hoberg, G., & Phillips, G. (2010). Product market synergies and competition in mergers and acquisitions: A text-based analysis. Review of Financial Studies, 23(10), 3773–3811.
[16]. Sevilir, M., & Tian, X. (2012). Acquiring innovation. Journal of Financial Economics, 104(3), 492–512.
[17]. Aghion, P., Bloom, N., Blundell, R., Griffith, R., & Howitt, P. (2005). Competition and innovation: An inverted-U relationship. Quarterly Journal of Economics, 120(2), 701–728.
[18]. Phillips, G., & Zhdanov, A. (2013). R&D and the incentives from merger and acquisition activity. Review of Financial Studies, 26(1), 34–78.
[19]. Entezarkheir, M., & Moshiri, S. (2018). Innovation spillover and merger decisions. Empirical Economics.
[20]. Hackbarth, D., & Morellec, E. (2008). Stock returns in mergers and acquisitions. Journal of Finance, 63(3), 1213–1252.
[21]. Federal Trade Commission. (n.d.). Evidence on mergers and acquisitions.
[22]. Cui, W., & Wu, H. (2023). Knowledge spillover and spatial innovation growth: Evidence from China’s Yangtze River Delta. Sustainability, 15(19), 14370.
[23]. Rohra, N., & Anita. (2023). Impact of mergers & acquisitions: A critical review of literature. Academy of Entrepreneurship Journal, 29(Special Issue 3). University of Delhi.