


1 Introduction
A financial shock initiated by a single institution can propagate through the financial network, leading to a multiplier effect and posing a threat to network stability. A renowned financial crisis event serves as the best example to illustrate the significance of the internet in the financial sector, namely the 2008 U.S. financial crisis. In the 2008 financial crisis, various characteristics of the financial network exacerbated the occurrence of this disaster to varying degrees, and it is precisely because the financial network possesses these characteristics that its status becomes irreplaceable. Unfortunately, this was not realized by people at the time. Thus, this essay will analyze the link characteristics among financial institutions, specifically how clustering and centrality contribute to financial fragility, against the backdrop of the 2008 US financial crisis. The following provides the basic background knowledge of the 2008 US financial crisis that will be utilized in the subsequent analysis.
The story of the 2008 US financial crisis traces its origins back to the bankruptcy of New Century Financial, a subprime mortgage company founded in 1995 and specializing in the subprime mortgage market—providing subprime mortgages to borrowers with low credit. As early as 2006 to 2007, according to the S&P/Case-Shiller Home Price Index, US housing prices peaked in the second quarter of 2006 and then began to decline. By 2007, housing prices in many areas had dropped significantly. At the same time, in 2006, the sales of new and existing homes in the US started to decline. Ultimately, after a year of falling housing prices in 2007, many homeowners found that the value of their homes was less than the balance of their mortgage loans, leading to an increase in mortgage default rates and the bankruptcy of New Century.
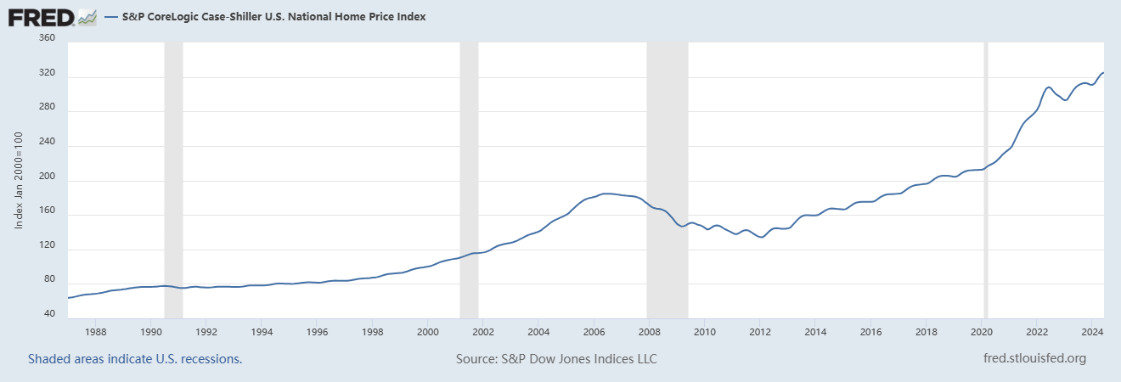
Figure 1. S&P/Case-Shiller Home Price Index [1]
This event also marked the beginning of the disaster, as falling housing prices and rising interest rates led many borrowers with high-risk mortgages to default, causing a risk in financial market liquidity. The bankruptcy of the New Century and the worsening collapse of the subprime lending market spread influence like a chain reaction to other enterprises. Unfortunately, during the 2008 financial crisis, no one was able to interpret and understand the concept of network resilience, as this idea had only been first proposed in 2000 by Albert, R., Jeong, H., & Barabási, A.-L. [2] and had only been around for seven years.
At that time in the United States, investors were often blinded by their confidence in the future development of the economy and the stability and high returns offered by high credit ratings. For example, in March 2008, Bear Stearns (founded in 1923, a leading global investment bank providing services) invested in securities backed by subprime mortgages. As the housing market collapsed and the default rate on subprime loans rose, Bear Stearns' balance sheet was severely damaged. Another notable event was on September 15, 2008, when Lehman Brothers declared bankruptcy, one of the largest bankruptcy cases in U.S. history, triggering panic in global financial markets and freezing the credit market. Despite it having survived the Great Depression of 1930, consecutive losses during the 1973 oil crisis, capital shortages after separating from American Express in 1994, the Russian debt default crisis in 1998, and the dot-com bubble burst in 2000, Lehman Brothers fell during the subprime crisis of 2007-2008 and eventually filed for bankruptcy protection. Lehman's assets plummeted due to its holdings of mortgage-backed securities, and its stock price fell sharply. During the peak of subprime securities in 2005-2006, Lehman Brothers acted as an underwriter (a securities firm that signs a securities underwriting agreement with the issuer to assist in the public issuance of securities in exchange for corresponding underwriting fees) and book-runner (the main underwriter in the securities business, responsible for the main operations when a company entrusts a bank to issue securities, often collaborating with other institutions to share risks).
As we delve deeper into the analysis of the 2008 financial crisis, we can see that this crisis was not only a direct result of structural issues within the financial system but also a joint product of regulatory failures, improper risk management, and market participant misconduct. The crisis revealed the complex relationships between the centrality of nodes, clustering coefficients, and systemic risk in financial networks, as well as how these factors interacted to cause the vulnerability of the global financial system. This paper will explore the multidimensional causes of the financial crisis, particularly how centrality in financial networks affects the spread and impact of the crisis. By analyzing the interdependencies among financial institutions, the concentration and propagation mechanisms of risk, and the role of regulatory policies during the crisis, we aim to provide a comprehensive perspective on understanding the complexity of financial crises and offer insights for future financial stability and regulatory reforms. In the following chapters, we will discuss these key factors in detail and explore how they collectively contributed to the development and evolution of the financial crisis.
2 Financial Network
The financial network is composed of diverse financial actors, including but not limited to: institutions, markets, governments, and regulatory bodies [3]. The network, represents a collective group of all individuals engaged in financial activities, where nodes symbolize different participants, and the connections between nodes denote financial transactions.
Financial crises were not simply attributable to a single factor. High leverage ratios, downgraded credit ratings, price bubbles, and the collapse of subprime mortgages all played significant roles. These factors interact internally with each other, much like the relationships among various financial institutions, which are interconnected through short-term debts and long-term collaborations. Therefore, this plot will focus on the financial network with some financial network features, such as financial resilience and financial fragility. These characteristics will facilitate further comparison when predicting the properties of financial networks.
2.1 Financial Network Resilience
Resilience [4] of the financial network is a primary objective of financial regulation. The term "resilience" refers to the capacity to recover and rapidly respond to emergency events. Consequently, the resilience of the financial network is a crucial indicator for measuring the ability of the financial system to prevent risks. Resilience is a measure of the outcome of external influences on internal processes, with the dependent variables (external factors) being financial stability, service, and reform. The resulting internal outcomes (independent variables) include preventive capabilities, responsiveness, and emergency measures. Therefore, these factors can be assessed in terms of safety, recovery ability, adaptability, and transformation ability. For example, during the 2008 financial crisis, Apple avoided such a disaster. The reason for the success was the continuous innovation of its products, which enhanced its brand image and spread risk. In 2008, Steve Jobs introduced the iPhone 3G, a significant update to Apple's smartphone lineup. By introducing 3G network support and the App Store, Apple successfully attracted a large number of new users and solidified its position in the smartphone market. Additionally, during the financial crisis, Apple continued to expand its global operations, particularly in the Asian market. This helped to diversify risk and seek new growth opportunities during times of economic uncertainty. To some extent, Apple's global risk diversification strategy increased the diversity of its financial network, which effectively spread and certainly mitigated the impact of the financial crisis. In summary, Steve Jobs' rapid adjustment of the marketing demographic at critical junctures reflected Apple's high value of resilience.
2.1.1 Financial Contagion
In the financial system, the instability of a single financial institution or market can rapidly spread to other institutions or markets, triggering a chain reaction throughout the financial system, which may in turn lead to a broader economic crisis. This phenomenon, akin to the spread of a disease, is referred to as "contagion." Several mechanisms of financial contagion include direct asset linkages, loss of market confidence, liquidity contagion, credit contraction, systemic risk, and cross-border contagion. Based on the Larry Eisenberg and Thomas H. Noe model in 2001, when certain banks face liquidity shocks (excessive liquidity demand) while others have excess liquidity supply, the risk of a run can be alleviated through the interbank lending market. Thus, the financial market can distribute risk, allowing each bank's insurance measures (liquidity reserves) to be allocated rationally, enabling banks to expand their deposit and loan volume. However, when the stability of the total liquidity demand is compromised, i.e., when the total liquidity demand exceeds the capacity of the entire banking system to provide liquidity, the close connections between banks (mutual holding of deposits) may trigger financial contagion. All in all, these two concepts are the two features of a financial network, and both of them will be used soon later.
The brief introduction to the financial network is intended to facilitate the understanding of the following two characteristics: the realities of financial networks are far more complex than their structures alone. Different financial institutions can form small or large independent financial networks, each with different structures, functions, and meanings. However, the characteristics of financial networks are shared, and inherent to each independent network. Therefore, the following content will briefly introduce these characteristics and how they contribute to the fragility of the network.
3 Clustering
The successive occurrences of the U.S. subprime crisis and the European sovereign debt crisis demonstrate that within a highly interconnected financial system, the bankruptcy of individual institutions can spread through these connections and rapidly escalate across the entire financial system, ultimately triggering a sustained economic recession. This characteristic of the financial network, where isolated events can lead to widespread defaults or bankruptcies within the financial system, thereby impairing its normal functioning, is known as clustering (connectivity). It refers to the degree to extent to which various participants within a financial system are interconnected through financial transactions, relationships, and obligations.
For example, cross exposure [5] —the mutual holding of short-term debt and claims among financial institutions. These debts and claims form a complex network within the financial system, where each bank may have direct or indirect financial exposure to others. For instance, AIG faced financial distress due to its significant risk exposure in the credit default swap (CDS) market. Many financial institutions had purchased AIG's insurance products to hedge risks. When the real estate market collapsed and AIG's credit rating fell, it was unable to meet payment demands, which forced the U.S. government to intervene and provide a bailout to prevent broader financial contagion. Therefore, the systematic characteristic contributes to the fragility of the financial network.
3.1 Clustering Coefficient
• The clustering coefficient [6] is a quantitative measure of clustering. To be more specific, the clustering coefficient for an individual is the proportion of their connections that are interconnected with each other. The average clustering of a network is the average of all the clustering coefficients of the individuals within the network. The method to quantify this coefficient involves the following steps:
• For a given node i, first identify all the neighboring nodes of node i.
• Let Ni represent the set of neighboring nodes of node i.
• Calculate the number of actual edges between any two nodes in Ni, denoted as E. If every node in Ni is connected to every other node, the maximum possible number of connections is (k,2), where k is the number of nodes in Ni (excluding node i itself).
• Therefore, the local clustering coefficient Ci is defined as the ratio of the actual number of edges E to the maximum possible number of edges (k,2), which is expressed as: Ci = 2E / k(k−1), where k is the number of neighbor of node i.
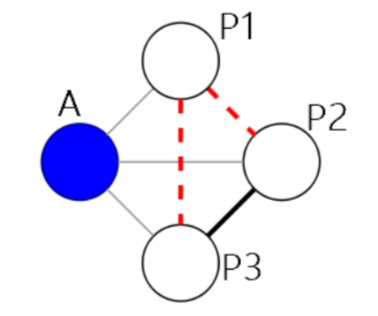
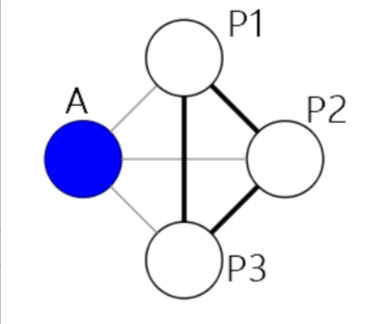
Figure 2. Clustering coefficient
Thus, the coefficient for the left diagram is 1, and for the right diagram, it is 1/3.
The value of the clustering coefficient serves not only as a simple quantitative indication but also facilitates the government and investors in predicting the potential risks and returns of a financial network. Of course, the risks and returns it brings are proportional and occur simultaneously.
3.2 High value of the Clustering Coefficient
A high clustering coefficient implies that financial institutions are closely interconnected, allowing information to propagate rapidly among them. This information sharing helps improve the quality of decision-making, reduce information asymmetry, and thereby enhance market efficiency. Additionally, high aggregation is beneficial for the close connections between institutions, which aids in risk diversification. When an institution faces risk, it can collaborate with other institutions to reduce overall risk through diversified investment portfolios, resulting in high market stability.
However, a high clustering coefficient can also increase the risk of financial contagion. When financial institutions are closely linked, problems at one institution can more easily spread to others through these connections. This "contagion effect" can amplify rapidly, threatening the stability of the entire financial network. This high degree of closeness also brings liquidity risk. If a financial institution faces liquidity issues, it may struggle to obtain financial support from other institutions in the network, as these institutions may also be under similar liquidity pressures. Similarly, there is the risk of credit concentration and reduced market efficiency (homogenization of market information, reducing market diversity and competitiveness. This can lower market efficiency and innovation capabilities).
3.3 Low Value of the Clustering Coefficient
A low clustering coefficient means that financial institutions are loosely interconnected, which may help reduce the risk of financial contagion. In this scenario, even if a financial institution encounters issues, its impact is unlikely to spread rapidly across the entire network due to fewer direct connections between institutions. For example, during the 2008 financial crisis, some fintech companies might have been able to adapt more quickly to market changes and provide innovative financial products and services due to their lesser connections with the traditional financial system. Similarly, e-commerce businesses like Amazon, with their extensive customer base and supplier networks, might have maintained business growth and stability during economic crises by offering a diverse range of goods and services.
On the other hand, a low clustering coefficient may result in insufficient collaboration and information sharing among financial institutions, potentially lowering the efficiency of the entire financial network and its ability to withstand market shocks.
All in all, during the 2008 US financial crisis, both high and low values of clustering coefficient had significant impacts on the economy. The risk concentration caused by a high coefficient tightly bound all interconnected financial institutions together, spreading individual crises throughout society and increasing systemic risk (the risk of the entire financial system collapsing). Also, the risk caused by a low coefficient, the reduction in market liquidity, and the increase in regulatory challenges have also dealt a significant blow to the economy.
Ultimately, the government used several methods to adjust clustering coefficient: Quantitative easing (the central bank purchased a large amount of financial assets, which helped stabilize the financial market and reduce interdependence among financial institutions): capital injections (the government provided capital injections to troubled financial institutions to strengthen their capital base and reduce their reliance on other institutions), Regulatory reforms (introducing new regulatory rules, such as Basel III, requiring banks to increase capital adequacy and liquidity ratios, which helps reduce the tight connections among financial institutions).
4 Centrality
Centrality, as one of the characteristics of the financial network, can be used as an indicator to measure the importance of nodes within the network [7]. It helps us understand the influence and role of a particular financial institution or financial product in the financial network. Another theory similar to centrality, communities, focuses on a macro perspective of humanity and society. For example, due to the excessive number of connections of subsidiaries of a few large companies, it has led to a situation where the fate of the entire financial network is intertwined, also known as too-big-to-fail.
Centrality can be divided into different types, each with a unique impact pathway on the economy. For example, Degree Centrality. Degree Centrality represents the degree centrality of a node, which is the number of edges it is directly connected to. Nodes with high degree centrality (SIFIs) in the financial network have more direct connections. These nodes may become key propagators in financial contagion because they are connected to many other nodes, which rely on the stability of this node. Therefore, when it encounters issues, it may trigger simultaneous failures of multiple nodes. This chain reaction is also a systemic manifestation of high degree centrality.
4.1 Closeness Centrality
This type of centrality refers to the average distance of a node to all other nodes in the network. The shorter the average distance to all other nodes, the more "central" its position in the network. Nodes with a short average distance can quickly spread risks because proximity centrality-high nodes, due to their shorter average distance to other nodes in the network, allow risks and information to spread rapidly to other parts of the network. Additionally, nodes with high proximity centrality may act as key intermediary roles in the network, potentially connecting nodes from different parts of the network. If these nodes encounter issues, they may disrupt or distort the path of risk propagation.
4.2 Betweenness Centrality
It refers to the "bridge" role of a node in the network, which is the number of times it appears on the shortest paths between other pairs of nodes in the network. Based on the frequency of a node's appearance on all shortest paths in the network. The higher the betweenness centrality of a node, the stronger its ability to act as a "bridge" connecting different parts of the network. Nodes with high betweenness centrality play a critical intermediary role in the financial network. The failure or risk exposure of these nodes may cut off certain connections in the network, altering the path of financial contagion. When financial risk spreads through the network, nodes with high betweenness centrality may become key pathways for risk propagation. If these nodes encounter issues, they may disrupt or change the path of risk propagation, affecting the stability of the entire network. For example, as mentioned earlier, AIG. AIG faced difficulties during the crisis due to significant losses from CDS contracts, and its problems quickly affected the financial institutions with which it had trading relationships. Or Standard & Poor's, Moody's, and Fitch Ratings. These institutions' credit ratings of financial products and institutions have a significant impact on market confidence and capital flows.
4.3 Eigenvector Centrality
This considers the importance of the nodes connected to a node. Nodes with high eigenvector centrality typically play a critical role in the financial network, potentially connecting multiple important financial institutions. When these nodes encounter issues, due to their influence, the problems may quickly spread throughout the network. Moreover, financial institutions with high eigenvector centrality often play a significant role in providing liquidity. When these nodes face problems, they may be unable to continue providing necessary liquidity, leading to market liquidity tightening and affecting other financial institutions.
Therefore, it can be seen that no matter what type of centrality, it will have more or less an impact on the spread of financial contagion. In summary, the centrality in financial networks played a crucial role in the spread of the 2008 U.S. financial crisis. Issues with highly central financial institutions can quickly spread throughout the network, exacerbating market panic and liquidity crunch. This also indicates that in financial regulation and risk management, identifying and monitoring key nodes in the network is of great importance.
5 Conclusion
The linkages among financial institutions and financial networks played a significant role in the 2008 financial crisis, amplifying its impact and facilitating its spread across the global financial system. By considering the clustering and centrality of financial institutions (banks, insurance companies, hedge funds, and other financial institutions) are interconnected through complex financial products and transactions, forming a highly interconnected financial network. When certain institutions encounter problems, this interconnectedness allows risks to spread rapidly across the entire network. This interconnectedness also means that the failure of a single institution can trigger systemic risk, leading to the collapse of the entire financial system. In the 2008 crisis, the bankruptcy of Lehman Brothers is a typical example, with its impact quickly spreading across global financial markets.
In the end, the U.S. government had to take a series of actions and policies to mitigate the impact of this disaster on the U.S. economy. Under the Troubled Asset Relief Program (TARP), the plan initially authorized $7000 billion to purchase distressed assets from financial institutions, later primarily used for direct capital injections into banks and other financial institutions. This bank bailout method saved institutions including Citigroup, Bank of America, and JPMorgan Chase. Additionally, in response to the quantitative easing policy (QE) of the U.S. Federal Reserve System, the Fed implemented multiple rounds of QE, purchasing long-term government bonds and MBS to increase asset liquidity, lower long-term interest rates, and stimulate economic activity.
Regarding the key factor of the event, mortgage loans, the government launched multiple programs such as HAMP, helping distressed homeowners modify mortgage terms to avoid foreclosure. Following this event, the U.S. Congress passed the Dodd-Frank Wall Street Reform and Consumer Protection Act in 2010, aimed at strengthening financial regulation and preventing similar financial crises in the future. The act includes establishing the Consumer Financial Protection Bureau (CFPB), enhancing oversight of systemically important financial institutions, and improving market transparency and stability.
Overall, through these measures, the U.S. government successfully stabilized the financial markets, prevented a more severe economic collapse, and gradually restored economic growth. However, these measures also sparked extensive discussions about the scale and long-term impact of government intervention. The financial network played a crucial role in the 2008 U.S. financial crisis, accelerating the spread and amplification of the crisis through interconnectedness, derivatives markets, asset securitization, information asymmetry, and systemic risk.
References
[1]. (S&P CoreLogic Case-Shiller U.S. National Home Price Index (CSUSHPINSA) | FRED | St. Louis Fed (stlouisfed.org)
[2]. Albert, R., Jeong, H., & Barabási, A.-L. (2000). Error and attack tolerance of complex networks. Nature, 406, 378–382.
[3]. Bardoscia, M., Barucca, P., Battiston, S., Caccioli, F., Cimini, G., Garlaschelli, D., Saracco, F., Squartini, T., & Caldarelli, G. (2021). The Physics of Financial Networks.
[4]. Amini, H., Cont, R. and Minca, A. (2016), RESILIENCE TO CONTAGION IN FINANCIAL NETWORKS. Mathematical Finance, 26: 329-365.
[5]. De Bandt, O., & Hartmann, P. (2000). Systemic risk: a survey. SSRN 258430.
[6]. Hamilton, W., Ying, Z., & Leskovec, J. (2017). Inductive representation learning on large graphs. In Advances in Neural Information Processing Systems
[7]. Chan-Lau, J. A. (2018). Systemic centrality and systemic communities in financial networks. International Monetary Fund, 700 19th St NW, Washington, DC 20431, USA.
Cite this article
YuXin,E.Z. (2024). How Do Linkages among Financial Institutions Help to Explain the 2008 Financial Crisis?. Journal of Applied Economics and Policy Studies,15,17-22.
Data availability
The datasets used and/or analyzed during the current study will be available from the authors upon reasonable request.
Disclaimer/Publisher's Note
The statements, opinions and data contained in all publications are solely those of the individual author(s) and contributor(s) and not of EWA Publishing and/or the editor(s). EWA Publishing and/or the editor(s) disclaim responsibility for any injury to people or property resulting from any ideas, methods, instructions or products referred to in the content.
About volume
Journal:Journal of Applied Economics and Policy Studies
© 2024 by the author(s). Licensee EWA Publishing, Oxford, UK. This article is an open access article distributed under the terms and
conditions of the Creative Commons Attribution (CC BY) license. Authors who
publish this series agree to the following terms:
1. Authors retain copyright and grant the series right of first publication with the work simultaneously licensed under a Creative Commons
Attribution License that allows others to share the work with an acknowledgment of the work's authorship and initial publication in this
series.
2. Authors are able to enter into separate, additional contractual arrangements for the non-exclusive distribution of the series's published
version of the work (e.g., post it to an institutional repository or publish it in a book), with an acknowledgment of its initial
publication in this series.
3. Authors are permitted and encouraged to post their work online (e.g., in institutional repositories or on their website) prior to and
during the submission process, as it can lead to productive exchanges, as well as earlier and greater citation of published work (See
Open access policy for details).
References
[1]. (S&P CoreLogic Case-Shiller U.S. National Home Price Index (CSUSHPINSA) | FRED | St. Louis Fed (stlouisfed.org)
[2]. Albert, R., Jeong, H., & Barabási, A.-L. (2000). Error and attack tolerance of complex networks. Nature, 406, 378–382.
[3]. Bardoscia, M., Barucca, P., Battiston, S., Caccioli, F., Cimini, G., Garlaschelli, D., Saracco, F., Squartini, T., & Caldarelli, G. (2021). The Physics of Financial Networks.
[4]. Amini, H., Cont, R. and Minca, A. (2016), RESILIENCE TO CONTAGION IN FINANCIAL NETWORKS. Mathematical Finance, 26: 329-365.
[5]. De Bandt, O., & Hartmann, P. (2000). Systemic risk: a survey. SSRN 258430.
[6]. Hamilton, W., Ying, Z., & Leskovec, J. (2017). Inductive representation learning on large graphs. In Advances in Neural Information Processing Systems
[7]. Chan-Lau, J. A. (2018). Systemic centrality and systemic communities in financial networks. International Monetary Fund, 700 19th St NW, Washington, DC 20431, USA.