


1. Introduction
In recent years, the Chinese government has attached great importance to the role of the digital economy in promoting agricultural modernization and green development. A series of policy measures have been introduced to strengthen the digital transformation of agriculture and rural areas through the application of agricultural digital technologies, aiming to achieve green and low-carbon agricultural development. These policies emphasize the importance of the green development concept in guiding high-quality agricultural and rural development, as well as promoting the coordinated development of agriculture’s economy, society, and ecology through the extensive application of green technologies. These measures provide a clear direction for the digital and green transformation of the agricultural sector and offer policy support, thus contributing to achieving high-quality agricultural development and carbon reduction goals, as shown in Table 1.
Table 1. Policies related to the digital and green development of agriculture
Policy Date | Policy Content | Issuing Department |
2020-04 | “Develop Smart Agriculture,” “Develop Rural Digital Economy,” “Strengthen the Digital Transformation of Agriculture and Rural Areas” | Ministry of Agriculture and Rural Affairs of the People’s Republic of China |
2022-02 | Notice on the Issuance of Henan Province’s “14th Five-Year” Rural Revitalization and Agricultural Modernization Plan, Implementing Green and Low-carbon Transformation | People’s Government of Henan Province |
2024-04 | Leading High-Quality Agricultural and Rural Development with Green Development Concept... Economic development becomes greener... People’s lives become happier | Luohe Municipal Bureau of Agriculture and Rural Affairs |
2018-05 | Agricultural Green Development Ensures Coordinated Economic, Social, and Ecological Development... Rapid Development and Extensive Application of Green Agricultural Technologies Integrated with Digital Technology | Luohe Municipal Bureau of Agriculture and Rural Affairs |
2023-09 | Green Agriculture Guides a New Path for Rural Revitalization | Wuyang County Agricultural and Rural Affairs Bureau |
This paper has both theoretical and practical research significance. From a theoretical perspective, studying the carbon reduction effects of agricultural digital technologies contributes to enriching and developing digital economy theory. It introduces a digital economy perspective into the field of agricultural carbon reduction, exploring the advantages of agricultural digital technologies in optimizing agricultural production methods, improving resource utilization efficiency, and promoting green and low-carbon agricultural development, thus expanding the connotation and extension of digital economy theory. Furthermore, this research helps develop agricultural carbon reduction theory, reveals the pathways and mechanisms through which digital economy enables agricultural carbon reduction, and provides a basis for policy formulation to achieve the “dual carbon” goals in the agricultural sector. It also offers a path for agricultural digital development and achieves the unity of “efficient” and “low-carbon” agriculture. From a practical perspective, Henan Province, including Linying County, boasts favorable geographical conditions, a long agricultural development history, and a burgeoning digital economy, providing fertile ground for studying the application of agricultural digital technologies and their carbon reduction effects. This provides a “Henan-style model” for low-carbon agricultural development and offers a policy lever for Henan Province to implement targeted measures and refine the development of low-carbon, high-efficiency agriculture, thus achieving the goal of agricultural carbon peak more quickly.
Table 2. Agricultural carbon peak times for provinces, municipalities, and autonomous regions in China
Peak Time | Statistical Object | Peak Time | Statistical Object | Peak Time | Statistical Object |
1997 | Tianjin, Jiangsu, Hainan, Heilongjiang, Ningxia | 2010 | Liaoning, Sichuan | 2015 | Shanxi, Gansu, Xinjiang |
1998 | Jiangxi | 2011 | Hubei | 2016 | Guangdong, Fujian, Anhui |
2006 | Shandong, Hunan, Guizhou | 2012 | Jilin | 2017 | Yunnan |
2007 | Hebei | 2013 | Shaanxi | 2020 | Qinghai |
2009 | Tibet | 2014 | Guangxi, Zhejiang, Inner Mongolia |
2. Conceptual explanation and literature review
2.1. The connotation of agricultural digital economy
Agricultural digital economy is an emerging concept. Based on the academic definition of digital economy, it can be summarized as a new economic form where digital technologies are deeply integrated with traditional agricultural production factors. Through improving agricultural production efficiency and resource utilization efficiency, it aims to achieve sustainable agricultural development. The core elements of agricultural digital economy mainly include the collection, transmission, and analysis of agricultural big data; the research and application of intelligent agricultural machinery and equipment; and the formation of precision agricultural management and service models based on the internet.
The development of agricultural digitization can effectively improve agricultural productivity, reduce production costs, and enhance product quality and benefits. Key areas of focus include the vigorous development of agricultural IoT, agricultural big data platforms, intelligent horticulture and farming digital facilities; the promotion of intelligent precision operation machinery; the cultivation of new digital agricultural production and operation entities; the improvement of network management and service systems; the innovation of agricultural product marketing models; and strengthening top-level design, improving regulations and policies, and creating a favorable ecological environment. The agricultural digital economy can promote the technological upgrade and green development of traditional agriculture and is of great significance for ensuring national food security and enhancing agricultural competitiveness. The agricultural digital economy studied in this paper refers to a new form of agriculture that integrates digital economy, resulting from the empowerment of traditional agriculture by big data, the Internet of Things (IoT), and intelligent equipment. Therefore, in subsequent evaluations of agricultural digital economy, more attention will be paid to the digital infrastructure development in rural areas.
2.2. The connotation of agricultural carbon emissions
In this paper, agricultural carbon emissions refer to the carbon-containing gas emissions generated during agricultural production and its related activities, primarily including carbon dioxide (CO₂) and methane (CH₄). Specifically, CO₂ emissions mainly come from energy consumption in agricultural mechanization operations and indirect emissions during fertilization processes; methane emissions are primarily derived from the reduction process in rice fields and the digestion process in livestock; additionally, other carbon oxide emissions are mainly related to the growth and transportation processes of crops. Agricultural carbon emissions are influenced by a variety of factors, including the intensity of agricultural activities (such as crop varieties, fertilizer usage, irrigation methods, livestock density, etc.) and natural conditions (such as soil characteristics, climate conditions, etc.). Due to the differences in agricultural production methods across countries and regions, agricultural carbon emission characteristics also vary. This paper estimates emissions based on the actual crop planting situation in Henan Province, using the emission factor method. Specifically, the carbon emissions from major crops such as wheat, corn, and rice, as well as the carbon emissions from the input of agricultural production factors (such as fertilizers, pesticides, energy, etc.), are quantified. (The composition of this paper’s core concepts as shown in Figure 1)
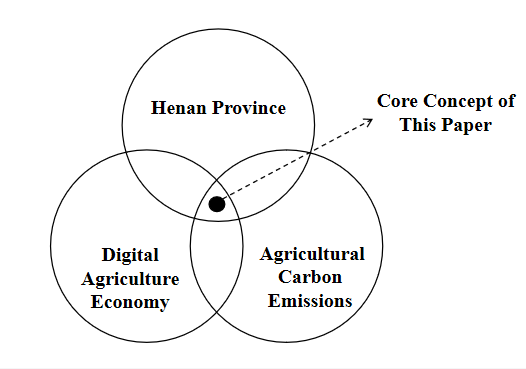
Figure 1. The composition of core concepts in this paper
2.3. Literature review
The impact of digital economy on agricultural carbon emissions and its mechanisms is one of the current hot topics in academic research (Seen as Figure 2). Recent studies show that digital economy has a significant inhibitory effect on agricultural carbon emissions. Shi, based on provincial panel data from 2013 to 2022 and using both the bidirectional fixed effect model and the mediation effect model, found that rural digital economy can significantly reduce agricultural carbon emissions, with rural industrial integration playing an important mediating role. This conclusion was further supported by Tian and Liao, who, based on panel data from 30 provinces over nearly ten years, found that for every 1% increase in the development level of digital economy, agricultural carbon emissions would decrease by 0.595% [1]. Furthermore, Meng et al. pointed out that the impact of digital economy on agricultural carbon emissions exhibits regional heterogeneity. The inhibitory effect is more pronounced in the central and western regions, northern areas, non-major grain-producing regions, and areas with high technological investments.
The mechanisms through which digital economy impacts agricultural carbon emissions are multifaceted. Firstly, digital economy drives the green transformation of agriculture through technological progress and innovation. Lu and Guo [2] noted that digital economy can enhance farmers’ capital endowment levels, promote the application of green production methods, and reduce agricultural carbon emissions. Digital technologies such as the Internet of Things, big data, and artificial intelligence can precisely monitor resource usage in agricultural production processes, optimize resource allocation, and improve agricultural production efficiency, thereby reducing carbon emissions per unit of output. At the same time, digital economy can promote the research and application of green technologies, such as smart irrigation systems and precision fertilization techniques, reducing energy consumption and carbon emissions in agricultural production processes.
Secondly, digital economy promotes agricultural modernization by optimizing industrial structure and facilitating rural industrial integration. The development of digital economy can break down boundaries between rural industries, promote deep integration of agriculture with processing and service industries, form complete industrial chains, increase the added value of agricultural products, and reduce resource waste and carbon emissions in agricultural production. Additionally, digital economy can promote the modernization process of agriculture by enhancing the intelligence and greening of agricultural production, further reducing agricultural carbon emissions.
Thirdly, digital economy has a significant spatial spillover effect. Lu and Guo used a spatial Durbin model to elaborate on the spatial spillover effect of digital economy in empowering agricultural green development. Xue et al. found that both digital economy and its spatial spillover effects significantly reduced carbon emissions in the region and its neighboring areas. The spatial spillover effect of digital economy can be realized through technological advancement and industrial structure upgrading, driving digital technology application and industrial upgrading in surrounding areas, promoting collaborative development between regions, improving agricultural production efficiency and green development levels, and thus reducing agricultural carbon emissions.
Moreover, digital economy impacts agricultural carbon emissions through improving the transmission mechanism of agricultural socialized services. Tang [3] emphasized the impact of the transmission mechanism of agricultural socialized services based on digital economy on agricultural carbon emissions. The development of digital economy can promote the improvement and innovation of agricultural socialized services, providing more efficient and convenient service support for agricultural production, such as agricultural technology promotion, agricultural product sales, and agricultural finance, helping farmers improve production efficiency and reduce carbon emissions in the production process. From the perspective of rural digital construction, the impact of digital economy on agricultural carbon emissions should also not be ignored. Han and Gong pointed out that rural digital construction, including digital infrastructure construction, agricultural data resource development, and smart agriculture applications, can improve the digital environment in rural areas, providing foundational support for the application of digital economy in agriculture, and further reducing agricultural carbon emissions [4]. Rural digital construction can promote diversified rural economic development, increase farmers’ income, and improve the living standards and consumption capacity of rural residents, thereby reducing reliance on traditional agricultural production and lowering agricultural carbon emissions.
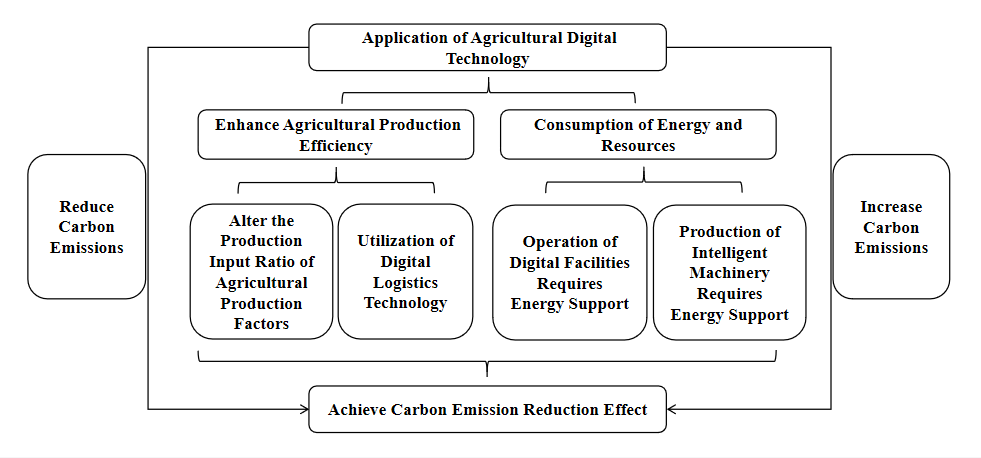
Figure 2. The impact pathway of agricultural digital technologies on carbon emissions
3. Theoretical explanation I: analytical paradigm based on triple normative theory
3.1. Environmental Kuznets Curve theory
When discussing the theoretical foundation of digital economy-enabled agricultural carbon reduction, the Environmental Kuznets Curve (EKC) theory provides an important analytical framework. The EKC theory, first proposed by economist Cornell Stern in 1992, aims to explain the relationship between environmental pollution and economic growth. According to this theory, in the early stages of economic development, environmental pollution increases rapidly with the rise in economic output. During this phase, economic growth is often achieved at the expense of the environment, with excessive exploitation of natural resources and substantial pollution emissions. However, as the economy continues to develop, the emphasis on environmental protection grows, technological innovation begins to take effect, and the relationship between economic growth and environmental protection gradually transitions from opposition to coordination. Eventually, environmental pollution reaches a peak and begins to decline. (Diagram of the EKC theory as shown in Figure 3)
Agriculture, as an important component of the national economy, has a development trajectory closely related to the EKC theory, especially in terms of carbon emissions. In many developing countries, agriculture is not only a major economic pillar but also one of the key sources of carbon emissions. In the early stages of agricultural development, large-scale land reclamation, extensive use of fertilizers and pesticides, and rapid mechanization of agriculture lead to an extensive agricultural model that often sacrifices the environment. These activities result in soil degradation, water pollution, and increased greenhouse gas emissions, particularly methane and carbon dioxide. Numerous studies show that in the early stages of agricultural development, carbon emissions exhibit a clear upward trend, aligning with the pollution growth phase described in the EKC.
However, with ongoing economic development and increasing social attention to environmental issues, the agricultural sector has gradually started adopting measures to reduce carbon emissions and achieve sustainable development. For example, by introducing smart agricultural technologies such as the Internet of Things (IoT) and Artificial Intelligence (AI), precision fertilization and targeted irrigation can be implemented, thus reducing the use of fertilizers and water resources, which in turn reduces carbon emissions. At the same time, promoting organic farming reduces the use of chemical pesticides and fertilizers, fosters soil health, and further reduces carbon emissions. The large-scale implementation of these measures results in a gradual decrease in agricultural carbon emissions, which, according to the EKC, reflects a declining trend after the peak of carbon emissions. This trend is often the result of national economic development and technological innovation, indicating that with improved economic levels, the agricultural sector will increasingly focus on ecological protection and minimizing environmental impacts.
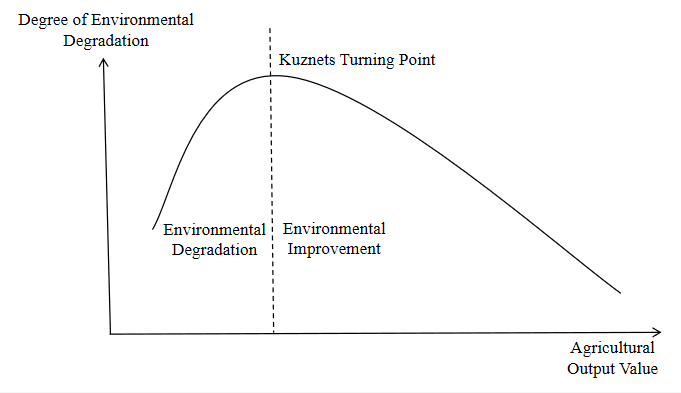
Figure 3. Diagram of the Environmental Kuznets Curve theory
From the perspective of marginal utility, the Environmental Kuznets Curve also reveals the diminishing marginal reduction effect in digital economy-enabled agricultural carbon reduction. In the early stages of digital economy empowerment for agricultural carbon reduction, the marginal reduction effect is high. However, digital economy itself also generates some carbon emissions, and its initial phase of integration with agriculture may even lead to an increase in carbon emissions. Therefore, in the process of combining the digital economy with agricultural carbon reduction, the leading role of the emission reduction effect brought by the digital economy and the carbon emission effects it generates is uncertain and closely related to the development stage. This heterogeneity also explains the differences between economically developed and underdeveloped areas in Henan Province in terms of digital economy-enabled agricultural carbon reduction, and theoretically supports the need for heterogeneity robustness tests in this paper.
3.2. Resource optimization allocation theory
Resource optimization allocation theory is one of the core theories in economics (Diagram of resource optimization allocation theory logic as shown in Figure 4). Its central idea is how to maximize economic and social benefits through the rational allocation of limited resources under market economic conditions. This theory emphasizes that social resources are scarce, while human demand is infinite. Therefore, limited resources must be used efficiently and allocated to fields that are most in need and capable of generating the greatest benefits. Resource allocation should follow the principles of efficiency-first and benefit-maximization, while also considering fairness through policy measures to promote equitable income distribution, allowing all social strata to share the benefits of resource allocation. In addition, resource allocation should also address externality issues by guiding policies and regulatory constraints to reduce the negative impact of production and consumption on the environment, thus achieving sustainable resource use.
The impact of the digital economy on agricultural carbon reduction can be explained through resource optimization allocation theory. In the agricultural sector, resource optimization is especially important because agricultural production relies on limited resources such as land, water, and energy. The digital economy provides agriculture with intelligent tools and advanced technologies, optimizing agricultural production resource allocation through more precise resource utilization and decision support, thus empowering agricultural carbon reduction.
Firstly, the digital economy helps farmers better manage agricultural production by providing precise data and information. The widespread application of sensors, satellite images, and meteorological data allows farmers to monitor key factors such as soil moisture, temperature, and crop health in real time. These data help farmers optimize agricultural practices and reduce resource waste. For example, precision irrigation based on real-time soil moisture data can prevent water waste and energy consumption, thereby reducing carbon emissions. Secondly, the digital economy promotes the development of smart agricultural machinery and automated systems, increasing production efficiency and reducing carbon emissions. Automated systems can perform tasks such as planting, harvesting, and weeding according to demand, reducing labor costs and fuel consumption of agricultural machinery. At the same time, smart agricultural machinery, through intelligent path planning, reduces unnecessary travel, further lowering carbon emissions. Thirdly, data analysis and machine learning technologies in the digital economy help optimize agricultural decision-making. By analyzing big data, farmers and decision-makers can more accurately predict weather changes, disease outbreaks, and market demand, enabling more targeted actions that reduce resource waste, such as decreasing the use of chemical pesticides and fertilizers, thereby reducing carbon emissions during their production and application. Finally, the digital economy facilitates the collaboration and optimization of agricultural supply chains. Through blockchain technology and IoT devices, the production, transportation, and storage of food become more transparent and efficient, reducing food waste and lowering unnecessary resource consumption and carbon emissions.
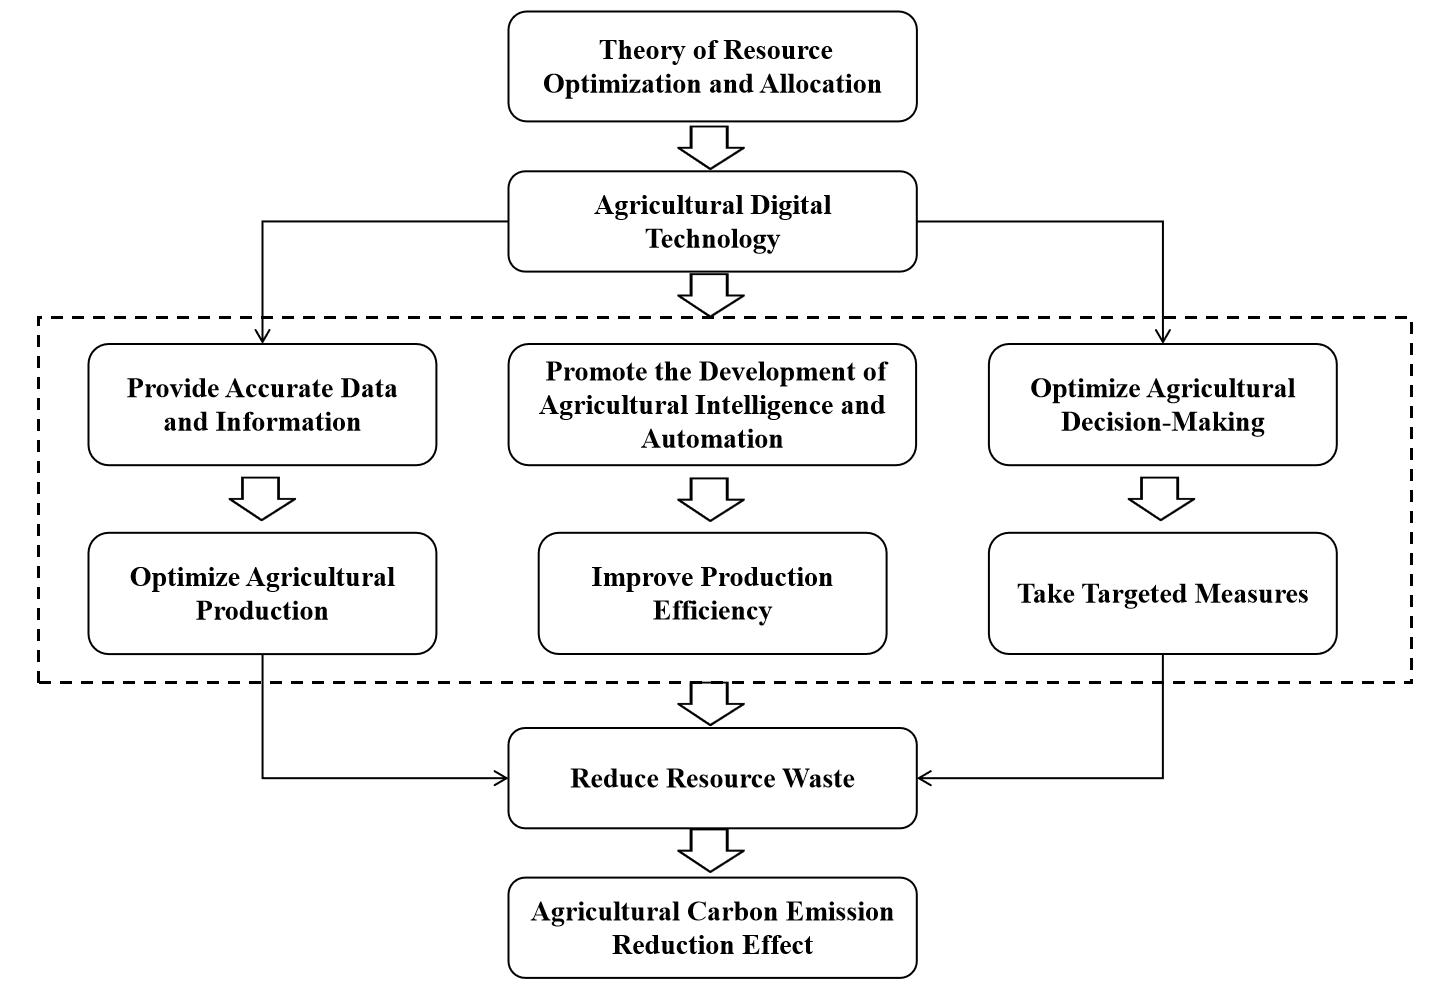
Figure 4. Diagram of resource optimization allocation theory logic
3.3. Low-carbon agriculture theory
Low-carbon agriculture theory is a new agricultural business model that integrates low-carbon technologies and concepts on the basis of traditional agricultural production methods, aiming to achieve sustainable agricultural development. Its core lies in reducing greenhouse gas emissions as much as possible during agricultural production and operation, while ensuring that agricultural yields do not decrease, or decrease minimally, through technological advancement and management innovation. Specifically, the practical path of low-carbon agriculture includes the use of energy-efficient irrigation technologies and advanced fertilization methods to reduce methane and nitrous oxide emissions; the development of green fertilization and biological pest control technologies to reduce the use of chemical fertilizers and pesticides; and the use of agricultural waste to produce clean energy, among others. Low-carbon agriculture emphasizes system optimization and the efficient use of resources, striving to achieve balanced development in economic, environmental, and social benefits.
Figure 5. Research interest in low-carbon agriculture theory (2009-2025)
In recent years, academic interest in low-carbon agriculture theory has been high, as this theory offers a new direction and ideas for sustainable agricultural development (Research interest in low-carbon agriculture theory from 2009 to 2025, as shown in Figure 5). It emphasizes the development of circular agriculture, achieving the organic integration of crop cultivation and animal husbandry; underscores the key role of technological advancements in the development of precision agriculture; focuses on building harmonious rural areas and increasing farmer participation; and advocates the development of low-carbon technologies to promote the ecological transformation of agriculture. Low-carbon agriculture not only meets the demands of ecological environmental protection but also effectively promotes the improvement of agricultural economic and social benefits, with broad development prospects.
The rapid development of the digital economy has provided strong technological support for the implementation of low-carbon agriculture. Through digital technologies such as the Internet of Things (IoT) in agriculture, cloud computing, and big data, agricultural production processes have become more information-based, precise, and intelligent, thereby significantly improving resource utilization efficiency and reducing carbon emissions. For instance, sensors and drones are used to collect multi-source data from farmlands, enabling precision operations that reduce the use of fertilizers and pesticides; digital farming systems improve resource conversion efficiency; and blockchain technology is employed to trace agricultural products, reducing food waste. The application of these technologies not only optimizes the agricultural production process but also provides strong support for the practice of low-carbon agriculture.
Furthermore, the digital economy has expanded the application fields of low-carbon agriculture. Through digital platforms, low-carbon agricultural products can be more widely promoted and advertised; the Internet reduces intermediaries, enabling a direct sales model for agricultural products to consumers; the development of green food e-commerce further expands the market space for low-carbon agricultural products. Meanwhile, the widespread adoption of digital technologies allows for smoother flows of talent, technology, and information into rural and agricultural sectors, injecting new vitality into agricultural modernization. Overall, the flourishing digital economy will accelerate the application and diffusion of low-carbon agriculture theory in practice, playing a crucial role in promoting the green development of agriculture.
4. Theoretical explanation II: based on the theory of spatial and temporal dynamic effects
The empowerment of agricultural development through digital technologies such as the Internet, big data, and cloud computing has become a new trend, providing new opportunities for agricultural modernization and new pathways for the low-carbon, efficient development of agriculture. Based on the theory outlined in the “Theoretical Deduction I” section, this section will further explore the mechanism and path through which the digital economy affects agricultural carbon reduction from four aspects: direct impact, transmission mechanism, temporal dynamic effects, and spatial spillover effects. This section’s theoretical analysis framework is shown in Figure 6.
Introducing digital technologies as new elements into the agricultural production system will provide digital technical support for input factors, production monitoring, and farm machinery operations in the agricultural production process, directly reducing agricultural carbon emissions. The carbon reduction effects of this digital technology have three main mechanisms: First, with the introduction of advanced digital technologies such as the Internet, intelligent systems, and sensor technologies, agricultural operators can precisely control the optimal and most efficient input levels for crop growth through real-time transmission and historical data, thus reducing dependence on elements such as pesticides and fertilizers from the source. Second, research by Guan and Lei suggests that the introduction of digital technologies enables agricultural operators to monitor, predict, and track the environment, planting, and agricultural disasters in real time, leading to intelligent decision-making, scientific management, and precise control in agricultural production. Third, the introduction of digital technologies can directly transform mechanized agricultural tools. Li and Zhou mentioned in their research that the use of smart agricultural machinery, intelligent irrigation, and water-fertilizer integration systems can achieve precise matching of agricultural production elements, realizing standardized, efficient, and green agricultural production.
Combining digital technologies with agricultural development through accurate and effective information matching can enhance farmers’ natural and financial capital levels, indirectly reducing agricultural carbon emissions. The carbon reduction effects of this digital technology have two main mechanisms: First, the use of Internet-based digital platforms helps agricultural operators more efficiently obtain land supply-demand information, reduce the costs of land transactions and transfers, improve the efficiency of matching transactions between supply and demand parties, increase transaction price transparency, and promote the transfer of productive rural land. Meanwhile, the expansion of land scale and concentrated land operation creates a “scale effect” conducive to the scientific and rational use of modern agricultural production elements, thereby achieving the goal of agricultural carbon reduction. Second, the widespread dissemination of digital inclusive finance benefits agricultural development by providing financial support, speeding up the circulation of funds, and improving capital allocation efficiency. The conditions required for applying inclusive finance loans will filter out more efficient, low-carbon, and green agricultural practices, helping them grow and strengthen, indirectly achieving agricultural carbon reduction goals.
Introducing digital technologies into the agricultural production field will provide new pathways to increase knowledge and improve production skills for agricultural operators, thus indirectly reducing agricultural carbon emissions by changing farmers’ environmental awareness and enhancing their low-carbon literacy. The carbon reduction effects of this digital technology have two main mechanisms: First, the development of digital technologies helps improve farmers’ information difficulties, eliminate information asymmetry, reduce the costs of information search, and introduce new ideas and technologies to enhance farmers’ awareness of the risks of extensive production methods, leading them to voluntarily reduce agricultural carbon emissions. Additionally, farmers can learn about agricultural carbon emissions and related carbon reduction measures through online learning platforms, forming a “knowledge effect” that drives them to engage in green production. Second, methods such as video streaming can help farmers master the basic operations of green production technologies, increasing their knowledge of green production technologies and improving their low-carbon literacy, forming a “literacy effect” that promotes green production.
The above theoretical deduction can be summarized as the analysis of the agricultural carbon reduction effects of digital economy from three perspectives: “technological innovation effects,” “factor allocation effects,” and “human capital effects.” Based on this, the paper will further analyze the agricultural carbon reduction effects of the digital economy, deepening the discussion from the perspectives of “spatial spillover effects” and “temporal dynamic effects,” and explore new areas of argument for the empirical analysis in later sections.
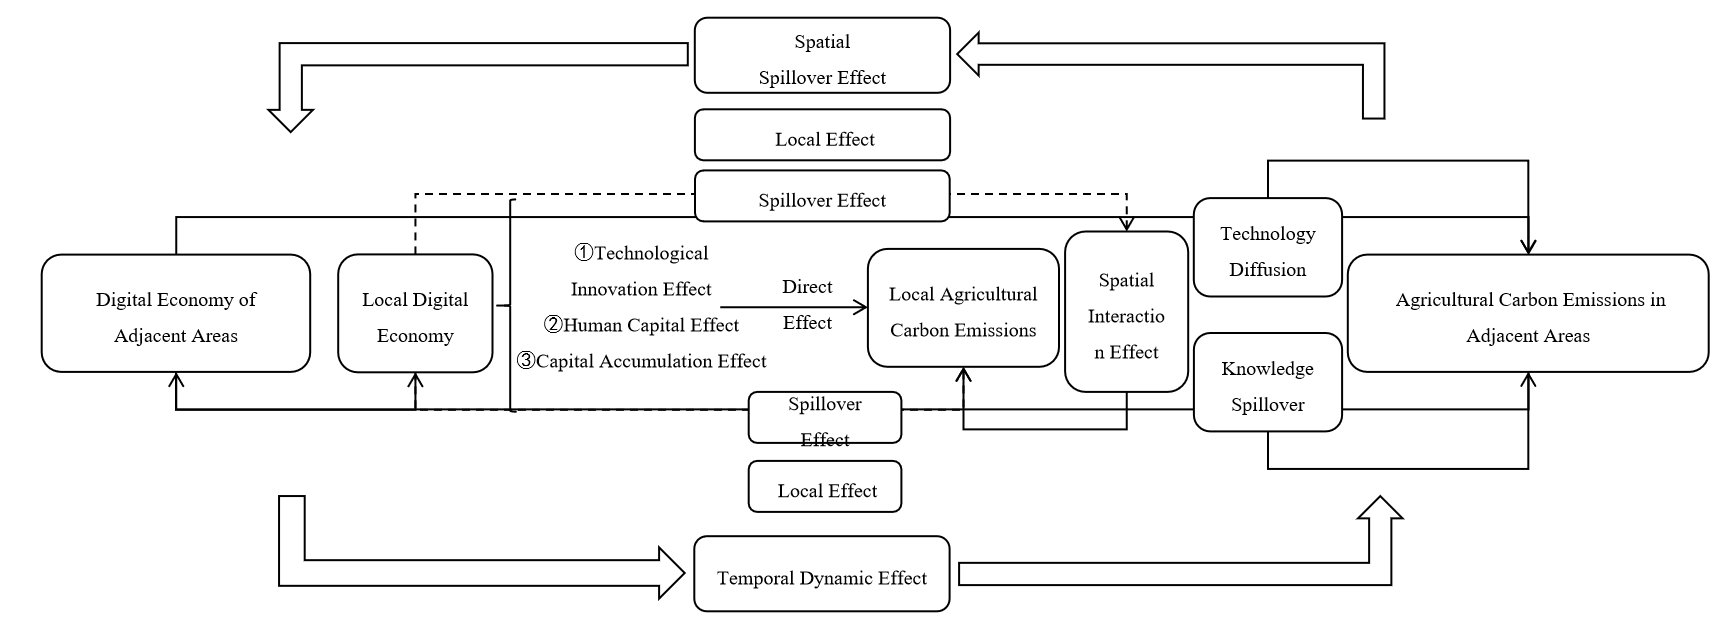
Figure 6. Analysis of digital economy’s empowerment of agricultural carbon reduction mechanism
During the time as a research assistant at the CIDEG Research Center at Tsinghua University, involvement was in Dr. Han Zixuan’s postdoctoral research on “The Impact of Digital Economy on Traditional Spatial and Geographical Patterns.” This research experience provided a deeper understanding of the spatial spillover effects of the digital economy, which also exhibit similar effects in the agricultural sector with the introduction of digital technologies. This paper will analyze the spatial spillover effects of the digital economy’s development on agricultural carbon emissions. Research in this area has a certain foundation. Wang argues that there is spatial autocorrelation between the development of the digital economy and agricultural carbon emissions. Specifically, the spatial spillover effects of the digital economy’s impact on agricultural carbon emissions include two aspects: First, knowledge spillover-type spatial spillover effects. The digital economy, through efficient information transmission technologies, can eliminate resource distribution limitations between regions, accelerate the sharing of knowledge and technology, and allow knowledge and information to flow freely. This creates a dissemination effect of information and knowledge, strengthening connections between regions and promoting interaction between urban and rural areas. In other words, knowledge spillover effects will have a profound impact on the digital economy development and agricultural carbon emission levels in neighboring regions. Second, technology diffusion-type spatial spillover effects. Driven by the digital economy, new production technologies used by agricultural operators will rapidly spread to surrounding areas and even broader regions, creating a positive demonstration effect for neighboring areas to emulate and learn. This emulation and demonstration effect will not only promote the renewal and iteration of agricultural production technologies but also facilitate the spatial diffusion and spread of green management concepts across different regions, agricultural sectors, and farmers, improving regional agricultural environments and promoting the implementation of green production concepts [5]. Therefore, the digital economy will not only generate agricultural carbon reduction effects in the local area but also create spillover effects in neighboring regions.
The core of “Theoretical Deduction II” is the theory of spatial and temporal dynamic effects, with temporal dynamic effects corresponding to spatial spillover effects. The development of the digital economy is a dynamic and ongoing process, and its impact on agricultural carbon emissions will gradually intensify over time. On one hand, during the early stages of digital economy development, factors such as imperfect digital infrastructure, insufficient application of information technologies, and incomplete data acquisition systems hinder the effective integration of digital technologies with traditional agriculture. On the other hand, the carbon reduction effects of digital economy development are closely related to the support provided by digital technologies, but the process of technological innovation, research, development, and promotion takes a relatively long time. At the same time, the improvement of farmers’ human capital is an accumulative process. In the early stages of digital economy development, the digital divide among farmers will make it difficult for the carbon reduction effects of the digital economy in agriculture to manifest quickly. Given that the agricultural carbon reduction effects of digital technologies will be limited in the short term, it can be inferred that the carbon reduction effects of the digital economy in agriculture have a time lag. This will be further analyzed in the empirical section.
5. Path mechanism of digital economy’s impact on agricultural carbon reduction
The digital economy directly influences agricultural carbon reduction in various ways, with its mechanisms primarily manifested in the following aspects:
First, digital technologies empower precision agricultural production. As key indicators of technological progress, digital technologies and data elements are accelerating their integration into the food production process, directly contributing to carbon reduction. The digital economy, with data as its core element and the internet as its carrier, provides more precise and efficient technical support for food production. For example, data collected through sensors and meteorological stations can be used to formulate precise planting plans, enabling refined management of soil, seeds, water, and fertilizers, thereby reducing the use of chemical fertilizers and pesticides and decreasing agricultural non-point source pollution. Furthermore, crop growth simulation systems (such as CropSys and WOFOST) and the DATARICE system allow for early yield predictions and the formulation of optimal cultivation strategies. The application of these technologies has enhanced the scientific level of food production, directly reducing agricultural carbon emissions.
Second, the integration of digital elements optimizes the structure of agricultural input factors. The digital economy reshapes the allocation structure of production factors based on the actual conditions of food production, improving allocation efficiency and generating significant multiplier effects on the efficiency of other factors. From an economic perspective, effective resource allocation is key to improving production efficiency and economic growth. The integration of the digital economy is viewed as technological innovation that improves the ways of acquiring, processing, and analyzing information, thereby enhancing the efficiency of resource distribution. Innovation diffusion theory suggests that technological progress and its application can drive industrial transformation and efficiency improvements. The new technologies brought by the digital economy make food production more knowledge-intensive and technology-intensive, further improving production efficiency. Internet technologies allow agricultural producers to share advanced production elements such as machinery, seed varieties, and technical knowledge. The digital economy also reduces transaction costs through the platform economy, optimizing the allocation of production factors. Digital management precision improves the utilization efficiency of natural resources like land. Internet platforms can effectively integrate and reallocate scattered agricultural resources, not only enhancing the efficiency of existing elements but also bringing innovative and high-efficiency new factors to agricultural production. Thus, the optimization of the agricultural production input structure enhances food production efficiency, which in turn reduces agricultural carbon emissions.
Third, the improvement of digital infrastructure optimizes the environment for food production and transforms the way food production and operation are conducted. The application of digital technologies has promoted the scale, specialization, and precision of food production, facilitating the rapid development of new agricultural business entities. Personalized customization and digital warehousing make food supply more precise and effective, while online trading platforms reduce carbon emissions in circulation. These new digital food production models greatly improve production efficiency and effectively reduce carbon emissions. Digitalization also enables full traceability, encouraging businesses to pay more attention to the environmental impact of their production. The digital transformation has made green, low-carbon food production possible. (Path mechanism of digital economy’s impact on agricultural carbon reduction as shown in Figure 7)
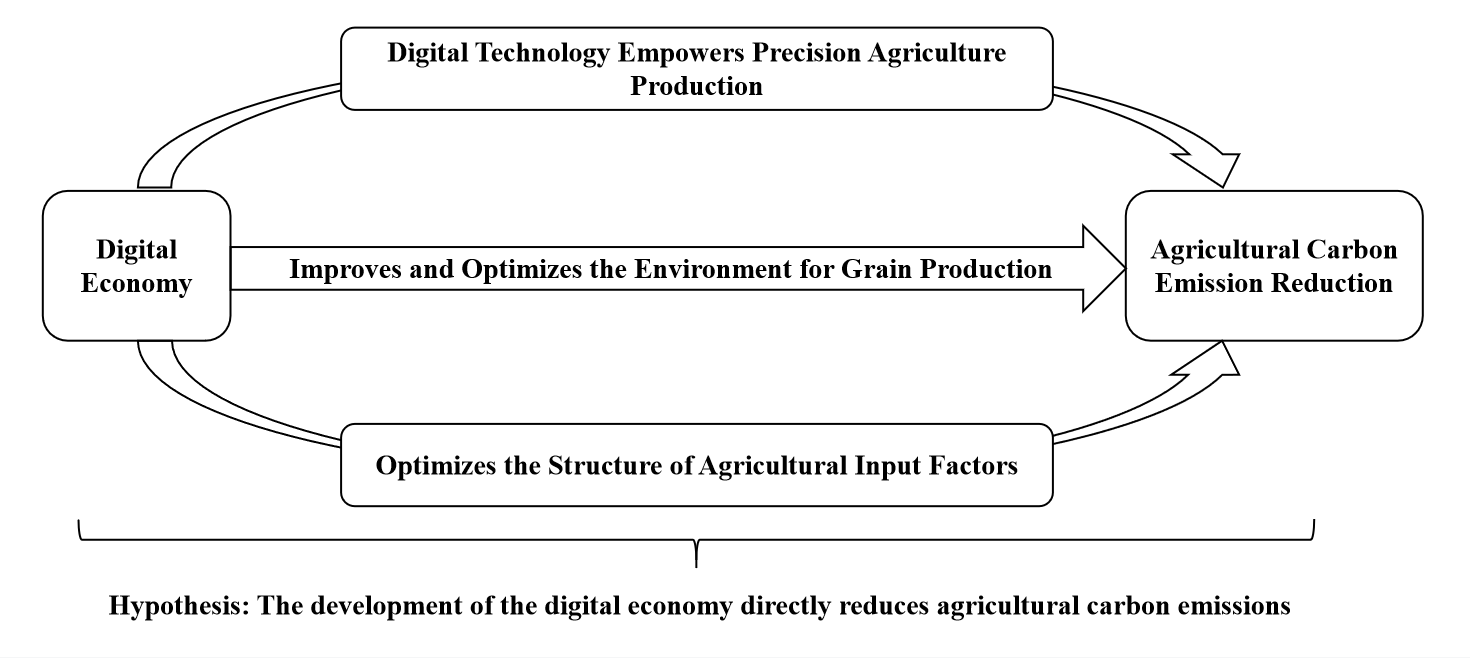
Figure 7. Path mechanism of digital economy’s impact on agricultural carbon reduction
Based on the analysis paradigm above, the following hypothesis is proposed: The development of the digital economy directly reduces agricultural carbon emissions.
6. Current situation and measurement indicators of digital economy and agricultural carbon emissions in Henan Province
6.1. Current situation of digital economy development in Henan Province
As a major economic province, Henan has made significant achievements in the development of the digital economy. With the rapid development of information technology and the deepening of digital transformation, the scale of Henan’s digital economy continues to expand. According to statistics from Henan Province, the total scale of the digital economy reached a new height in 2023, achieving significant growth throughout the year.
6.1.1. Digital infrastructure
By the end of 2023, Henan Province had made significant progress in digital infrastructure construction. The number of fiber-optic broadband users in the province surpassed 40 million, and the number of Internet of Things (IoT) connections exceeded 1 billion. The rapid development of 5G networks has laid a solid foundation for the development of the digital economy. In terms of data center construction, Henan has built one national-level data center cluster and two provincial-level data center clusters, with a total of more than 300,000 server racks (Seen as Figure 8).
According to data from Figure 1 (Number of Broadband Access Users in Henan Province), the number of broadband access users in Henan increased from approximately 41 million households in July 2023 to about 43.5 million households in April 2024, showing steady growth. This provides a strong foundation for the development of the digital economy.
Figure 8. Number of broadband access users in Henan Province (in ten thousand households)
6.1.2. Digital industrialization
Henan Province has also made significant achievements in the industrialization of digital technologies (For example, the number of patent applications in Henan Province as shown in Figure 9). In 2023, the software and information service industry in Henan reached a total output value of over 500 billion yuan, with a year-on-year growth of 18%. The software industry in Zhengzhou and Luoyang entered the national top ten, and many software and information service enterprises rapidly developed, providing strong support for the development of Henan’s digital economy.
Figure 9. Number of patent applications in Henan Province
6.1.3. Industrial digitalization
Henan Province has made positive progress in the digital transformation of its industries. In 2023, the digital transformation rate of the service industry in Henan reached 45%, with modern services accelerating their development and new business models emerging continuously. Industries such as finance, tourism, and education actively promoted digital transformation, injecting new vitality into economic development.
6.2. Current situation of agricultural carbon emissions in Henan Province
Agricultural carbon emissions in Henan Province refer to the carbon-containing gases emitted during agricultural production and related activities, mainly including carbon dioxide (CO₂), methane (CH₄), etc. Among them, CO₂ emissions mainly come from energy consumption in mechanized operations, indirect emissions during fertilization processes, and other activities; CH₄ emissions mainly result from the reduction processes in paddy fields and livestock digestion; other carbon oxides mainly come from emissions during crop growth and transportation.
6.2.1. Total agricultural carbon emissions in Henan Province
In recent years, the total agricultural carbon emissions in Henan Province have shown a fluctuating trend, rising first and then decreasing. According to data from the Henan Province Statistical Yearbook and related studies, as shown in Figure 11, the total agricultural carbon emissions in Henan in 2010 were 7.9857 million tons, and they increased annually until reaching a peak of 8.6732 million tons in 2015. Since 2016, agricultural carbon emissions have started to decrease, reaching 7.7825 million tons in 2020, a decrease of about 10.3% compared to the 2015 peak. Overall, after a period of growth, agricultural carbon emissions in Henan have started to decrease, mainly due to efforts in Henan’s agricultural green and low-carbon transformation, including the promotion of precision agriculture technologies, optimization of the agricultural industrial structure, and reduction in the use of chemical fertilizers and pesticides. This reduction in carbon emissions lays a foundation for Henan’s future carbon peak and carbon neutrality goals.
Figure 10. Agricultural carbon emissions in Henan Province from 2010 to 2023
Regarding the proportion of emissions from different carbon sources, as shown in Figure 12, fertilizers were the largest carbon emission source in Henan’s agricultural sector in 2020, accounting for 74.57%. The second largest source was agricultural diesel, which accounted for 7.42%, reflecting the development of agricultural mechanization and its contribution to carbon emissions. Pesticide emissions accounted for 6.49%, and agricultural plastic films accounted for 10.10%. Although these two sources were not as significant as fertilizers, they are also important components of agricultural carbon emissions.
Figure 11. Proportion of carbon emissions from different carbon sources in agricultural sector of Henan Province in 2020
6.2.2. Agricultural carbon emission intensity in Henan Province
Agricultural carbon emission intensity refers to the amount of carbon emissions generated per unit of total agricultural output value, and it is an important indicator for assessing the efficiency of agricultural carbon reduction. In recent years, the carbon emission intensity of agriculture in Henan Province has shown a downward trend, reflecting an improvement in the low-carbon nature of agricultural production. As shown in the Figure 12, from 2010 to 2020, Henan’s agricultural carbon emission intensity exhibited a fluctuating upward trend followed by a slight decrease. In 2015, the carbon emission intensity in Henan reached a peak of 2.1400 tons per hectare, and after 2016, it began to decline in a fluctuating manner. It is evident that the series of emission reduction measures adopted in Henan’s agricultural sector started to show positive results. Although there was a slight rebound in carbon emission intensity in 2019, overall, Henan has made certain progress in improving agricultural production efficiency and reducing carbon emissions. This lays a foundation for promoting the province’s low-carbon and green agricultural development and sustainable growth.
Figure 12. Agricultural carbon emission intensity in Henan Province from 2010 to 2020
6.2.3. Policies and measures for agricultural carbon emissions in Henan Province
To promote agricultural carbon reduction and green, low-carbon development, the Henan provincial government has introduced a series of policies and measures. In February 2022, the People’s Government of Henan Province issued the “14th Five-Year Plan for Rural Revitalization and Agricultural Modernization in Henan Province,” explicitly proposing the implementation of green and low-carbon transformation. In 2023, the Communist Party of Henan Provincial Committee and the People’s Government of Henan Province jointly issued the “Carbon Peak Implementation Plan,” outlining carbon peak action plans across various sectors including energy, industry, construction, transportation, and agriculture, while emphasizing the coordination of development and emission reduction to promote the green and low-carbon transformation of the economy and society. In 2023, seven related departments, including the Henan Provincial Department of Ecology and Environment, issued the “Henan Province Collaborative Pollution Reduction and Carbon Reduction Action Plan,” which emphasizes promoting the coordinated development of pollution reduction and carbon reduction in agriculture, encouraging the adoption of green agricultural technologies and production models to reduce carbon emissions in agricultural activities. These policies provide clear directions and policy support for agricultural carbon reduction in Henan Province. Meanwhile, meteorological research in Henan has also provided theoretical support for carbon sequestration in agriculture. Studies on the carbon sequestration potential of agriculture have played a role in optimizing farmland management and improving soil quality.
Overall, Henan’s agricultural carbon emission policies fully reflect the concept of “emission reduction and carbon sequestration” working in parallel. Combining the actual needs of agriculture with technological innovation, industrial transformation, and policy guidance, the province is promoting green, low-carbon agricultural development, contributing to the achievement of the provincial carbon peak and carbon neutrality targets.
6.3. Digital economy development index in Henan Province
Measurement method for the digital economy development index.This paper uses the t-SNE method for constructing the index. t-SNE (t-Distributed Stochastic Neighbor Embedding) is an advanced method for high-dimensional data visualization and dimensionality reduction, first proposed by Matten and Hinton in 2008. Prior to t-SNE, dimensionality reduction and visualization techniques such as PCA (Principal Component Analysis) and LLE (Local Linear Embedding) existed. However, these methods have certain limitations when dealing with high-dimensional non-linear data. To address these limitations, the t-SNE algorithm was introduced, aiming to better preserve the local structure of high-dimensional data. The main innovation of t-SNE lies in using a probabilistic approach to measure the similarity between high-dimensional data points and preserving these similarities as much as possible in the lower-dimensional space. t-SNE employs a special probability distribution (t-distribution), which can effectively handle outliers in high-dimensional data and generate better clustering results in low-dimensional space. Specifically:
Assume that the measurement of the digital economy in a certain city contains n dimensions, that is (seen as equation 1):
\( X=[{x_{1}},{x_{2}},…,{x_{n}}] \) (1)
The goal is to reduce the vector X to a lower dimension (seen as equation 2):
\( Y=[{y_{1}},{y_{2}},…,{y_{n}}] \) (2)
Here, \( p \lt \lt n \) , the dimensionality reduction aims to preserve the similarity features of data points in high-dimensional space into lower-dimensional space, generally using Euclidean distance as a similarity measure. The SNE algorithm converts distance relationships into probabilities to represent the features of data before and after dimensionality reduction. To facilitate further discussion, KL divergence, also known as relative entropy, is introduced. This measure quantifies the difference between two probability distributions over the same event space. It is expressed as equation (3):
\( D(p||q)=\sum _{x∈X}p(x)log{\frac{p(x)}{q(x)}} \) (3)
Assume two points, \( {x_{i}} \) and \( {x_{j}} \) , in the high-dimensional space, where point \( {x_{i}} \) selects point \( {x_{j}} \) as its neighboring point with conditional probability, and the probability is defined using a normal distribution, \( {p_{j|i}} \) (seen as equation 4):
\( {p_{j|i}}=\frac{exp{(}-{|{x_{i}}-{x_{j}}|^{2}}/2{σ^{2}})}{\sum _{k≠i}exp{(}-{|{x_{i}}-{x_{j}}|^{2}}/2{σ^{2}})} \) (4)
Where, \( {σ_{i}} \) is the variance of the normal distribution centered at \( {x_{i}} \) , and \( {p_{i|i}}=0 \) .
Points \( {x_{i}} \) and \( {x_{j}} \) are mapped in the corresponding low-dimensional space as \( {y_{i}} \) and \( {y_{j}} \) . Similarly, the conditional probability in the low-dimensional space is defined as \( {q_{j|i}} \) . For simplification, the variance of the normal distribution in the low-dimensional space is defined \( \frac{1}{\sqrt[]{2}} \) (seen as equation 5):
\( {q_{j|i}}=\frac{exp{(}-{|{y_{i}}-{y_{j}}|^{2}})}{\sum _{k≠i}exp{(}-{|{y_{i}}-{y_{k}}|^{2}})} \) (5)
Similarly, \( {q_{i|i}}=0 \) .
Considering the probability relationships between all other points and \( {x_{i}} \) , they are represented as \( {P_{i}} \) , and similarly, the probability relationships between all other points and \( {y_{i}} \) in the low-dimensional space are represented as \( {Q_{i}} \) . If the relationships between the points in the two spaces are well preserved, \( {P_{i}} \) and \( {Q_{i}} \) will approximate each other. KL divergence is used to represent this similarity. The optimization objective of SNE is to minimize the KL divergence between all data points, and its cost function is as equation (6):
\( C=\sum _{i}KL({P_{i}}||{Q_{i}})=\sum _{i}\sum _{j}{P_{j|i}}log{\frac{{p_{j|i}}}{{q_{j|i}}}} \) (6)
Using gradient descent to compute the gradient of the above equation gives (seen as equation 7):
\( \frac{∂c}{∂{y_{i}}}=2\sum _{j}({p_{j|i}}-{q_{j|i}}+{p_{i|j}}-{q_{i|j}})({y_{i}}-{y_{j}}) \) (7)
By transforming the equation, the final iterative formula is as equation (8):
\( {Y^{t}}={Y^{t-1}}+η\frac{∂c}{∂{y_{1}}}+α(t)({Y^{t-1}}-{Y^{t-2}}) \) (8)
Where \( η \) is the iteration step size, and \( α(t) \) is the momentum of the t-th iteration. The initial low-dimensional point set is assumed to be randomized as \( {Y^{1}} \) .
However, because KL divergence is not symmetric, as shown in the cost function, when \( {p_{j|i}} \) is large, \( {q_{j|i}} \) is small, and C is high; conversely, C is low. This phenomenon can be described in space: when two points in high-dimensional space are close, if the distance in the low-dimensional space is far, a higher penalty should be added, which makes sense; however, if the distance in the low-dimensional space is close, a lower penalty should be added, which contradicts intuition. Thus, for data points that are far apart, the t-distribution will assign greater weight to them, helping to clarify the structural features of the data in the lower-dimensional space. Using the methods outlined above, the high-dimensional vector x is transformed into a low-dimensional vector y. In this study, the dimension of y is set to 1, which is used to measure the digital economy development index in Henan Province.
Digital economy development index measurement indicator system. The specific results are shown in Table 3.
Table 3. Digital economy development index measurement indicators
Primary Indicator | Secondary Indicator | Explanation | Attribute |
Digital Economy | Number of Internet Broadband Access Households | Number of households with internet broadband access (in ten thousand households) | Positive |
Total Telecommunication Business Volume | Total telecommunication business revenue (in hundred million yuan) | Positive | |
Number of Mobile Phones | Total number of mobile phones in rural areas (in ten thousand units) | Positive | |
Information Transmission, Software and IT Workers | Number of workers in the information industry (in ten thousand people) | Positive | |
Number of Patents | Number of regional patent applications (in ten thousand) | Positive | |
Inclusive Finance Index | Peking University Inclusive Finance Index | Positive | |
Agricultural Credit Issuance | Annual agricultural credit issuance (in hundred million yuan) | Positive |
Digital economy development index measurement results.Over the past 12 years, the digital economy development in Henan Province has shown a significant upward trend, although there have been fluctuations in certain years and regions. As the provincial capital, Zhengzhou has experienced particularly rapid development in its digital economy, growing from 2.454 in 2011 to 7.181 in 2022, demonstrating strong growth momentum. Luoyang and Nanyang have also shown positive growth trends, increasing from 1.886 and 1.254 in 2011 to 4.751 and 3.954 in 2022, respectively. The rapid development of these cities can be attributed to their advantages in new infrastructure construction, high-end talent aggregation, and innovation resource integration. Despite challenges such as regional development imbalances and insufficient infrastructure, Henan Province has the opportunity to receive more policy support and resource investment due to the national emphasis on the development of the central and western regions, which will promote higher-quality development of the digital economy. The specific results are shown in Table 4.
Table 4. Digital economy development index of cities in Henan Province
Region | 2011 | 2012 | 2013 | 2014 | 2015 | 2016 | 2017 | 2018 | 2019 | 2020 | 2021 | 2022 | Average |
Zhengzhou | 2.454 | 2.81 | 3.069 | 4.896 | 4.542 | 4.356 | 4.905 | 5.235 | 5.701 | 6.055 | 6.987 | 7.181 | 4.849 |
Luoyang | 1.886 | 2.128 | 2.884 | 3.441 | 3.531 | 3.443 | 3.522 | 3.571 | 3.551 | 3.967 | 4.338 | 4.751 | 3.418 |
Nanyang | 1.254 | 1.406 | 1.681 | 1.644 | 3.306 | 3.386 | 3.215 | 3.021 | 2.178 | 3.336 | 3.232 | 3.954 | 2.634 |
Xinxiang | 1.704 | 1.930 | 1.891 | 2.294 | 2.706 | 2.939 | 2.856 | 3.125 | 2.679 | 2.637 | 2.769 | 3.690 | 2.602 |
Zhoukou | 1.455 | 1.656 | 1.532 | 2.321 | 2.551 | 2.632 | 2.874 | 3.024 | 3.173 | 3.005 | 3.210 | 3.696 | 2.594 |
Xuchang | 1.182 | 1.330 | 2.031 | 2.097 | 2.114 | 2.355 | 2.407 | 2.491 | 2.604 | 2.852 | 2.715 | 3.401 | 2.298 |
Shangqiu | 1.178 | 1.513 | 1.584 | 1.535 | 1.679 | 1.892 | 2.362 | 2.79 | 1.562 | 2.125 | 2.490 | 3.122 | 1.986 |
Zhumadian | 1.026 | 1.199 | 1.449 | 1.572 | 1.547 | 1.756 | 2.051 | 1.975 | 2.253 | 2.528 | 2.755 | 3.470 | 1.965 |
Xinyang | 1.125 | 1.249 | 1.355 | 1.874 | 1.729 | 1.792 | 1.955 | 1.909 | 1.972 | 1.986 | 2.127 | 2.630 | 1.809 |
Pingdingshan | 0.927 | 1.137 | 1.514 | 1.266 | 1.340 | 1.614 | 1.728 | 1.999 | 2.085 | 2.164 | 2.547 | 3.025 | 1.779 |
Kaifeng | 0.841 | 0.991 | 1.022 | 1.685 | 1.268 | 1.332 | 1.895 | 1.979 | 1.878 | 1.999 | 2.169 | 3.174 | 1.686 |
Anyang | 0.848 | 1.062 | 1.161 | 1.167 | 1.223 | 1.476 | 1.375 | 1.881 | 1.906 | 2.044 | 2.561 | 3.123 | 1.652 |
Jiaozuo | 0.954 | 0.956 | 0.987 | 1.159 | 1.353 | 1.550 | 1.695 | 1.774 | 1.838 | 1.981 | 2.171 | 3.121 | 1.628 |
Puyang | 0.941 | 1.157 | 1.284 | 1.258 | 1.565 | 1.505 | 1.664 | 1.639 | 1.576 | 1.651 | 1.579 | 2.634 | 1.538 |
Luohe | 0.846 | 0.823 | 1.036 | 1.151 | 1.239 | 1.367 | 1.496 | 1.497 | 1.450 | 1.624 | 1.657 | 2.515 | 1.392 |
Sanmenxia | 0.881 | 0.925 | 1.117 | 1.051 | 1.167 | 1.192 | 1.281 | 1.388 | 1.423 | 1.699 | 1.741 | 2.571 | 1.370 |
Hebi | 0.835 | 0.876 | 1.012 | 1.034 | 1.139 | 1.164 | 1.216| | 1.364 | 1.411 | 1.623 | 1.678 | 2.167 | 1.293 |
Jiyuan | 0.876 | 1.0113 | 1.043 | 1.046 | 1.137 | 1.143 | 1.217 | 1.327 | 1.406 | 1.611 | 1.681 | 2.511 | 1.334 |
6.4. Agricultural carbon emission index of Henan Province
6.4.1. Measurement method of agricultural carbon emission index
Based on existing research in academia, this study uses the following formulas to calculate the agricultural carbon emission index of Henan Province.
Carbon Emissions in the Agricultural Production Factor Input Process (seen as equation 9):
\( {C_{T}}=\sum _{j=2000}^{2022}\sum _{i=1}^{n}{c_{ij}}*{T_{ij}} \) (9)
Where 𝑖 represents the type of crop input, j represents the year, \( {c_{i}} \) represents the carbon emission coefficient for different agricultural factor inputs, and T represents the crop yield; \( {C_{T}} \) represents the total carbon emissions from factor inputs.
Carbon Emissions in the Crop Growth Process (seen as equation 10):
\( {C_{Z}}=\sum _{j=2000}^{2022}\sum _{i=1}^{n}{r_{ij}}*{Z_{ij}} \) (10)
Where 𝑖 represents the crop type, j represents the year, \( {r_{i}} \) represents the carbon emission coefficient for different crops, and Z represents the crop yield. \( {C_{Z}} \) represents the total carbon emissions from crops.
After calculating the carbon emissions for agricultural production factors and the crop growth process, the total agricultural carbon emissions in Henan Province are (seen as equation 11):
\( T={C_{T}}+{C_{Z}} \) (11)
The equation (12) for calculating the total carbon emissions in different years is:
\( {T_{j}}={C_{Tj}}+{C_{Zj}} \) (12)
Where j represents the year.
The carbon emission intensity is defined as equation (13):
\( {C_{ej}}=\frac{{T_{j}}}{{G_{j}}} \) (13)
Where, \( {T_{j}} \) is the total carbon emissions, and \( {G_{j}} \) is the agricultural gross output value.
6.4.2. Agricultural carbon emission index measurement system
Table 5. Agricultural factor input carbon emissions
Carbon Emission Source | Emission Coefficient | Data Source |
Fertilizer production, transportation, and usage | 0.8956 Kg(C)/Kg | Henan Province Statistical Yearbook |
Pesticide production, transportation, and usage | 4.9341 Kg(C)/Kg | China Agricultural University |
Agricultural film production, transportation, and usage | 5.1862 Kg(C)/Kg | Henan Province Statistical Yearbook |
Irrigation electricity consumption | 20.476 Kg(C)/Kg | China Agricultural University |
Land plowing | 312.62 Kg(C)/Kg | Henan Province Statistical Yearbook |
Agricultural machinery diesel | 0.5927 Kg(C)/Kg | Henan Province Statistical Yearbook |
The agricultural factor input carbon emission coefficients in Table 5 are compiled based on data from the Henan Province Statistical Yearbook and related authoritative research, reflecting the carbon emission intensity of various agricultural input factors in the production, transportation, and usage processes. These coefficients are key parameters for estimating the total agricultural carbon emissions in Henan Province and provide foundational data support for the empirical analysis in this paper. Through these coefficients, the usage of agricultural input factors can be quantitatively linked to carbon emissions, enabling an accurate assessment of carbon emission characteristics in agricultural production. The selection of these coefficients comprehensively considers the actual agricultural production conditions in Henan Province, ensuring their scientific accuracy and applicability.
Table 6. Carbon emission coefficients for selected crops
Crop Name | Growth Process Emission Coefficient | Straw Burning Emission Coefficient | Crop Residue Emission Coefficient | Total Emissions |
Rice | 1.0 | 0 | 0.4 | 1.4 |
Rice | 1.2 | 0 | 0.4 | 1.6 |
Corn | 1.1 | 0 | 0.3 | 1.4 |
Grains | 1.4 | 0 | 0.0 | 1.4 |
Soybeans | 0 | 0 | 0.1 | 0.1 |
Cotton | 0.9 | 0 | 0.0 | 0.9 |
Rapeseed | 0.4 | 0 | 0.1 | 0.5 |
Vegetables | 1.9 | 0 | 0.0 | 1.9 |
Source: China Agricultural University, FAO, 2022. Unit: kg(C)/kg (yield).
To further clarify the boundaries of various carbon emission activities, this paper classifies emissions based on two dimensions: time and source. Firstly, from the time dimension, carbon emissions can be divided into baseline carbon emissions during the natural growth phase of crops, carbon emissions from agricultural factor inputs, and carbon emissions from agricultural waste treatment. Secondly, from the source dimension, emissions can be classified into biological emissions caused by crop growth, industrial emissions resulting from inputs such as machinery and fertilizers, and ancillary emissions from waste treatment and energy consumption. By integrating these two classification methods, a time-dimensional analytical framework can be constructed, which includes three types of carbon emissions—natural growth, agricultural input, and waste treatment—while also incorporating the time dimension. This multidimensional approach allows for a clear definition of the scope of agricultural carbon emissions, providing foundational methodological support for specific measurements and calculations. The framework is illustrated in the Figure 13 and Table 6.
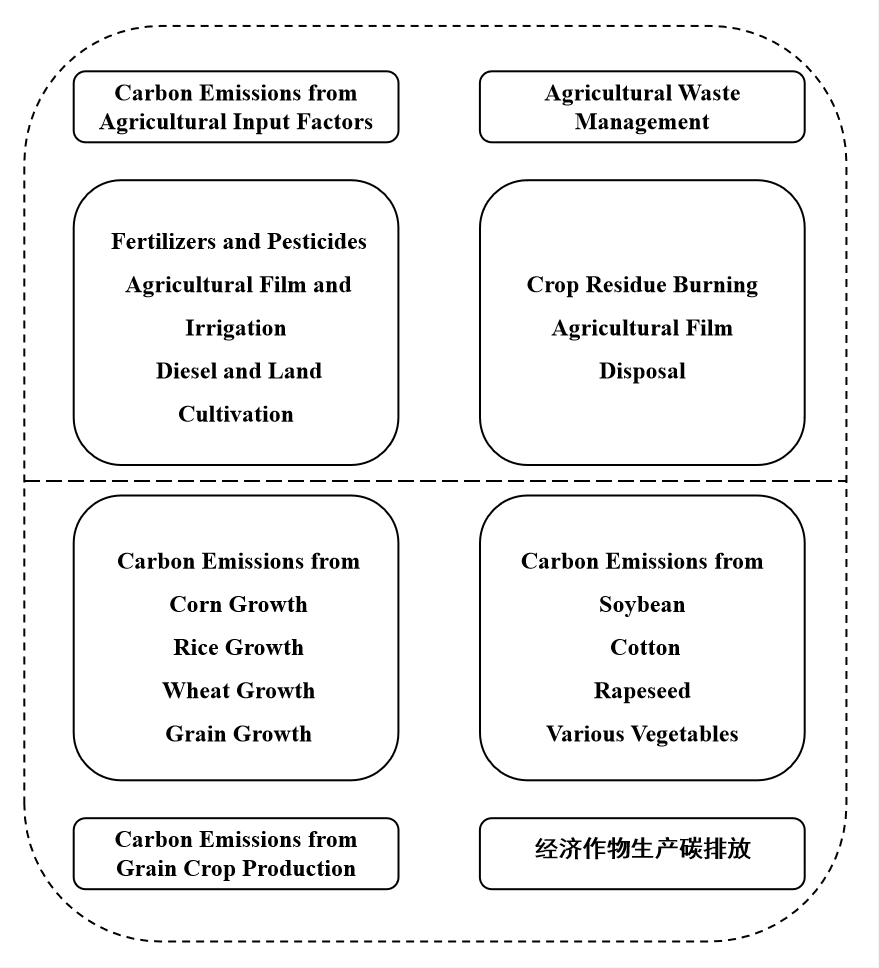
Figure 13. Agricultural carbon emission measurement system in Henan Province
(Note: “经济作物生产碳排放” means “Carbon emissions from cash crop production”)
6.4.3. Agricultural carbon emission index measurement results
The specific results are shown in Table 7.
Table 7. Agricultural carbon emission index by city in Henan Province
Region | 2011 | 2012 | 2013 | 2014 | 2015 | 2016 | 2017 | 2018 | 2019 | 2020 | 2021 | 2022 | Average |
Zhengzhou | 131.8 | 124.0 | 140.4 | 131.9 | 186.7 | 113.7 | 181.4 | 120.0 | 123.7 | 148.8 | 164.7 | 137.5 | 142.0 |
Luoyang | 180.8 | 196.0 | 119.1 | 89.10 | 108.4 | 193.7 | 110.3 | 166.3 | 123.4 | 84.4 | 116.4 | 153.2 | 136.7 |
Nanyang | 32.80 | 33.70 | 57.90 | 66.80 | 60.60 | 74.60 | 34.40 | 48.80 | 41.00 | 61.9 | 58.70 | 63.10 | 152.9 |
Xinxiang | 58.30 | 57.70 | 67.40 | 82.70 | 72.30 | 61.60 | 72.90 | 101.7 | 64.50 | 40.70 | 90.10 | 80.60 | 170.9 |
Zhoukou | 38.10 | 45.10 | 47.80 | 53.70 | 65.80 | 68.30 | 87.80 | 92.20 | 76.70 | 77.40 | 106.2 | 79.8 | 69.9 |
Xuchang | 88.50 | 115.4 | 110.1 | 121.6 | 103.0 | 120.7 | 150.7 | 145.3 | 145.6 | 101.6 | 173.5 | 108.3 | 123.7 |
Shangqiu | 244.8 | 313.5 | 232.4 | 251.6 | 215.6 | 307.5 | 238.6 | 233.9 | 265.6 | 309.1 | 273.3 | 294.4 | 265.0 |
Zhumadian | 226.7 | 192.8 | 189.8 | 282.5 | 222.2 | 284.1 | 231.7 | 212.4 | 247.6l | 112.7 | 231.0 | 251.8 | 221 6 |
Xinyang | 64.50 | 79.90 | 144.4 | 130.4 | 112.9 | 126.1 | 159.3 | 127.9 | 124.5 | 123.9 | 115.1 | 147.3 | 121.3 |
Pingdingshan | 54.20 | 67.10 | 55.50 | 67.90 | 65.70 | 73.50 | 90.10 | 69.60 | 75.70 | 70.40 | 71.60 | 81.20 | 70.20 |
Kaifeng | 68.60 | 67.00 | 71.40 | 64.20 | 74.50 | 59.20 | 58.05 | 73.90 | 73.80 | 68.00 | 51.90 | 67.10 | 166.5 |
Anyang | 74.30 | 82.20 | 91.00 | 99.80 | 108.7 | 117.5 | 126.3 | 135.1 | 144.0 | 152.8 | 161.6 | 176.4 | 122.5 |
Jiaozuo | 145.7 | 158.2 | 172.9 | 189.5 | 205.1 | 220.8 | 235.3 | 250.9 | 266.5 | 282.0 | 297.6 | 296.5 | 226.7 |
Puyang | 176.2 | 158.3 | 207.5 | 141.0 | 164.6 | 178.4 | 188.2 | 140.6 | 196.8 | 329.6 | 111.9 | 254.4 | 187.3 |
Luohe | 142.9 | 127.8 | 185.4 | 185.0 | 231.2 | 179.6 | 220.3 | 175.6 | 246.6 | 219.0 | 178.7 | 213.2 | 192.1 |
Sanmenxia | 174.3 | 147.4 | 178.7 | 220.2 | 113.0 | 161.2 | 175.7 | 269.7 | 154.4 | 140.7 | 220.8 | 232.2 | 182.3 |
Hebi | 102.5 | 112.7 | 120.6 | 123.8 | 109.3 | 102.5 | 130.2 | 74.70 | 89.30 | 128.5 | 108.8 | 132.2 | 111.2 |
Jiyuan | 192.5 | 240.4 | 323.6 | 211.2 | 168.6 | 242.9 | 221.1 | 304.0 | 250.3 | 318.5 | 248.5 | 309.3 | 260.2 |
7. Empirical analysis of the digital economy’s empowerment of agricultural carbon emissions in Henan Province
7.1. Selection of variables for the econometric model
7.1.1. Dependent variable: agricultural carbon emission index
This paper selects agricultural carbon emissions as the dependent variable. The variable is calculated using the carbon emission coefficient method, which sums the carbon emissions from agricultural activities, certain crop growth processes, agricultural input factors, and the treatment of crop waste. The detailed calculation index system has already been discussed, and therefore will not be repeated here. In the robustness test, this paper also includes the carbon emission intensity index, which represents the ratio of agricultural carbon emissions to total agricultural output value, measuring carbon emissions per unit of output value.
7.1.2. Independent variable: digital economy development index
The digital economy constructed in this paper encompasses five aspects: innovation capacity, infrastructure, financial environment, integrated applications, and digital economy industry indicators. The specific measurement methods use indicators such as the number of broadband internet accesses, total telecommunications business volume, number of mobile phones, number of information technology professionals, and the inclusive finance index. For ease of subsequent statistical analysis, the t-SNE method is employed for dimensionality reduction, resulting in a one-dimensional vector that measures the level of digital economy development in Henan Province. The specific results are shown in Table 8.
Table 8. Variable selection (variable types and indicators) and definitions
Variable Type | Variable Indicator | Description |
Dependent Variable | Agricultural Carbon Emissions | Calculated using the emission coefficient method, measuring the total carbon emissions from agricultural input, crop growth, and agricultural waste treatment (10,000 tons). |
Agricultural Carbon Emission Intensity | The ratio of agricultural carbon emissions to agricultural output, measuring carbon emissions per unit of agricultural output value (10,000 tons/10,000 RMB). | |
Independent Variable | Digital Economy | Comprising five aspects: innovation capacity, infrastructure, financial environment, integrated applications, and digital industry indicators. Using t-SNE, the data is reduced to a one-dimensional vector to measure the development of the digital economy in Henan Province. |
Rural Population Size | The number of registered rural residents at the end of the year (10,000 people). | |
Urbanization Level | The level of urbanization in the region. | |
Rural Residents’ Consumption Level | Measures the consumption level of rural residents (RMB). | |
Agricultural Industry Structure | The ratio of agricultural output to GDP, measuring the structure of the agricultural industry. | |
Agricultural Mechanization Level | Measures the extent of industrial machinery usage (kilowatts). | |
Mediating Variable | Agricultural Technological Progress | Per capita agricultural output, the ratio of agricultural output to rural population. |
Agricultural Planting Structure | The proportion of grain crops, the ratio of grain output to total agricultural output. |
7.1.3. Control variableⅠ: rural population size
Henan Province, a key agricultural province in China, has a large and widely distributed rural population. However, there are significant differences in rural population sizes between different cities and regions. Starting with the provincial capital, Zhengzhou, as the political, economic, and cultural center of Henan, the level of urbanization in Zhengzhou is relatively high, with fewer rural residents within the city’s districts. Luoyang, as a secondary city in Henan, also has a moderately sized rural population. In contrast, traditional agricultural cities in eastern and southern Henan, such as Zhoukou, Shangqiu, Zhumadian, and Nanyang, have a rural population significantly larger than the urban population. These areas maintain a strong agricultural atmosphere and have a larger rural population. In terms of geographical distribution, rural populations are more concentrated in the eastern plain areas (such as Zhoukou, Shangqiu) and the southern regions (such as Zhumadian, Nanyang), while the rural populations in the western mountainous areas (such as parts of Sanmenxia and Luoyang counties) and northern regions (such as Anyang, Hebi) are more dispersed. Overall, rural population sizes in various cities in Henan Province are significantly influenced by geographic location, economic development, and agricultural resource endowments, resulting in clear regional differences. To mitigate the impact of these regional differences on the empirical results, rural population size will be selected as one of the control variables in this study.
7.1.4. Control variableⅡ: urbanization level
Due to factors such as geographic location, resource endowments, and industrial structure, urbanization levels vary considerably across different cities in Henan Province. In terms of spatial distribution, economically developed cities like Zhengzhou and Luoyang, with convenient transportation and flourishing industry and commerce, have relatively high urbanization levels. In contrast, traditional agricultural areas in eastern and southern Henan, such as Zhoukou, Shangqiu, and Zhumadian, are geographically more isolated, with agriculture as the main industry, resulting in lower urbanization levels. The differences in urbanization levels have a multifaceted impact on agricultural carbon emissions. On one hand, in areas with higher urbanization, a large proportion of rural labor moves into the service sector and secondary and tertiary industries, reducing agricultural labor and altering land use patterns. This leads to a decrease in agricultural production activities and associated carbon emissions. On the other hand, urbanization also leads to rural population migration to urban areas, resulting in fewer rural residents and a corresponding decrease in livestock farming, which can reduce agricultural methane and other greenhouse gas emissions. However, urbanization may also cause the mechanization of agricultural production, increasing the consumption of fuel for farming and transportation, which leads to higher carbon emissions. Since this study focuses on the impact of digital economic development on agricultural carbon emissions, it aims to eliminate the influence of urbanization and will treat it as a control variable.
7.1.5. Other control variables
Other control variables include rural residents’ consumption levels, agricultural industrial structure, and agricultural mechanization levels. There are regional imbalances in economic development across cities in Henan Province, leading to differences in rural residents’ consumption levels, agricultural industrial structures, and agricultural mechanization applications, which in turn have varying impacts on agricultural carbon emissions. For instance, cities like Zhengzhou and Luoyang, which are economically developed, have higher levels of rural residents’ consumption, a more diversified agricultural industrial structure, and a decline in the share of traditional agriculture. This results in a lower carbon emission pressure from agricultural production. On the other hand, in the traditional agricultural regions of eastern and southern Henan, such as Zhoukou, Shangqiu, and Zhumadian, where traditional agriculture and livestock farming still dominate, greenhouse gas emissions from production activities are higher. At the same time, the northern and central regions of Henan, such as Xinxiang and Xuchang, have a higher level of agricultural mechanization, improving operational efficiency and reducing emissions per unit of output. In contrast, the western and southern mountainous areas of Henan, where agricultural mechanization is less advanced, have relatively lower production efficiency, which contributes to higher emissions. Therefore, in the empirical analysis, this study will include rural residents’ consumption levels, agricultural industrial structure, and agricultural mechanization levels as control variables to more accurately assess the impact of digital economic development on agricultural carbon emissions.
7.2. Data sources for the empirical analysis
The data selected for this study covers the period from 2011 to 2020 and uses panel data from the prefecture-level cities of Henan Province. Specifically, the data sources for the agricultural carbon emissions indicator come from the Henan Province Statistical Yearbook, the Henan Rural Statistical Yearbook, and the statistical yearbooks of various prefecture-level cities. The data sources for the digital economy indicator come from the Henan Province Statistical Yearbook and Technology Statistical Yearbook, the Henan Province Statistical Yearbook, and the statistical yearbooks of various prefecture-level cities. The data for digital inclusive finance comes from the city-level Digital Inclusive Finance Index published by the Peking University Digital Finance Research Center. The remaining variables are all sourced from the Henan Provincial Statistical Yearbook. In addition, for some missing data, appropriate methods (such as interpolation or direct deletion) have been used to handle these gaps to enhance the credibility of the study.
7.3. Descriptive statistics of variables
Table 9. Descriptive statistical analysis
Variable | Sample Size | Mean | Standard Error | Minimum | Maximum |
Digital Economy | 200 | 2.015 | 1.097 | 0.612 | 7.181 |
Carbon Emissions | 200 | 138.772 | 73.894 | 22.75 | 329.6 |
Carbon Emission Intensity | 200 | 0.362 | 0.134 | 0.103 | 0.781 |
Rural Population (Ten Thousand) | 200 | 570.122 | 271.528 | 123.19 | 1,201.46 |
Urbanization Rate | 200 | 0.578 | 0.15 | 0.213 | 0.935 |
Rural Consumption (Yuan) | 200 | 8,094.955 | 5,355.414 | 1,157 | 30,033.77 |
Agricultural Structure | 200 | 0.114 | 0.065 | 0.029 | 0.502 |
Agricultural Machinery (MW) | 200 | 6,209.546 | 351.805 | 680.98 | 1,522.54 |
Agricultural Technology (Yuan/Person) | 200 | 3,649.78 | 1,618.485 | 1,273.747 | 8,477.678 |
Proportion of Grain | 200 | 0.316 | 0103 | 0.114 | 0.641 |
Henan Province is vast and diverse in terrain, and there are differences in agricultural production methods and carbon emission characteristics between different regions. According to the descriptive statistics, the annual average of agricultural carbon emissions in Henan Province is 1.38772 million tons, which is relatively high. The standard deviation of agricultural carbon emissions across different regions is more than half of the average, indicating significant regional differences in total agricultural carbon emissions. Specifically, the region with the smallest agricultural carbon emissions in Henan Province has only 227,500 tons, while the region with the largest emissions has 3.296 million tons, almost a 20-fold difference. The topography of Henan is primarily composed of the northern plains and the southern hilly areas. The plains mostly have rice cultivation, and there are differences in agricultural production methods and carbon emission structures. In the plains area, small-scale farming dominates, mechanization is relatively high, and emissions are lower. In contrast, the hilly areas have large-scale grain cultivation, with mechanization levels differing from the northern plains, resulting in higher emissions. Overall, the distribution of agricultural carbon emissions in Henan Province is closely related to topography, landforms, and the structure of crop cultivation, with significant regional disparities. The specific results are shown in Table 9.
Descriptive statistical analysis also shows that the average rural population in Henan Province is approximately 5.7 million, which is close to the national proportion of rural population, but the distribution of rural population is still uneven across regions. Specifically, the central and western regions of Henan, such as Luoyang, Nanyang, and Xinyang, have a larger rural population, while the eastern coastal cities have a higher degree of urbanization, resulting in a relatively smaller rural population. The central and western regions are sparsely populated with large land areas, and traditional agriculture dominates, leading to a higher proportion of rural population. In contrast, the developed regions, with a focus on secondary and tertiary industries, have reduced agricultural proportions, leading to significant rural population loss. At the same time, the different paces of urbanization and industrialization in various regions have also led to differences in rural population sizes. This uneven distribution of the rural population will also have different impacts on agricultural production and carbon emissions. Therefore, regional differences need to be considered in the empirical stage.
Similar to the rural population size, there are also significant differences in the level of agricultural technological progress across different regions of Henan Province. The per capita agricultural output value has an average of 3,649 yuan/person. In the most technologically advanced regions, the per capita output value can reach 8,477 yuan, while in the less developed areas, it is only 1,274 yuan, a nearly 6-fold difference. Coastal and suburban areas have high levels of agricultural technology and higher output values, while remote and impoverished areas are limited by topography and have low mechanization levels, resulting in lower per capita output. This agricultural technology gap also leads to differences in agricultural carbon emission efficiency across regions. The results further confirm that regional individual differences must be considered in the empirical stage to fully reveal the impact of digital economy development on carbon emissions. Other variables also show regional differences. For example, the average urbanization rate is about 58%, with a standard deviation of 15%. The maximum value reaches 94%, while the minimum value is only 21%. Rural per capita consumption is about 8,094 yuan, and the average proportion of agricultural output value is about 11.4%, which shows that Henan Province is still a traditional agricultural province. The average proportion of grain crop cultivation is 32%, further confirming this conclusion.
7.4. Construction of econometric model
7.4.1. Two-way fixed effects model
The issue faced in panel regression is the choice between fixed effects and random effects. The academic consensus is that if individual differences are considered to affect the explanatory variables of the model, and such differences are part of the model, a fixed effects model should be chosen. The fixed effects model controls for individual heterogeneity by introducing dummy variables. If individual differences are assumed to be random and unrelated to the explanatory variables, a random effects model should be selected. The random effects model treats individual differences as part of the error term. Moreover, various statistical methods, such as the Hausman test, are available to test the choice between fixed effects and random effects. Nevertheless, most economic studies choose the fixed effects model because the assumption in the random effects model—that the random term is completely unrelated to the independent variables—often fails to hold, thus limiting the explanatory power of the model. Therefore, this paper selects the fixed effects model (seen as equation 14):
\( C{o_{2}}E{m_{ij}}={β_{0}}+{β_{1}}DigitalEco+{β_{i}}*{X_{ij}}+{α_{i}}+{μ_{t}}+{ε_{ij}} \) (14)
In the equation, \( C{o_{2}}E{m_{ij}} \) represents agricultural carbon emissions; \( DigitalEco \) represents the digital economy; \( β \) represents the regression coefficient; \( {X_{ij}} \) represents the control variables for different years and individuals. \( {α_{i}} \) represents individual fixed effects; \( {μ_{t}} \) represents the year fixed effects; \( {ε_{ij}} \) represents the fixed effects.
The two-way fixed effects model for carbon emission intensity is (seen as equation 15):
\( C{o_{2}}Q{d_{ij}}={γ_{0}}+{γ_{1}}DigitalEco+{γ_{i}}*{X_{ij}}+{α_{i}}+{μ_{t}}+{ε_{ij}} \) (15)
In this equation, \( γ \) represents the regression coefficient; \( C{o_{2}}Q{d_{ij}} \) represents agricultural carbon emission intensity; \( DigitalEco \) represents the digital economy; \( {X_{ij}} \) represents the control variables for different years and individuals. \( {α_{i}} \) represents individual fixed effects; \( {μ_{t}} \) represents the year fixed effects; \( {ε_{ij}} \) represents the fixed effects.
7.4.2. Dynamic panel model
The introduction of a dynamic panel model can further investigate the impact of the digital economy on carbon emissions, especially when lag effects are present. Generalized Method of Moments (GMM) is a commonly used parameter estimation method for dynamic models. The core idea is to estimate parameters by using the condition that the sample moments equal the population moments. Compared to traditional estimation methods, the GMM method is more flexible as it does not require strong assumptions about the data, allowing it to handle more complex model structures such as dynamic panel data models and generalized linear models. The basic steps of the GMM method include two aspects: first, determining the appropriate moment conditions, which involves constructing a set of statistics that are unbiased estimates of the population moments and related to the parameters to be estimated. Then, a sample version of the moment conditions is constructed, and these sample moments are used to estimate the model parameters. To improve the robustness of the model and address the issue of endogeneity, GMM is introduced for the dynamic panel model. This is compared with the two-way fixed effects model, and the dynamic panel model is defined as equation (16):
\( C{o_{2}}E{m_{ij}}={β_{0}}+{β_{1}}DigitalEc{o_{it}}+{β_{2}}C{o_{2}}E{m_{ij-1}}+{β_{i}}*{X_{ij}}+{α_{i}}+{μ_{t}}+{ε_{ij}} \) (16)
In the actual model parameter estimation, the variables are first quantized, followed by subsequent calculations.
7.5. Carbon emission reduction mechanism of agricultural digitalization technology
7.5.1. Basic model regression results and analysis
The regression results indicate that, in all models, the variable of the digital economy development index has a significant negative effect on the total agricultural carbon emissions, suggesting that the development of the digital economy in rural areas will have a notable suppressive effect on agricultural carbon emissions. Based on the basic fixed effects model, it is observed that a one-unit increase in the digital economy development index will lead to an approximately 0.01% reduction in agricultural carbon emissions. According to the regression results using the system GMM, a one-unit increase in the digital economy development index will reduce agricultural carbon emissions by up to 0.07%. The development of the digital economy has introduced new technologies such as informationization and intelligence into agriculture, promoting high-efficiency and low-carbon agricultural production, improving agricultural productivity, and simultaneously reducing the intensity of consumption of factors such as labor, fertilizers, pesticides, and energy. This has led to a reduction in carbon emissions across various agricultural production processes, thus achieving the goal of carbon reduction. In summary, the digital economy provides technological support and impetus for green development in agriculture, aiding Henan Province in achieving its strategic goal of agricultural decarbonization and laying the foundation for reaching the “dual carbon” goals.
Table 10. Empirical results of the benchmark regression model
Fixed Effects Model | Difference GMM Carbon Emissions | Difference GMM Carbon Emissions | Difference GMM Carbon Emissions | System GMM Carbon Emissions | |
Carbon Emission Intensity (1st Lag) | 1.856*** (0.323) | 1.923*** (0.411) | 2.652** (0.903) | 2.232*** (0.551) | |
Digital Economy | -0.006*** (0.002) | -0.006*** (0.002) | -0.21* (0.011) | -0.029** (0.013) | -0.07*** (0.003) |
Rural Population Size | -0.202*** (0.07) | -0.201*** (0.07) | -0.167 (0.244) | -0.077 (0.281) | |
Agricultural Machinery | 0.07 (0.055) | 0.076 (0.054) | 0.449** (0.228) | 0.661*** (0.221) | |
Farmer Consumption Level | 0.123*** (0.034) | 0.116*** (0.033) | 0.097 (0.106) | 0.125 (0.197) | |
Agricultural Industrial Structure | 0.575 (0.892) | 7.851* (4.107) | 6.922 (4.536) | ||
Urbanization Rate | -0.338*** (0.088) | -0.34*** (0.088) | 0.105 (0.471) | ||
_cons | 32.25*** (0.952) | 32.257*** (0.951) | 24.696*** (3.268) | 20.442*** (3.262) | 31.899*** (0.013) |
Individual Control | Yes | Yes | No | No | Yes |
Time Control | Yes | Yes | No | No | Yes |
AR1p | 0.003 | 0.001 | 0 | 0.002 | |
AR2p | 0.736 | 0.855 | 0.813 | 0.879 | |
P-Sargan | 0.201 | 0.112 | 0.306 | 0.281 | |
Sample Size | 200 | 200 | 200 | 200 | 200 |
Note: *** p<0.01 ** p<0.05 *p<0.1
By testing through the transformation of control variables, it can be observed that the negative impact of the digital economy on agricultural carbon emissions remains significant, and the parameter estimates are highly stable, with no noticeable fluctuation in coefficient values. In each econometric model, the effect of the digital economy on agricultural carbon emissions fluctuates between 0.006% and 0.07%. Even when considering the influence of different control variables, the carbon reduction effect of the digital economy remains highly significant. The regression coefficients of the inhibiting effect of the digital economy on agricultural carbon emissions show minimal changes, indicating that its carbon reduction effect is robust and reliable, thus providing solid empirical analysis for decision-makers in formulating digital emission reduction strategies. Regardless of the scenario, policies such as “promoting the implementation of digital technologies, applying advanced digital technologies, and developing efficient smart agriculture” can significantly reduce agricultural carbon emissions, thereby providing policy leverage for the Henan Provincial Government to achieve its “dual-carbon” goals.
7.5.2. Robustness test
In empirical analysis paradigms, the output of the baseline model may produce unstable results due to omitted variables or unbalanced sample selection. To further enhance the validity of the model’s conclusions, conducting a robustness test is necessary. This study adopts the following three strategies to improve the stability of the empirical model: Firstly, replacing the dependent variable. Given the numerous methods to measure agricultural production carbon emissions, this study uses different measurement indicators for robustness testing, such as replacing agricultural production carbon emissions with agricultural production carbon emission intensity. Secondly, replacing the model estimation method. The original two-way fixed effects model is replaced with a GMM model, introducing instrumental variables to address endogeneity and specification bias. Thirdly, replacing specific sample values. Due to significant differences in the level of digital economy development between the eastern and central-western regions, this study excludes samples from the eastern region, which has a relatively strong digital infrastructure and long development depth, focusing instead on analyzing the carbon reduction effect of the digital economy in economically underdeveloped regions. If significant carbon reduction effects of the digital economy can still be observed in economically underdeveloped regions, the credibility of the initial model’s conclusions can be further validated. The specific results are shown in Table 11.
Table 11. Robustness test regression results
Fixed Effects Carbon Emission Intensity | Fixed Effects Carbon Emission Intensity | Difference GMM Carbon Emission Intensity | Carbon Emission Intensity Considering Sample Bias | |
Carbon Emission Intensity (1st Lag) | 1.785*** (0.342) | 1.864*** (0.447) | ||
Digital Economy | -0.009** (0.004) | -0.012*** (0.004) | -0.053*** (0.019) | -0.006** (0.003) |
Rural Population Size | -0.329** (0.166) | -0.255 (0.191) | -1.315*** (0.368) | -0.055 (0.111) |
Agricultural Machinery | -0.175 (0.127) | 0.17 (0.128) | 0.568** (0.272) | 0.041 (0.1) |
Farmer Consumption Level | 0.222*** (0.067) | 0.189** (0.08) | 0.142 (0.144) | 0.147*** (0.051) |
Agricultural Industrial Structure | -7.286*** (1.795) | -3.865** (1.836) | 7.834 (7.632) | 1.339 (1.574) |
Urbanization Rate | 0.039 (0.173) | -0.28 (0.196) | -1.439*** (0.512) | 0.621** (0.266) |
Individual Control | Yes | No | Yes | No |
Time Control | Yes | Yes | Yes | Yes |
_cons | 21.988*** (2.385) | 16.354*** (2.461) | 18.343*** (5.601) | 30.696*** (1.99) |
AR1p | 0.02 | 0.04 | ||
AR2p | 0.741 | 0.844 | ||
P-Sargan | 0.163 | 0.203 | ||
Sample Size | 200 | 200 | 200 | 150 |
Note: *** p<0.01, ** p<0.05, * p<0.1
In the case where the dependent variable is agricultural carbon emission intensity, as shown in Table 11, the effect of the digital economy on agricultural carbon emission reduction presents different outcomes across various models. Firstly, the fixed effects model shows that there is a negative correlation between the digital economy and agricultural carbon emission reduction intensity, which is statistically significant. This indicates that the development of the digital economy can significantly reduce agricultural carbon emission intensity, with the impact being 0.009% and 0.012%, respectively. In the difference GMM model, the emission reduction effect of the digital economy on agricultural carbon emissions is even more significant. A one-unit increase in the digital economy results in a 0.053% reduction in agricultural carbon emissions, indicating that the development of the digital economy has a more pronounced impact on reducing agricultural carbon emissions. After considering sample bias, the effect of the digital economy on agricultural carbon emission reduction changes to 0.006%, which is still significant at the 5% level. Even in economically underdeveloped areas with relatively low levels of economic development, the carbon emission reduction effect of the digital economy on agriculture remains significant.
At the same time, when controlling for other variables, the use of agricultural machinery shows a significant positive effect on agricultural carbon emissions in the difference GMM model, possibly related to the excessive use of agricultural machinery. Furthermore, the farmer consumption level shows a significant positive effect on agricultural carbon emissions in all models, suggesting that an increase in farmer consumption levels may lead to higher agricultural carbon emissions. The effects of agricultural industrial structure and urbanization rate on agricultural carbon emissions show different outcomes across the models, possibly influenced by other factors.
Based on the above robustness tests, this study finds that there is no systematic bias in the effect of the digital economy on agricultural carbon emission reduction compared to the baseline model, which proves the robustness of the baseline model results. It also further demonstrates the significant agricultural carbon emission reduction effect brought about by the development of the digital economy in Henan Province.
7.6. Carbon emission reduction effects of agricultural digitalization technology: a perspective on spatial spillover effects
7.6.1. Moran’s I index measurement method and results
As mentioned in the previous analysis, the introduction of agricultural digitalization technology will support the development of the digital economy in rural areas. The digital economy, represented by data elements, has a significant spatial spillover effect. Therefore, it can be concluded that the carbon emission reduction effect of agricultural digitalization technology also exhibits a spatial spillover effect. Specifically, when a certain prefecture-level city in Henan Province has a higher degree of agricultural digitalization, it will not only promote agricultural carbon emission reduction within the region but also positively impact the agricultural carbon emission reduction of neighboring areas. First, this paper will test whether the spatial autocorrelation of carbon emissions is valid by introducing Moran’s I index. The specific calculation formula for this index is as equation (17):
\( Moran \prime s=\frac{\sum _{a=1}^{n}\sum _{b=1}^{n}{W_{ab}}({X_{a}}-\overline{X})({X_{b}}-\overline{X})}{{S^{2}}\sum _{a=1}^{n}\sum _{b=1}^{n}{W_{ab}}} \) (17)
Where \( {W_{ab}} \) is the spatial distance weight between regions a and b, \( {X_{a}} \) and \( {X_{b}} \) are the values of variable X in prefecture-level cities a and b in Henan Province, \( \overline{X} \) is the sample mean of variable X across the n spatial units, and \( {S^{2}} \) is the sample variance. When Moran’s I index is positive, it indicates a positive spatial correlation between variables; when Moran’s I index is negative, it indicates a negative spatial correlation between variables. The test results are shown in Table 10, and the results indicate that the Moran’s I index for carbon emissions in Henan’s prefecture-level cities from 2011 to 2020 is positive at the 10% significance level, indicating a strong positive spatial correlation of the carbon emission reduction effects of the digital economy at the prefecture level in Henan Province. The specific results are shown in Table 12.
Table 12. Autocorrelation test results for digital economy and agricultural carbon emissions
Year | E | Digital | ||
Moran’s I | P-value | Moran’s I | P-value | |
2011 | 0.155 | 0.074 | 0.222 | 0.023 |
2012 | 0.159 | 0.055 | 0.218 | 0.012 |
2013 | 0.193 | 0.024 | 0.267 | 0.004 |
2014 | 0.237 | 0.008 | 0.283 | 0.002 |
2015 | 0.251 | 0.010 | 0.251 | 0.005 |
2016 | 0.218 | 0.025 | 0.215 | 0.018 |
2017 | 0.222 | 0.023 | 0.189 | 0.029 |
2018 | 0.267 | 0.007 | 0.184 | 0.032 |
2019 | 0.283 | 0.004 | 0.182 | 0.031 |
2020 | 0.251 | 0.010 | 0.182 | 0.031 |
7.6.2. Selection and construction of spatial models
7.6.2.1. Hausman test
The Hausman test is used to determine whether to use a fixed effects model or a random effects model. The test results are shown in Table 13. The test statistic for the core variable of the digital economy development index is 45.32, and the p-value is less than 0.01, leading to the rejection of the null hypothesis at the 1% significance level. Thus, the fixed effects model should be selected, which corresponds to the double fixed effects model used in the previous section.
Table 13. Hausman test for robustness of spatial econometric models
Explanatory Variable | Sargan-Hansen statistic | P-value |
DigitalEco | 17.63 | 0.006 |
7.6.2.2. Test for variable coefficients and intercepts
First, test whether the intercepts and slopes of the SDM model have changed. The null hypothesis is a varying intercept spatial Durbin model, and the alternative hypothesis is a spatial Durbin model with varying intercepts and at least one variable slope coefficient varying across individuals. The test results show that the LR test statistic is smaller than the critical value for the chi-square test at the 5% significance level, so the null hypothesis can be accepted, indicating that only the intercept has changed. Next, a test is conducted to determine whether the intercept has changed. The null hypothesis assumes a pooled model, while the alternative hypothesis suggests a change in the model intercept. The LR test statistic exceeds the critical value for the chi-square test at the 5% significance level, resulting in the rejection of the null hypothesis and the acceptance of the alternative hypothesis. This indicates that the intercept has changed.
Table 14. Test for variable coefficients and intercepts in spatial econometric models
LR Statistic | Critical Value for Chi-Square Test at 5% Significance Level | |
SDM Model | 381.286 | 655.998 |
Pooled Model | 1,496.091 | 340.328 |
7.6.2.3. Wald test and LR test
The Wald test is used to examine whether the SDM model can degenerate into the SAR or SEM models. The test results are shown in Table 15. The results indicate that both the Wald and LR tests reject the null hypothesis at the 1% significance level, implying that the SDM model does not degenerate into either the SAR or SEM models. Therefore, the SDM model is chosen as the optimal model. The specific results are shown in Table 14.
Table 15. Wald test and LR test for spatial econometric models
Explanatory Variable | SAR W-Chi2 | SEM W-Chi2 | SAR LR-Chi2 | SEM LR-Chi2 |
DigitalEco | 68.33*** | 32.56*** | 27.41*** | 27.17*** |
7.6.2.4. Construction of the spatial durbin model
Based on the spatial correlation of carbon emissions between regions, this study constructs a Spatial Durbin Model (SDM) to examine the impact of digital economy development on carbon reduction in Henan Province. The specific calculation method is as equation (18-21):
\( {W_{ij}}=\frac{1}{{d_{ij}}} \) (18)
\( {A_{ij}}=\begin{cases} \begin{array}{c} \frac{1}{|GD{P_{i}}-GD{P_{j}}|},i≠j \\ 0,i=j \end{array} \end{cases} \) (19)
\( W={W_{ij}}×{A_{ij}} \) (20)
\( C{o_{2}}E{m_{it}}={α_{0}}+ρWC{o_{2}}E{m_{it}}+{α_{1}}DigitalEc{o_{it}}+{α_{2}}WDigitalEc{o_{it}}+{β_{1}}{X_{it}}+{β_{2}}W{X_{it}}{α_{i}}+{μ_{i}}+{v_{t}}+{ε_{it}} \) (21)
Where \( {W_{ij}} \) is the geographical spatial weight matrix, \( {d_{ij}} \) represents the spatial distance between two cities in Henan Province, and \( \overline{GD{P_{i}}} \) is the per capita regional GDP index for city 𝑖 in 2020. W is the economic distance geographical weight matrix, \( ρ \) represents the spatial autoregressive coefficient, X represents all explanatory variables in the model, \( {μ_{i}} \) and \( {v_{t}} \) are spatial autocorrelation coefficients, and \( {ε_{it}} \) is the random disturbance term. The specific results are shown in Table 15.
7.6.2.5. Estimation results and analysis of the spatial Durbin model
Based on the panel data of various cities in Henan Province from 2011 to 2022, the Spatial Durbin Model is computed and analyzed. In choosing between time-fixed, spatial-fixed, or spatiotemporal-fixed effects for the Spatial Durbin Model, a comparison of the results, taking into account the goodness-of-fit and log-likelihood function values, shows that the spatial-fixed effect is higher. Therefore, this study selects the Spatial Durbin Model under dual fixed effects. The empirical results are presented in Table 16.
Table 16. Estimation results of the spatial Durbin model
Main | Wx | ||
DigitalEco | -0.488*** (0.110) | W*DigitalEco | -0.731*** (0.220) |
RuralPop | 0.166* (0.094) | W*RuralPop | -0.394** (0.173) |
UrbRate | 1.592*** (0.188) | W*UrbRate | -1.239** (0.482) |
RuralCom | 0.056*** (0.012) | W*RuralCom | -0.012** (0.025) |
AgrStructure | 0.049*** (0.018) | W*AgrStructure | 0.040* (0.042) |
AgrTech | 0.808*** (0.117) | W*AgrTech | 0.374 (0.257) |
AgrMachinery | 0.472*** (0.153) | W*AgrMachinery | 0.437** (0.168) |
From Table 16, it can be observed that the introduction of rural digital technologies will enhance the level of development of the digital economy. The regression coefficient of the digital economy development index is -0.488, and it is significantly negative at the 1% significance level, indicating that the digital economy has a significant effect on agricultural carbon reduction. The coefficient of the spatial lag term W*DigitalEcois also significantly negative, with a value of -0.731. This indicates that the development of the digital economy in the local area not only reduces local agricultural carbon emissions but also has a significant carbon reduction effect on neighboring regions.
8. Policy recommendations
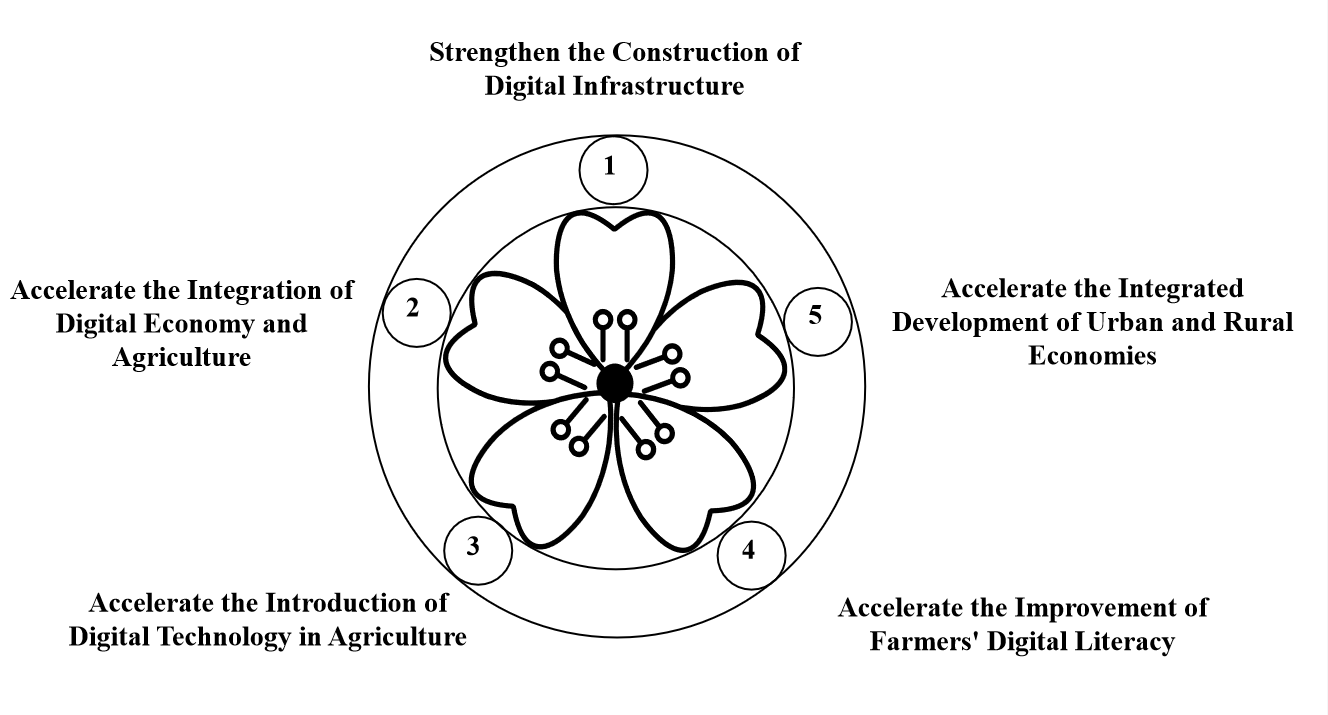
Figure 14. Framework of policy recommendations
8.1. Strengthen the construction of digital infrastructure
As shown in Figure 14, this study shows that the introduction of agricultural digital technologies helps reduce carbon emissions and carbon intensity in agriculture. The foundational prerequisite for introducing such technologies is the enhancement of digital infrastructure in rural areas, including 5G communication facilities, integrated power grid infrastructure, and internet service facilities. This will improve the ability to access information in rural areas, ensure the energy demands of these regions, and provide the foundation for the development of the digital economy in rural areas, thus facilitating the green and low-carbon transformation of agriculture. Therefore, financial investment should be increased to support the construction of digital infrastructure such as internet and agricultural IoT networks in Henan Province, improve network coverage and online lending, and support rural areas in building a comprehensive wireless network that enables farmers to easily access digital agricultural information services [6].
8.2. Accelerate the integration of the digital economy and agriculture
Based on the panel data from various cities in Henan Province, this study shows that agricultural digital technologies have a significant carbon reduction effect and have passed robustness tests, proving that the carbon reduction effect of these technologies is stable. Therefore, the integration of the digital economy and agriculture should be accelerated, and agricultural digital technologies should be incorporated into farmers’ daily agricultural activities. This will stimulate the potential of data elements, develop new rural productive forces, and improve agricultural production efficiency from the factor side, thereby achieving the green and low-carbon development of agriculture [7].
8.3. Promote agricultural digital technologies according to local conditions
The introduction of agricultural digital technologies should take into account the characteristics of agricultural development and unique resource endowments in different regions of Henan Province. For the central plains, which are vast and have a higher degree of mechanization, large-scale digital agricultural equipment such as agricultural machine navigation, irrigation/fertilizer robots, and agricultural monitoring drones should be promoted to achieve precision sowing, fertilizing, spraying, and other refined operations. This will reduce the use of fertilizers and pesticides, thereby lowering greenhouse gas emissions. Meanwhile, the deployment of IoT systems should be considered for remote network monitoring of crop growth environments to help increase crop yields and reduce carbon emissions. For regions such as the Dabie Mountains and Funiu Mountains, which are mountainous and less mechanized, the focus should be on developing digital facility agriculture and e-commerce for agricultural products. On one hand, this can achieve lightweight and soil-free cultivation, reducing fertilizer usage. On the other hand, it can open up internet sales channels, reduce energy consumption in transportation, and decrease carbon emissions [8].
8.4. Accelerate the improvement of farmers’ digital literacy
A key to introducing agricultural digital technologies and developing the digital economy in rural areas lies in having business entities with digital literacy, as this is crucial to the actual effectiveness of carbon reduction. Therefore, digital agriculture technology training should be conducted to help farmers master the skills to use tools such as agricultural big data analysis, agricultural IoT, and agricultural robots. This will assist farmers in planning their planting strategies, increasing crop yields, and lowering production costs. To accelerate the improvement of farmers’ digital literacy, the government should focus on three aspects: First, increase investment in agricultural digital education and enrich the digital agriculture training resources in rural areas to improve farmers’ access to agricultural digital technologies and related training resources. Second, integrate social resources and leverage the strengths of higher education institutions and research units in agricultural technology training to provide high-quality training services. Third, establish a government-led system for promoting digital agriculture technology, highlighting the government’s guiding role in training and promotion [9].
8.5. Accelerate the integration of urban and rural economic development
This study shows that agricultural digital technologies have a significant spatial spillover effect in terms of carbon reduction. The development of the digital economy in one region not only promotes agricultural carbon reduction in that region but also positively influences agricultural carbon reduction in neighboring regions. Therefore, the integration of urban and rural economic development should be accelerated, creating two-way channels for the flow of factor resources between urban and rural areas. This will promote the rapid spread of agricultural digital technologies from urban to rural areas, driving the development of the digital economy in rural areas. On the other hand, it will promote the transformation of carbon reduction effects in rural areas into social welfare, contributing to the green development of surrounding rural areas, improving the rural environment, and providing more green and low-carbon products for urban areas. This will meet urban consumers’ demand for green agricultural products and realize the sustainable cycle of agricultural green and low-carbon development and urban-rural integration.
References
[1]. Tian, Y., & Liao, H. (2024). Research on the impact and mechanism of digital economy on agricultural carbon emissions. Reform, (09), 84-99.
[2]. Lu, J., & Guo, J. (2024). Carbon reduction effect of enabling agricultural green development through digital economy. Journal of Jiangxi University of Finance and Economics, (03), 78-90.
[3]. Tang, C. (2024). Research on the impact of digital economy development on agricultural carbon emissions (Master’s thesis). Zhengzhou University of Aeronautics and Astronautics.
[4]. Han, H., & Gong, Y. (2025). Spatial spillover effect of digital rural construction on agricultural carbon emissions. Journal of Agricultural Engineering, 1-10. [Published online on February 5, 2025].
[5]. Guan, H., & Lei, J. L. (2022). Data elements empowering agricultural modernization: Mechanism, challenges, and countermeasures. China Business and Market, 36(6), 72–84. https://doi.org/10.14089/j.cnki.cn11-3664/f.2022.06.008
[6]. Huang, X. H., & Nie, F. Y. (2023). Research on the mechanism of digitalization driving farmers' green and low-carbon agricultural transformation. Journal of Northwest A&F University (Social Science Edition), 23(1), 30–37. https://doi.org/10.13968/j.cnki.1009-9107.2023.01.04
[7]. Li, W. R., & Zhou, S. J. (2023). The transformation of China's agricultural production methods under the digital economy: Mechanism, contradictions, and solutions. Journal of Xi'an Jiaotong University (Social Sciences), 43(1), 65–73.
[8]. Liu, J. L., & Chen, Y. Y. (2024). Digital technology development, spatiotemporal dynamic effects, and regional carbon emissions. Studies in Science of Science, 41(5), 841–853.
[9]. Mo, J. M., & Zhang, S. M. (2021). Behavioral logic of urban participation driving small farmers' green production transformation: Empirical investigation based on Jian Ta Village, Pujiang, Chengdu. Issues in Agricultural Economy, 11, 77–88. https://doi.org/10.13246/j.cnki.iae.20210916.001
[10]. Su, P. T., & Wang, L. (2023). Spatial effect of digital inclusive finance on agricultural carbon emission intensity and mechanism. Resources Science, 45(3), 593–608. https://doi.org/10.18402/resci.2023.03.10
[11]. Cheng, Q., Xu, A., & Chen, Q. (2022). Path to achieving agricultural carbon reduction under the “dual carbon” target: Verification based on digital inclusive finance. Journal of Southwest University for Nationalities (Humanities and Social Sciences Edition), 43(02), 115-126.
[12]. Liu, Z., Zhang, X., & Wei, W. (2023). The impact of rural digital economy development on agricultural carbon emissions: Panel data analysis of 29 provinces. Journal of Jiangsu University (Social Sciences Edition), 25(03), 20-32+47.
[13]. Wen, T., Sun, P., & Zhang, L. (2024). Dynamic evolution and regional patterns of China’s agricultural carbon emissions. Economic Geography, 44(10), 165-175.
[14]. Li, J. (2024). Path research on enabling green and low-carbon development through digital economy under the “dual carbon” background. Business and Exhibition Economics, (10), 66-69.
[15]. Su, L., Zhang, H., & Peng, Y. (2021). Mechanism research on farmers’ digital literacy driving digital rural development. E-Government, (10), 42-56.
Cite this article
Guo,H.;Liang,C.;Han,C.;Yang,S. (2025). Carbon emission reduction effects of agricultural digitalization technology: an empirical analysis based on panel data from municipalities in Henan Province. Journal of Applied Economics and Policy Studies,18(1),11-39.
Data availability
The datasets used and/or analyzed during the current study will be available from the authors upon reasonable request.
Disclaimer/Publisher's Note
The statements, opinions and data contained in all publications are solely those of the individual author(s) and contributor(s) and not of EWA Publishing and/or the editor(s). EWA Publishing and/or the editor(s) disclaim responsibility for any injury to people or property resulting from any ideas, methods, instructions or products referred to in the content.
About volume
Journal:Journal of Applied Economics and Policy Studies
© 2024 by the author(s). Licensee EWA Publishing, Oxford, UK. This article is an open access article distributed under the terms and
conditions of the Creative Commons Attribution (CC BY) license. Authors who
publish this series agree to the following terms:
1. Authors retain copyright and grant the series right of first publication with the work simultaneously licensed under a Creative Commons
Attribution License that allows others to share the work with an acknowledgment of the work's authorship and initial publication in this
series.
2. Authors are able to enter into separate, additional contractual arrangements for the non-exclusive distribution of the series's published
version of the work (e.g., post it to an institutional repository or publish it in a book), with an acknowledgment of its initial
publication in this series.
3. Authors are permitted and encouraged to post their work online (e.g., in institutional repositories or on their website) prior to and
during the submission process, as it can lead to productive exchanges, as well as earlier and greater citation of published work (See
Open access policy for details).
References
[1]. Tian, Y., & Liao, H. (2024). Research on the impact and mechanism of digital economy on agricultural carbon emissions. Reform, (09), 84-99.
[2]. Lu, J., & Guo, J. (2024). Carbon reduction effect of enabling agricultural green development through digital economy. Journal of Jiangxi University of Finance and Economics, (03), 78-90.
[3]. Tang, C. (2024). Research on the impact of digital economy development on agricultural carbon emissions (Master’s thesis). Zhengzhou University of Aeronautics and Astronautics.
[4]. Han, H., & Gong, Y. (2025). Spatial spillover effect of digital rural construction on agricultural carbon emissions. Journal of Agricultural Engineering, 1-10. [Published online on February 5, 2025].
[5]. Guan, H., & Lei, J. L. (2022). Data elements empowering agricultural modernization: Mechanism, challenges, and countermeasures. China Business and Market, 36(6), 72–84. https://doi.org/10.14089/j.cnki.cn11-3664/f.2022.06.008
[6]. Huang, X. H., & Nie, F. Y. (2023). Research on the mechanism of digitalization driving farmers' green and low-carbon agricultural transformation. Journal of Northwest A&F University (Social Science Edition), 23(1), 30–37. https://doi.org/10.13968/j.cnki.1009-9107.2023.01.04
[7]. Li, W. R., & Zhou, S. J. (2023). The transformation of China's agricultural production methods under the digital economy: Mechanism, contradictions, and solutions. Journal of Xi'an Jiaotong University (Social Sciences), 43(1), 65–73.
[8]. Liu, J. L., & Chen, Y. Y. (2024). Digital technology development, spatiotemporal dynamic effects, and regional carbon emissions. Studies in Science of Science, 41(5), 841–853.
[9]. Mo, J. M., & Zhang, S. M. (2021). Behavioral logic of urban participation driving small farmers' green production transformation: Empirical investigation based on Jian Ta Village, Pujiang, Chengdu. Issues in Agricultural Economy, 11, 77–88. https://doi.org/10.13246/j.cnki.iae.20210916.001
[10]. Su, P. T., & Wang, L. (2023). Spatial effect of digital inclusive finance on agricultural carbon emission intensity and mechanism. Resources Science, 45(3), 593–608. https://doi.org/10.18402/resci.2023.03.10
[11]. Cheng, Q., Xu, A., & Chen, Q. (2022). Path to achieving agricultural carbon reduction under the “dual carbon” target: Verification based on digital inclusive finance. Journal of Southwest University for Nationalities (Humanities and Social Sciences Edition), 43(02), 115-126.
[12]. Liu, Z., Zhang, X., & Wei, W. (2023). The impact of rural digital economy development on agricultural carbon emissions: Panel data analysis of 29 provinces. Journal of Jiangsu University (Social Sciences Edition), 25(03), 20-32+47.
[13]. Wen, T., Sun, P., & Zhang, L. (2024). Dynamic evolution and regional patterns of China’s agricultural carbon emissions. Economic Geography, 44(10), 165-175.
[14]. Li, J. (2024). Path research on enabling green and low-carbon development through digital economy under the “dual carbon” background. Business and Exhibition Economics, (10), 66-69.
[15]. Su, L., Zhang, H., & Peng, Y. (2021). Mechanism research on farmers’ digital literacy driving digital rural development. E-Government, (10), 42-56.