


1. Introduction
In recent years, governments in multiple regions, including Henan, Hunan, Heilongjiang, and Sichuan provinces, have made new strategic deployments for the "Culture and Tourism + Finance" integration development model. This integration has become a trend in the upgrading of cultural and tourism demand and financial development. As an important initiative in the "Opinions on Promoting the High-Quality Development of the Online Tourism Market" issued by the Ministry of Culture and Tourism, the integration of tourism and finance relies on digital technology to achieve deep mutual integration, fostering complementary effects between industries. The Chengdu-Chongqing Twin-City Economic Circle, as a strategically important urban cluster in China’s economic growth, has leveraged its tourism resources and strong financial potential, presenting a trend of "sustainability, diversification, and differentiation" in tourism-finance integration development. However, challenges remain, including regional development imbalances, mismatched financial services, and unclear advantages of cross-regional industrial integration.
A review of relevant academic studies reveals that the development of the financial industry indeed supports the prosperity of tourism. Mazilu conducted in-depth research on the sustainable development of tourism and emphasized that long-term profitability in finance can stabilize and promote the tourism industry. Zhang et al. used GeoDetector to examine influencing factors and found that financial factors have a significant impact on China's tourism PPP projects. Other researchers have further shown that the relationship between finance and tourism is not a simple one-way interaction, but a mutually beneficial and interactive relationship. Zhang confirmed that a sound financial system can bring more investment and rational allocation of tourism resources for the development of tourism. Shi proposed through a coupling coordination model that financial and tourism development can promote each other under different coupling conditions. To accurately measure the specific performance of tourism-finance integration development, it is essential to assess tourism financial efficiency. Existing literature on tourism financial efficiency can be divided into two main schools of thought: "micro" and "macro" approaches. The former examines the financial efficiency of micro tourism entities, such as hotels and travel agencies, while the latter employs macro-level methods, using the DEA framework with inputs like capital and labor to explore the spatial distribution and dynamic evolution of regional tourism efficiency. Tourism financial efficiency evaluates the efficiency of tourism with various types of financial support as input elements. In current academic research, most studies focus on micro-level surveys, such as evaluating the financial efficiency of individual tourism entities or publicly listed tourism companies [1]. Few studies have explored the measurement of tourism financial efficiency at the macro level. Mu measured the tourism financial efficiency of the Yangtze River Economic Belt and Yunnan Province, finding that the main factors influencing the spatiotemporal distribution of tourism financial efficiency include regional tourism resources, financial infrastructure, and management levels [2]. He recommended that spatial correlation should be emphasized in regional tourism financial efficiency analysis. Jaisinghani used the DEA model to construct financial efficiency indicators to measure the sustainability and driving factors of tourism financial efficiency in India [3]. Li [4] developed a Tobit model to reflect the driving factors of tourism financial efficiency and used the DEA method to measure the tourism financial efficiency of six central provinces, revealing that tourism resources, regional economic development, transportation accessibility, and credit scale all have significant positive effects on the tourism financial index.
Based on a review of relevant research, this paper selects the Chengdu-Chongqing Twin-City Economic Circle, an area rich in tourism financial resources with rapid development, as the research region. Using the DEA-Malmquist index model, the paper measures and analyzes the financial input factors in various districts and counties of the Chengdu-Chongqing Twin-City Economic Circle to evaluate their support efficiency for the local tourism industry. The study explores the spatiotemporal distribution pattern of tourism financial development, clarifies the imbalances in tourism finance development within the region, and identifies key influencing factors using the GeoDetector tool for factor detection and interaction analysis.
2. Model Design and Variable Selection
2.1. Model Design
First, based on the analysis in the previous section, this paper constructs a DEA-Malmquist model to explore the development characteristics and basic situation of tourism financial efficiency in the Chengdu-Chongqing Twin-City Economic Circle. The Malmquist index method is a technique that measures productivity changes based on Shephard's distance function, using input-output data from two different time points to calculate the distance between production functions. The Malmquist index can be decomposed into two components: the technical efficiency changes index (EFFCH) and the technical progress change index (TECH), which reflect improvements in technical efficiency and advancements in technological levels, respectively. This method is widely used to measure industrial efficiency at various macro levels. The model is formulated as equation (1):
\( M_{t}^{G}={EFFCH_{t}}∙TECHCH_{t}^{G}=\frac{{D_{t+1}}({x_{t+1}},{y_{t+1}})}{{D_{t}}({x_{t}},{y_{t}})}∙\sqrt[]{\frac{{D_{t}}({x_{t}},{y_{t}})}{{D_{t+1}}({x_{t}},{y_{t}})}∙\frac{{D_{t}}({x_{t+1}},{y_{t+1}})}{{D_{t+1}}({x_{t+1}},{y_{t+1}})}} \) (1)
Second, after measuring the tourism financial development efficiency in the Chengdu-Chongqing Twin-City Economic Circle, this paper will use the GeoDetector method to analyze and test the influencing factors of tourism financial efficiency in the region. A significant advantage of GeoDetector is its ability to detect interactions between two influencing factors and evaluate and compare their individual effects as well as their combined effects. This helps determine the existence, intensity, direction, and linearity of interactions. GeoDetector can detect relationships as long as they exist. The GeoDetector analysis method includes four powerful functions, with this paper focusing on two specific functions: spatial differentiation and factor detection. The formula is as equation (2-4):
\( q=1-\frac{\sum _{h=1}^{L}{N_{h}}σ_{h}^{2}}{N{σ^{2}}}=1-\frac{SSW}{SST} \) (2)
\( SSW=\sum _{h=1}^{L}{N_{h}}σ_{h}^{2} \) (3)
\( SST=N{σ^{2}} \) (4)
Where: h=1, …, L represents the strata (or layers) of variable Y or factor X, corresponding to classification or zoning schemes. Nh and N represent the number of units in stratum h and the entire region, respectively. σh2 and σ2 represent the variances of variable Y in stratum h and the entire region.SSW and SST represent the sum of squares within strata and the total sum of squares, respectively. The q-value ranges from 0 to 1. A higher q-value indicates more noticeable spatial variation in Y. In cases where X generates the stratification, a larger q-value indicates stronger explanatory power of X on the spatial distribution of Y, and vice versa. In extreme cases, a q-value of 1 means factor X fully explains the spatial distribution of Y, while a q-value of 0 means no relationship exists between X and Y. The q-value represents the proportion of Y explained by X (100×q%).
2.2. Variable selection
First, the selection of indicators for measuring tourism financial efficiency in the Chengdu-Chongqing Twin-City Economic Circle. In tourism-related literature, the DEA-Malmquist method has been widely used to measure the tourism efficiency of cities, provinces, or regions. This paper examines the interactive and coordinated relationship between tourism and finance from a financial perspective. Therefore, financial-related variables are included in the DEA-Malmquist framework for variable selection. The output variables are tourism income from visitors (in million yuan) and the number of tourists (in ten thousand people). All data are sourced from the China City Statistical Yearbook, including the statistical yearbooks of Chengdu, Chongqing, and the district and county-level data of these areas. The specific measurement indicators are shown in Table 1.
Table 1. DEA-Malmquist indicator system construction
Variable Category | Variable Name | Indicator Quantification | Variable Symbol |
Input Variables | Savings Level | Urban and rural residents' savings balance (ten thousand yuan) | DB |
Loan Level | Year-end loan balance of financial institutions (ten thousand yuan) | LB | |
Policy-based Finance Local Fiscal Expenditure | Total social fixed asset investment (ten thousand yuan) | IF | |
Local fiscal general budget expenditure (ten thousand yuan) | BE | ||
Output Variables | Tourism Scale | Number of tourists received (ten thousand people) | TS |
Tourism Income | Tourism income from visitors (ten thousand yuan) | TR |
Second, the indicator system in the GeoDetector method (Seen as Table 2). To explore and determine the factors influencing tourism financial efficiency in the Chengdu-Chongqing Twin-City Economic Circle, this paper refers to previous literature and, based on data availability, selects the following influencing factors: economic development (ED), industrial structure (IS), population factors (POP), consumption demand (CD), and degree of openness (OO).
Table 2. GeoDetector indicator system
Variable Category | Variable Name | Indicator Quantification | Variable Symbol |
Dependent Variable | Tourism Financial Efficiency | Results from DEA-Malmquist | M |
Independent Variables | Economic Development | Logarithm of per capita GDP | ED |
Industrial Structure | Percentage of tertiary industry output in GDP | IS | |
Population Size | Total population of the area | POP | |
Consumption Demand | Total retail sales of consumer goods per capita | CD | |
Degree of Openness | Trade volume (exports + imports) / regional GDP | OO |
2.3. Data selection
This study primarily relies on government public data. Specifically, the data sources include macroeconomic data from the National Bureau of Statistics and regional economic data from provincial, district, and county statistical bureaus. Government data will be collected on a wide range of topics, including tourism income, tourist numbers, year-end total loans from financial institutions, GDP, and other macroeconomic indicators within the Chengdu-Chongqing Twin-City Economic Circle. Panel data for 36 decision-making units (DMUs) and 9 years (2011-2019) will be collected to calculate tourism financial efficiency indicators and explore the dynamic evolution and influencing factors of tourism financial efficiency.
3. Empirical analysis
3.1. Measurement of tourism financial efficiency in the Chengdu-Chongqing Twin-City Economic Circle based on the DEA-Malmquist model
The tourism financial efficiency calculated using the DEA-Malmquist index is a productivity change indicator, reflecting the random and complex distribution state of tourism financial efficiency. This is due to its sensitivity and volatility to unforeseen events, which tend to evolve over time. To obtain panel data that captures annual changes and satisfies the requirements of regression analysis, the tourism financial efficiency for 2011 is set to 1. The resulting productivity change indicators are then multiplied cumulatively, yielding panel data for tourism financial efficiency from 2011 to 2019 for the 36 decision-making units (DMUs) in the Chengdu-Chongqing Twin-City Economic Circle. Table 3 presents the descriptive statistics for the four tourism productivity indicators. The meanings of the variables have been explained in previous sections. As shown in the table, the average value ofM is approximately 10, indicating that the tourism financial efficiency in the Chengdu-Chongqing Twin-City Economic Circle is generally on the rise, with total factor productivity changing by a factor of 10 over the study period. However, it is noteworthy that the minimum value of M is only 0.626, suggesting that in some areas, tourism financial efficiency declined during the study period. Conversely, the maximum value of M is 201.569, indicating extremely sharp changes in productivity efficiency in certain regions during the study period. According to the sub-indicators of M, these productivity changes are likely due to significant variations in scale efficiency or technical efficiency. The relatively large standard deviation of M indicates significant regional differences in tourism financial efficiency within the Chengdu-Chongqing Twin-City Economic Circle, with notable disparities in productivity changes across regions. Among the sub-indicators of M, the range, mean, and standard deviation of EFFCH are significantly larger than those of PECH and SECH, suggesting that the degree of efficiency change is more dramatic than that of pure technical efficiency or pure scale efficiency. EFFCH, therefore, serves as the main explanatory factor for productivity changes, i.e., M.
Table 3. Descriptive statistics of DEA-Malmquist index
N | Minimum | Maximum | Mean | Std. Deviation | |
M | 324 | 0.626 | 201.569 | 10.14156 | 23.756325 |
EFFCH | 324 | 0.477 | 29.158 | 4.34254 | 7.135894 |
PECH | 324 | 0.943 | 5.758 | 1.56321 | 0.552231 |
SECH | 324 | 0.425 | 3.819 | 1.09969 | 0.518237 |
Valid N (listwise) | 324 |
Since all four indicators are based on panel data, the explanatory power of the descriptive statistics may be limited and unable to provide a quantitative description of the efficiency indicators for individual units and time periods, thereby capturing the relevant characteristics. Therefore, the four tourism financial efficiency indicators are plotted according to the DEA-Malmquist method to obtain time trend graphs of efficiency indicators for each decision-making unit (Figure 1). From the graph, it can be seen that for most decision-making units, the changes in the four efficiency indicators were not significant, instead showing steady growth over the study period. The most notable trend is observed in the time series graph of M, where the time trend of several regions shows obvious differences compared to others. The time trend curve of M for Qijiang is relatively steep, with the largest increase occurring around 2013, and the highest cumulative growth in 2019, reaching over 200. For Changshou, Dazu, Tongliang, and Yongchuan, M showed a significant increase in 2012, followed by slow growth. Fuling and Mianyang showed steady growth in M throughout the study period, while Meishan experienced steady growth from 2011 to 2018, followed by a rapid increase in 2019. Therefore, overall, the tourism financial efficiency indicators of the Chengdu-Chongqing Twin-City Economic Circle exhibit an upward trend, with strong specificity in certain regions. During the study period, the varying degrees of growth in different regions and their interactions also affected the changes in their respective efficiency indicators.
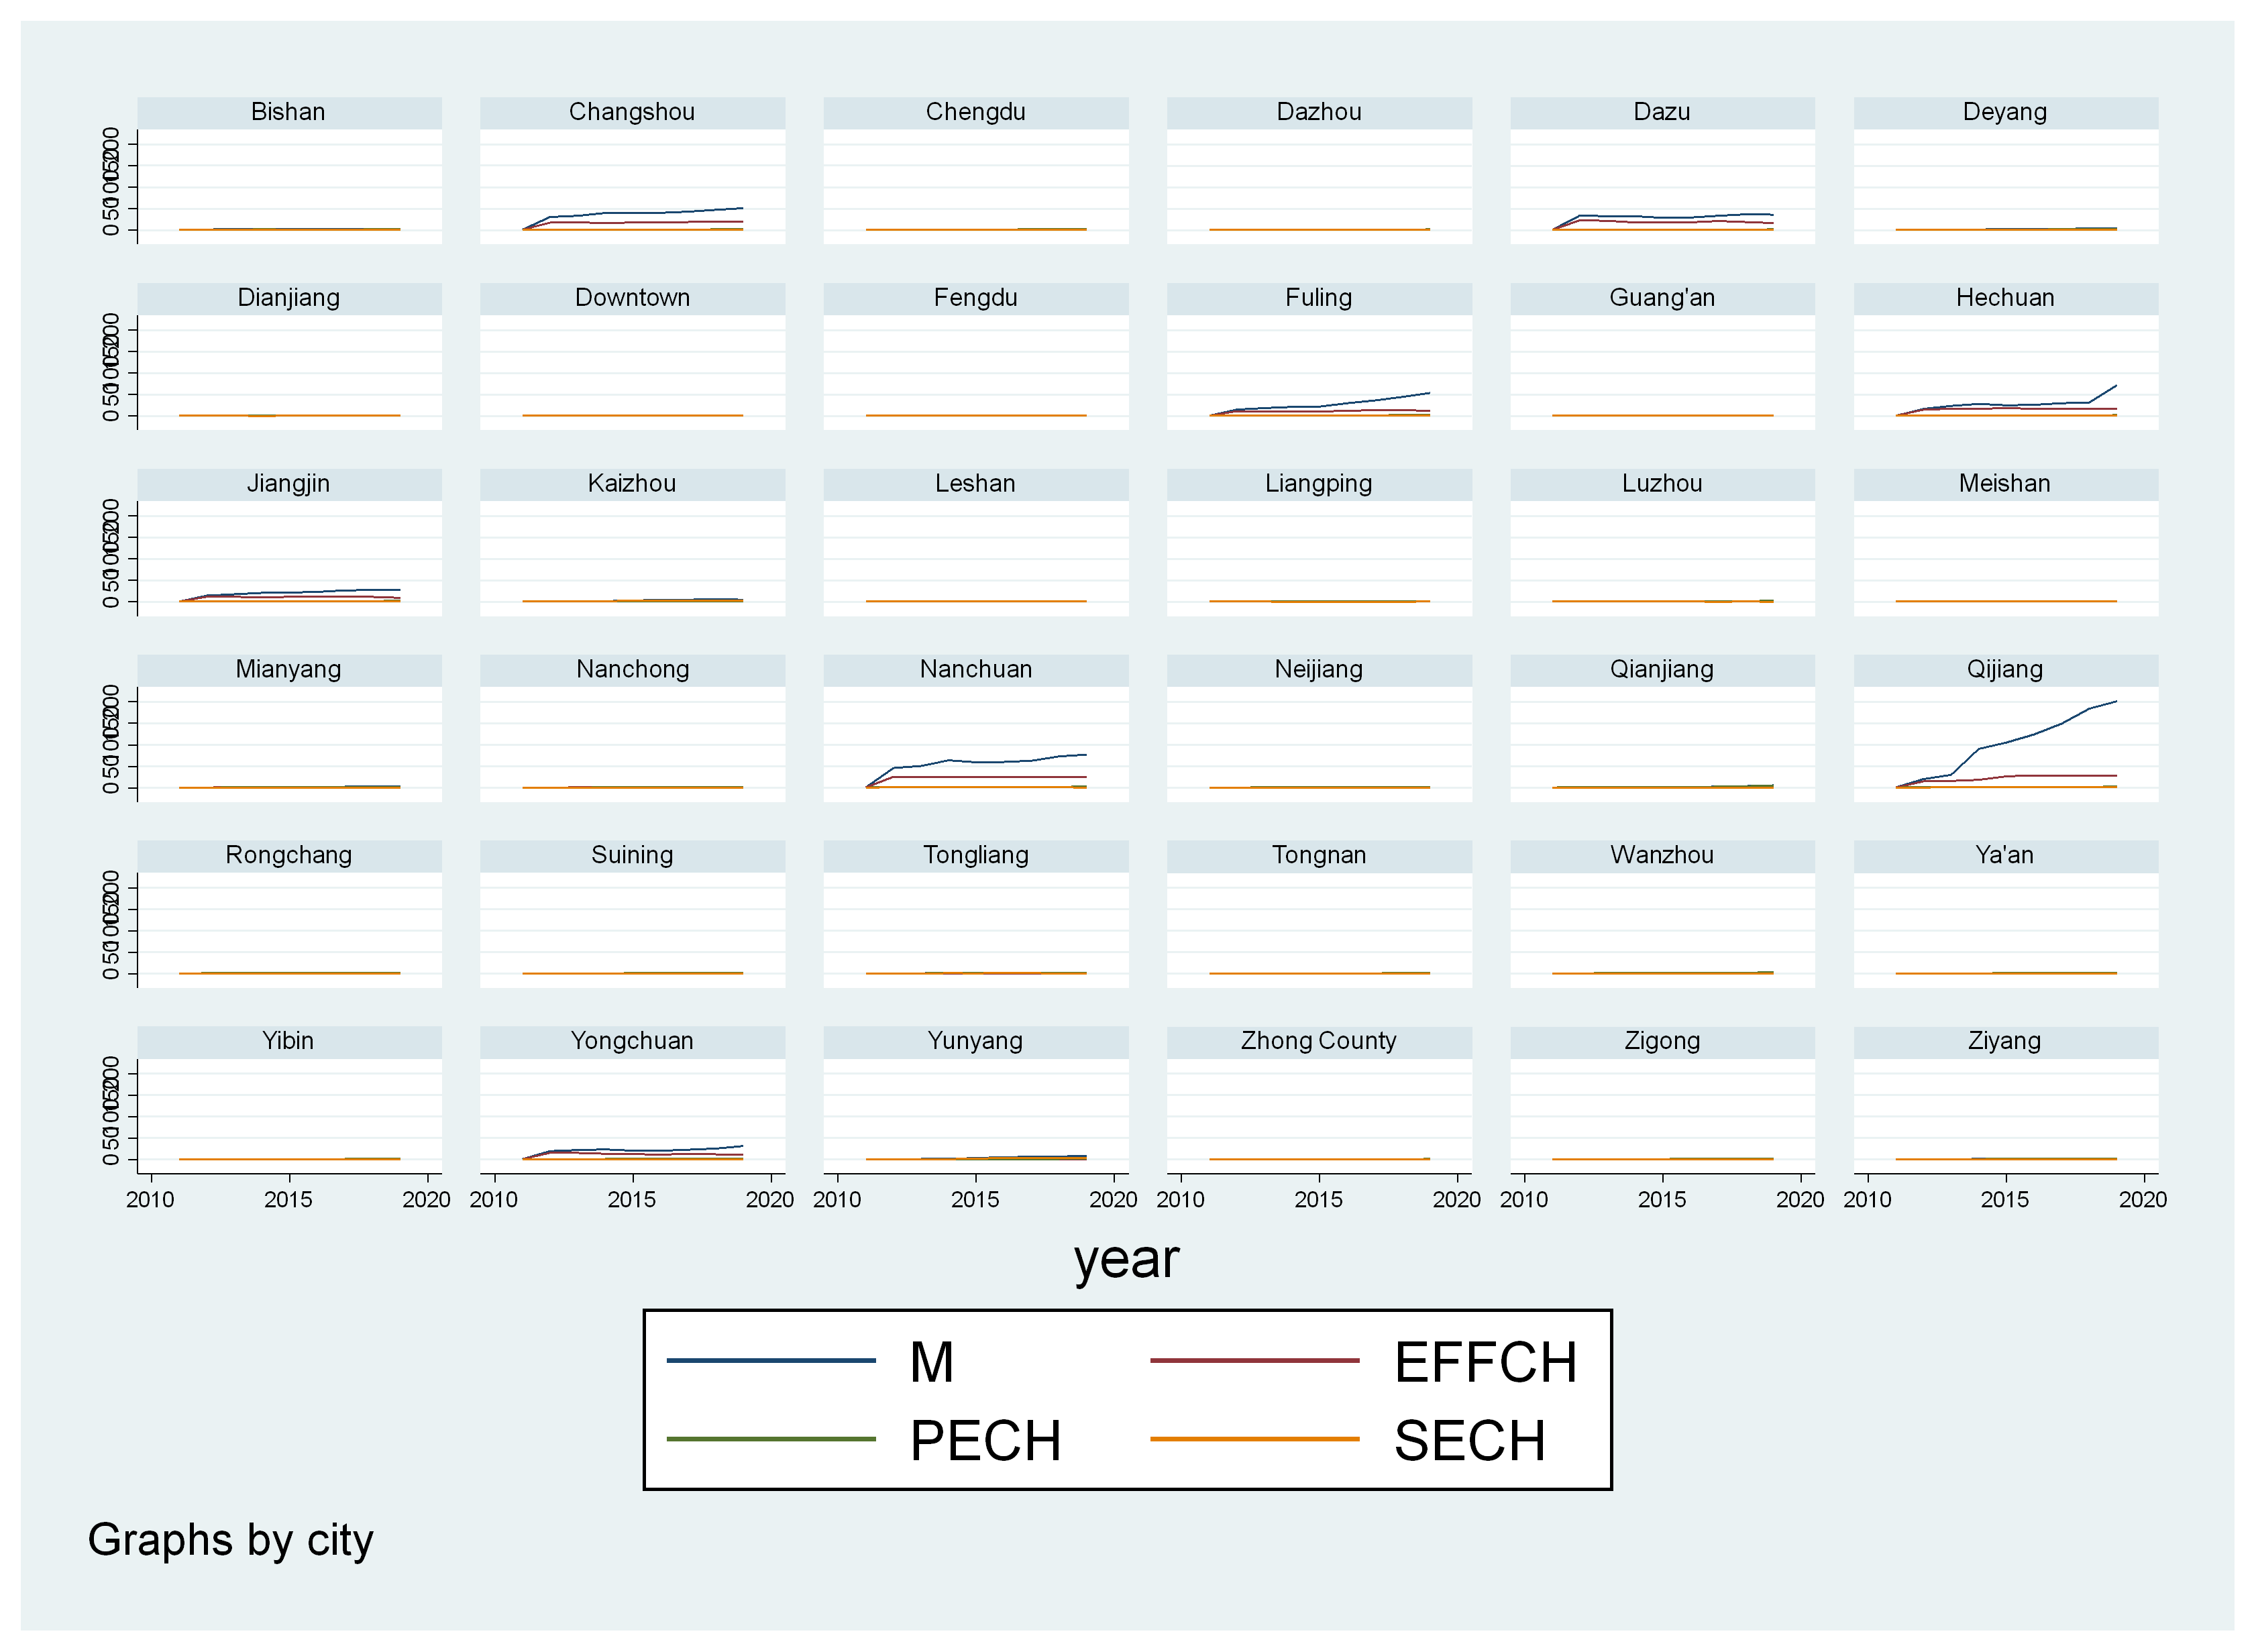
Figure 1. Time trends of the four efficiency indicators
3.2. Spatial correlation of the DEA-Malmquist model
Table 4 presents the results of the global spatial autocorrelation test for the DEA-Malmquist index of the Chengdu-Chongqing Twin-City Economic Circle from 2011 to 2019. As shown in the table, the Moran’s I index is positive and first increases and then decreases over time, with a rapid growth rate reaching 0.170 in 2012, peaking at 0.299 in 2014, and slowly decreasing to 0.204 in 2019. Most of the Moran’s I indices passed the significance test at the 1% level, with M2012 and M2013 being significant at the 5% level. No Moran’s I index was output for February 2011, as the M values of the 36 decision-making units were all set to 1 that year. The index measures the cumulative productivity change across the decision-making units of the Chengdu-Chongqing Twin-City Economic Circle. The global spatial autocorrelation test results indicate that the DEA-Malmquist index of the Chengdu-Chongqing Twin-City Economic Circle demonstrates positive spatial correlation, meaning that areas with high M values exhibit clustering, while those with low M values are spatially adjacent to each other.
Table 4. Global spatial autocorrelation test for DEA-Malmquist index
Variables | Moran’s I | z | p-value* |
M2011 | . | . | . |
M2012 | 0.170 | 2.041 | 0.041 |
M2013 | 0.220 | 2.517 | 0.012 |
M2014 | 0.299 | 3.579 | 0.000 |
M2015 | 0.286 | 3.719 | 0.000 |
M2016 | 0.275 | 3.797 | 0.000 |
M2017 | 0.253 | 3.707 | 0.000 |
M2018 | 0.244 | 3.768 | 0.000 |
M2019 | 0.204 | 3.008 | 0.003 |
*2-tail test, *p < 0.1, **p < 0.05, ***p < 0.01
Similar to the overall spatial correlation of the Chengdu-Chongqing Twin-City Economic Circle's efficiency, local spatial correlation is analyzed using local Moran scatter plots and local Moran’s I indices, with cumulative productivity change as the measurement criterion to comprehensively evaluate tourism financial efficiency. Table 4 shows the local Moran’s I results for 2012, 2016, and 2019, as well as the corresponding types of spatial clusters. Figures 2–4 display the local Moran scatter plots for the DEA-Malmquist index in 2012, 2016, and 2019, respectively. From Figures 2–4, it is clear that the number of decision-making units in the four local clusters of the Chengdu-Chongqing Twin-City Economic Circle is asymmetric, with significantly fewer high-high (H-H) and high-low (H-L) clusters compared to low-high (L-H) and low-low (L-L) clusters.
In general, with respect to the cumulative productivity change indicator M, only three types of local clusters (excluding any low-low clusters) were observed in the decision-making units of the Chengdu-Chongqing Twin-City Economic Circle, and these clusters were dispersed across different years. This may be because the overall trend of the Chengdu-Chongqing Twin-City Economic Circle is productivity growth, and due to economic advantages, transportation capabilities, and geographical location, the central cities are less likely to experience low productivity growth. On the contrary, due to their resource endowments, these areas have greater development potential, and the same policies may have a greater impact on peripheral cities than on central cities, leading to larger cumulative productivity changes. Notably, throughout the study period, only a stable number of high-high clusters were identified, and their spatial distribution remained consistent. In 2012 and 2019, only Qijiang and Nanchuan counties exhibited highly concentrated characteristics. In 2016, Jiangjin was also identified as a high-high cluster. According to the map of the Chengdu-Chongqing Twin-City Economic Circle, these three counties are adjacent and located in the southeastern part of Chongqing and the Chengdu-Chongqing economic zone. While these counties are not renowned tourist cities, they exhibit strong clustering characteristics, likely due to their proximity to the central city of Chongqing, where they benefit from the "spillover effect" of the central city and witness more productivity growth. This is further supported by Figure 5, which shows that Qijiang and Nanchuan have the highest M values among all decision-making units, with Qijiang in particular experiencing a cumulative productivity change in 2019 that was more than 200 times that of 2011. Next are the low-cluster regions. The only area showing this characteristic during the study period is the main urban area of Chongqing. As the central city, it is not surprising that the main urban area of Chongqing exhibits high tourism financial efficiency. As mentioned earlier, in the local clustering distribution of tourism financial efficiency in the economic circle, the main urban area of Chongqing belongs to the high-low (H-L) cluster, indicating that in terms of absolute scale of tourism financial efficiency, the main urban area of Chongqing surpassed surrounding cities. This resulted in the "spillover effect," where neighboring areas gained more economic resources, human capital, and transportation capabilities, thereby achieving greater productivity growth. Due to the high and stable tourism financial efficiency in the main urban area of Chongqing, its productivity growth rate is relatively low but stable, resulting in the appearance of a low-high (L-H) clustering characteristic in this area. Finally, there are the high-low clusters. In this study, only Hechuan exhibited a high-low clustering characteristic in 2019. Hechuan, located to the south of Chongqing's main urban area, is within the radiation range of the Chongqing urban cluster and borders Sichuan Province. The influx of resources from the central city and geographical advantages contributed to Hechuan's high M value. This is similar to Qijiang and Nanchuan, but because only this region to the north of the main urban area of Chongqing showed a high M value, no high-high cluster was formed. Instead, a high-low cluster was created within the surrounding low-M value environment (The DEA-Malmquist index’s local Moran’s I result as shown in Table5, Moran's Scatter Plot for DEA-Malmquist index in 2011, 2016 and 2019 as shown in Figure 2, 3 and 4)
Table 5. Local Moran’s I result for the DEA-Malmquist index
2012 | 2016 | 2019 | |||||||
DMU | Ii | p-value | AG | Ii | p-value | AG | Ii | p-value | AG |
Chengdu | 0.228 | 0.281 | N | 0.165 | 0.303 | N | 0.161 | 0.302 | N |
Deyang | 0.226 | 0.282 | N | 0.152 | 0.315 | N | 0.139 | 0.323 | N |
Meishan | 0.227 | 0.233 | N | 0.164 | 0.263 | N | 0.164 | 0.258 | N |
Ziyang | 0.049 | 0.397 | N | 0.105 | 0.304 | N | 0.124 | 0.275 | N |
Qixian | 0.134 | 0.306 | N | 0.108 | 0.313 | N | 0.058 | 0.377 | N |
Laishang | 0.226 | 0.282 | N | 0.168 | 0.300 | N | 0.163 | 0.300 | N |
Ya’an | 0.231 | 0.307 | N | 0.170 | 0.324 | N | 0.165 | 0.323 | N |
Zigong | 0.228 | 0.255 | N | 0.167 | 0.280 | N | 0.154 | 0.288 | N |
Luzhou | -0.005 | 0.474 | N | 0.049 | 0.399 | N | 0.061 | 0.382 | N |
Neijiang | 0.233 | 0.251 | N | 0.167 | 0.279 | N | 0.165 | 0.276 | N |
Nanchong | 0.235 | 0.275 | N | 0.178 | 0.291 | N | 0.172 | 0.291 | N |
Yibin | 0.233 | 0.306 | N | 0.174 | 0.321 | N | 0.161 | 0.326 | N |
Dazhou | 0.234 | 0.227 | N | 0.179 | 0.247 | N | 0.171 | 0.250 | N |
Guang’an | -0.015 | 0.482 | N | 0.036 | 0.402 | N | 0.009 | 0.442 | N |
Mianyang | 0.231 | 0.307 | N | 0.158 | 0.334 | N | 0.152 | 0.335 | N |
Central District | -0.525 | 0.046** | L-H | -0.485 | 0.040** | L-H | -0.484 | 0.038** | L-H |
Fuling | 0.692 | 0.032** | N | 0.328 | 0.143 | N | 0.248 | 0.198 | N |
Changshou | -0.360 | 0.226 | N | -0.150 | 0.374 | N | -0.062 | 0.464 | N |
Jiangjin | 0.174 | 0.302 | N | 0.418 | 0.091* | H-H | 0.251 | 0.195 | N |
Hechuan | -0.456 | 0.111 | N | -0.262 | 0.221 | N | -0.609 | 0.025** | H-L |
Yongchuan | 0.301 | 0.174 | N | -0.018 | 0.486 | N | -0.053 | 0.468 | N |
Nanchuan | 1.901 | 0.000*** | H-H | 3.644 | 0.000*** | H-H | 2.974 | 0.000*** | H-H |
Qijiang | 1.654 | 0.001*** | H-H | 3.542 | 0.000*** | H-H | 2.489 | 0.000*** | H-H |
Dazu | -0.359 | 0.198 | N | -0.189 | 0.315 | N | -0.133 | 0.375 | N |
Bishan | -0.167 | 0.361 | N | -0.061 | 0.461 | N | -0.110 | 0.402 | N |
Tongliang | -0.363 | 0.195 | N | -0.072 | 0.448 | N | -0.121 | 0.388 | N |
Tongnan | -0.134 | 0.382 | N | 0.013 | 0.446 | N | -0.023 | 0.492 | N |
Rongchang | -0.222 | 0.309 | N | 0.003 | 0.462 | N | 0.028 | 0.431 | N |
Wanzhou | 0.230 | 0.253 | N | 0.167 | 0.280 | N | 0.152 | 0.289 | N |
Qianjiang | 0.000 | . | N | 0.000 | . | N | 0.000 | . | N |
Liangping | 0.235 | 0.275 | N | 0.198 | 0.274 | N | 0.180 | 0.284 | N |
Fengdu | 0.028 | 0.457 | N | 0.013 | 0.462 | N | -0.019 | 0.491 | N |
Dianjiang | -0.039 | 0.487 | N | 0.007 | 0.449 | N | 0.013 | 0.439 | N |
Zhongxian | 0.235 | 0.275 | N | 0.194 | 0.276 | N | 0.179 | 0.285 | N |
Kaizhou | 0.219 | 0.315 | N | 0.108 | 0.377 | N | 0.115 | 0.367 | N |
Yunyang | 0.216 | 0.351 | N | 0.088 | 0.414 | N | 0.089 | 0.410 | N |
*1-tail test, *p<0.1, **p<0.05, ***p<0.01, AG denotes aggregation type, N indicates no significance.
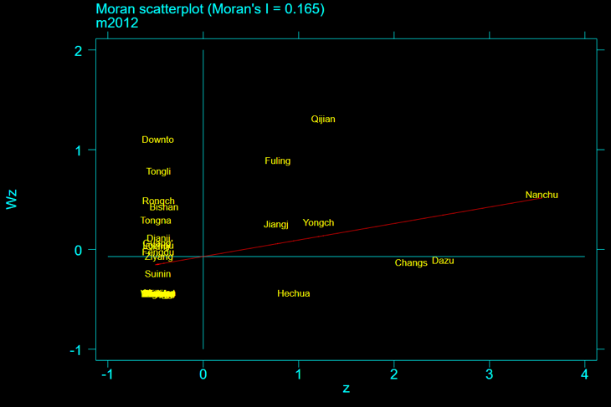
Figure 2. Moran's Scatter Plot for DEA-Malmquist index in 2011
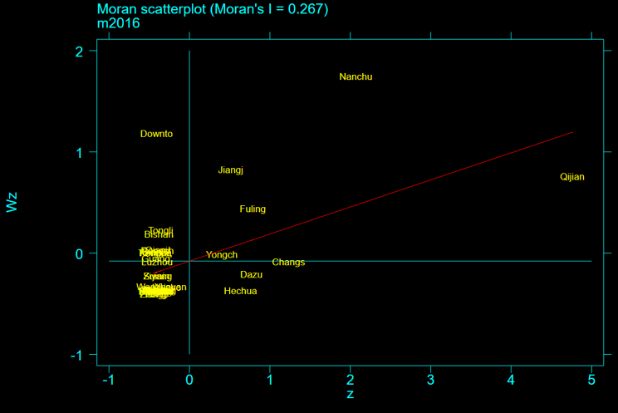
Figure 3. Moran's Scatter Plot for DEA-Malmquist index in 2016
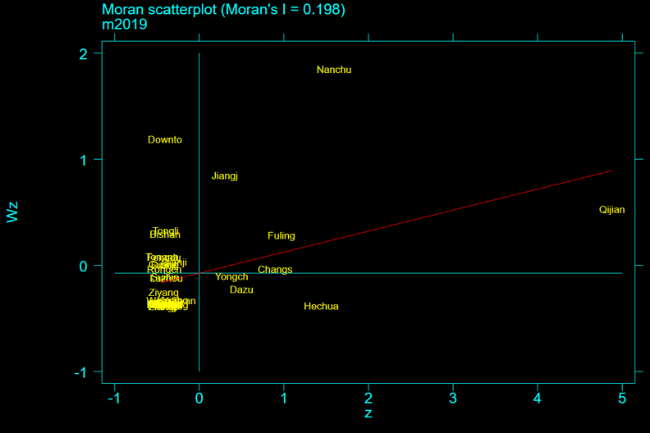
Figure 4. Moran's Scatter Plot for DEA-Malmquist index in 2019
3.3. Analysis of the influencing factors of tourism financial efficiency in the Chengdu-Chongqing Twin-City Economic Circle based on GeoDetector
The exploration of the determinants of M will focus only on the 2019 cross-sectional data. This is because M is an indicator of cumulative productivity growth, and the 2019 data is sufficient to illustrate the contribution of each variable to the spatial heterogeneity of M during the study period. Table 6 presents the factor detection results for M. It can be seen that five independent variables in 2019 exhibited statistical significance: POP, ID, DB, and BE are significant at the 10% level, CD at the 5% level, and LB at the 1% level. In terms of the absolute value of the q-statistic, LB shows the strongest explanatory power and statistical significance regarding the spatial heterogeneity of M, with a q-statistic value of 0.4122. CD’s q-statistic is 0.3505, followed by the remaining three independent variables, each with a q-statistic slightly above 0.2. These results indicate that among the factors affecting the change in tourism financial efficiency, i.e., the change in cumulative productivity growth, consumer demand is the primary determinant, aside from the DEA input variables. This means that the stronger the consumption demand in a region, the more it stimulates the growth of tourism financial efficiency M. Demographic factors also have some explanatory power, as labor is an important source of productivity growth. Moreover, industrial structure upgrading has a positive impact on the development of tourism finance.
Table 6. Factor detection results for M
POP | ED | ID | TA | CD | OO | DB | LB | IF | BE | |
q statistic | 0.2130* | 0.1502 | 0.2392* | 0.1627 | 0.3505** | 0.0775 | 0.2253* | 0.4122*** | 0.1018 | 0.2148* |
p value | 0.0983 | 0.2140 | 0.0932 | 0.1841 | 0.0136 | 0.4962 | 0.0837 | 0.0047 | 0.3776 | 0.0960 |
4. Conclusion and recommendations
4.1. Characteristics of tourism financial efficiency in the Chengdu-Chongqing Twin-City Economic Circle
Based on the DEA-Malmquist model, the overall tourism financial efficiency in the Chengdu-Chongqing Twin-City Economic Circle shows a significant upward trend. However, there are notable regional disparities. Some regions face challenges such as resource shortages, poor management, or market fluctuations, which lead to a decline in tourism financing efficiency. In contrast, other regions, influenced by special policies or market opportunities, have experienced extreme growth in tourism financial efficiency. From the perspective of spatial clustering analysis of tourism financial efficiency, the spatial clustering pattern of tourism finance development shows diversity and complexity. The issue of regional disparities is further highlighted, and regions with higher levels of economic development do not necessarily show good performance in productivity growth. Meanwhile, some secondary regions may benefit from the positive impact of the “trickle-down effect.” This suggests that there is economic resource waste or uneven distribution in these regions, requiring more in-depth research and improvements. Many areas have latent growth opportunities. Governments and businesses can leverage these opportunities through investment and development measures to promote broader tourism financial economic growth, improving the overall competitiveness and sustainable development levels of the region.
4.2. Influencing factors of tourism financial efficiency in the Chengdu-Chongqing Twin-City Economic Circle
According to the GeoDetector analysis, it was found that industrial structure upgrading in the Chengdu-Chongqing Twin-City Economic Circle has a profound impact on tourism financial efficiency. (1) With the upgrading of the industrial structure, the tourism industry in the region has developed rapidly, thus improving tourism financial efficiency. This structural upgrade may include technological advancements, industry diversification, and the rise of emerging industries, all of which help attract more tourists and investments. (2) Deposit and loan levels are two other significant determinants. Higher deposit levels may indicate that there are more funds available for tourism industry development, such as infrastructure development and marketing. Simultaneously, increased loan levels can provide more financing channels for tourism businesses, promoting business expansion and improvement. (3) The study also highlights the importance of demographic factors in explaining tourism financial efficiency. For instance, population size, age structure, and income levels may have a significant impact on tourism demand and consumption. Therefore, when formulating tourism policies and strategies, these factors must be fully considered to ensure more accurate targeting and resource allocation. Finally, the study found that the degree of openness has a relatively small impact. This may suggest that tourism financial efficiency in the Chengdu-Chongqing Twin-City Economic Circle is more influenced by internal factors. Although openness is important, it is not a decisive factor. However, this does not mean that openness should be overlooked, as it remains crucial for the long-term sustainability of the tourism industry.
4.3. Development suggestions for tourism finance in the Chengdu-Chongqing Twin-City Economic Circle
4.3.1. Further promote the integration and coordinated development of the tourism and financial sectors to achieve synergistic benefits and mutual wins
According to the research, the economic foundation of the main urban districts of Chongqing and the surrounding northeastern counties is relatively weak, with the lowest tourism financial efficiency. The scale of tourism investment is relatively small, leading to the potential risk of falling into a “poverty trap.” Therefore, the government should play a guiding and regulatory role in financial resource allocation. By using investment and financing measures along with preferential fiscal and tax policies, the government should allocate funds more strategically to areas rich in tourism resources (the southwestern part of Chengdu and the main urban district of Chongqing). At the same time, it should encourage small and micro tourism enterprises by offering preferential financing policies for tourism innovation and entrepreneurship, addressing the blind spots, spontaneity, and profit-driven nature of the tourism market.
a. Improve the Banking Sector’s Financial Support for the Tourism Industry: The government should reduce loan thresholds, simplify loan approval procedures, and allow tourism companies with good returns and high credit ratings to use future profits as collateral. This would increase opportunities for tourism companies to receive financial support. Given the large demand for tourism funds and the long investment cycle, syndicated loans provided by financial institutions jointly should be encouraged, where risks are shared, and profits are distributed. Credit limits and permissions should be adjusted reasonably to meet the unique funding needs of the tourism industry. Financial institutions should actively improve basic service facilities to meet the electronic service demands of tourists, such as online tourism consultations, guides, and consumption services.
b. Innovate the Tourism Insurance System to Deepen the Integration of Tourism and Finance: Develop differentiated travel agency liability insurance and expand the coverage to cover all aspects of tourism, thus providing comprehensive risk protection for both tourism companies and tourists. Improve the environmental insurance system to ensure that tourism resources are developed within the environmental carrying capacity, thereby achieving sustainable tourism development while creating a balance between social, environmental, and economic benefits.
c. Accelerate the Capital Integration of the Tourism and Financial Sectors to Improve Resource Allocation Efficiency: Allow tourism capital to invest in financial institutions. This not only increases the capital scale of financial institutions, enhancing their ability to resist risks, but also prioritizes providing financial services to the tourism industry, thereby improving tourism financial efficiency. The government should lead the establishment of a tourism investment fund, attract social and private capital into the tourism industry through public offerings, and cultivate high-quality tourism projects and products in the market. This approach would not only reduce the government’s dominant position in the tourism industry but also expand financing channels, promoting the healthy development of the tourism industry.
4.3.2. Further promote the upgrading of the industrial structure to leverage the synergistic effects of industrial optimization in the Chengdu-Chongqing Twin-City Economic Circle
Given that industrial structure upgrading directly impacts tourism financial efficiency, it should be continuously promoted to maximize the synergistic effects between the financial and tourism sectors. Specifically, the main urban districts of Chongqing and the northeastern counties should appropriately undertake the industrial transfer from Chongqing’s central city and southwestern Sichuan cities. In tourism resource-rich but underdeveloped areas like Chongqing's central districts, the concept of "enclave economy" can be developed to achieve mutual resource complementarity and expand market and development space between the central and peripheral cities, thus promoting economic integration.
Additionally, tourism is a highly interrelated industry, and comprehensive development of tourism products stimulates many sectors of the tertiary industry. This, in turn, can increase the marginal productivity of financial and tourism factors in the Chengdu-Chongqing Twin-City Economic Circle, effectively improving management levels and business performance. Therefore, it is essential to leverage the chain reactions between the related industries in various urban clusters within the Chengdu-Chongqing Twin-City Economic Circle to inject new vitality into the sustainable growth of tourism financial efficiency.
4.3.3. Stimulate tourism consumption demand to promote healthy development of tourism finance
Given that consumer demand is beneficial for improving tourism financial efficiency, the focus should be on seizing the opportunities of the current era to effectively stimulate tourism consumption demand, thereby promoting the healthy development of tourism finance. This requires strengthening technological innovation in tourism products and services. In terms of technological innovation, digital transformation is a key trend in the future development of the financial industry. Increased investment in technology research and development should be encouraged, utilizing the internet, big data, and other technologies to provide services to both tourism companies and tourists. By leveraging credit data accumulation, financial services can be developed to adapt to the expanding tourism market, longer product life cycles, and increasing safety requirements. The “technology + tourism” model should be innovated to promote smart tourism development, meeting diverse tourism demands.
In terms of innovation in tourism products and services, commercial banks should enhance customer loyalty by providing specialized services, focusing on deposit absorption and expanding intermediary services. They should assess and integrate existing products, developing offerings tailored to the tourism consumption market. For example, to address the funding needs at various stages of tourism management, such as service quality guarantees for travel agencies, scenic area construction, hotel, and homestay development, new financing and guarantee models can be explored. This could include loans for service quality guarantees for travel agencies, loans for key tourism projects, and hotel property loans.
4.3.4. Address regional disparities in tourism financial efficiency in the Chengdu-Chongqing Twin-City Economic Circle
Considering the gradient differences in tourism financial efficiency across decision-making units in the Chengdu-Chongqing Twin-City Economic Circle, cities in southwestern Sichuan and the main urban district of Chongqing should continue to support improvements in tourism quality through enhanced tourism financial efficiency. High-concentration areas should actively improve and enhance their own tourism financial systems, innovate ways and paths for financial elements to promote the development of tourism, and create a favorable financing environment for tourism. Furthermore, surrounding cities should learn from the advanced tourism financial management experiences of the central city and actively undertake the transfer of advantageous industries and capital. By optimizing their own industrial structures, they can create a strong financial support environment for high-quality tourism development, thus narrowing the gap in tourism financial efficiency development across the Chengdu-Chongqing Twin-City Economic Circle and improving the overall level of tourism integration, marketization, and internationalization in the economic region.
Project source
This paper is part of the research outcomes of the Chongqing Municipal Education Commission Science and Technology Project "Tourism Financial Efficiency Measurement and Model Research for the Chengdu-Chongqing Twin-City Economic Circle under the Digital Economy Context" (Project No.: KJQN202300903) and the Sichuan International Studies University Research Project "Tourism Financial Measurement and Model for Chongqing under the Digital Economy Context" (Project No.: sisu202322).
References
[1]. Akkaya, G. C., & Uzar, C. (2012). Financial efficiency test of the ISE tourism companies: Data envelopment analysis application. International Journal of Economics and Finance Studies, 4(1), 95-100.
[2]. Mu, X., Guo, X., & Ming, Q. (2020). Spatial-temporal patterns and spatial effects of tourism financial efficiency in the Yangtze River Economic Belt. Economic Theory, 40(6), 214-223.
[3]. Jaisinghani, D., Joshi, M., Goyal, J., & Sharma, S. (2022). Persistence of financial efficiency in the Indian hospitality and tourism industry: A dynamic panel approach. Quality & Quantity, 1-19.
[4]. Li, J., & Shu, B. (2022). Research on the tourism financial efficiency of six central provinces: Dynamic evolution, spatial pattern, and driving factors. Economic Issues Exploration, (1), 67-78.
Cite this article
Wang,L.;Wang,D.;Peng,X. (2025). Research on the development characteristics and influencing factors of tourism financial efficiency in the Chengdu-Chongqing Twin-City Economic Circle based on DEA-Malmquist and GeoDetector. Journal of Applied Economics and Policy Studies,18(1),40-49.
Data availability
The datasets used and/or analyzed during the current study will be available from the authors upon reasonable request.
Disclaimer/Publisher's Note
The statements, opinions and data contained in all publications are solely those of the individual author(s) and contributor(s) and not of EWA Publishing and/or the editor(s). EWA Publishing and/or the editor(s) disclaim responsibility for any injury to people or property resulting from any ideas, methods, instructions or products referred to in the content.
About volume
Journal:Journal of Applied Economics and Policy Studies
© 2024 by the author(s). Licensee EWA Publishing, Oxford, UK. This article is an open access article distributed under the terms and
conditions of the Creative Commons Attribution (CC BY) license. Authors who
publish this series agree to the following terms:
1. Authors retain copyright and grant the series right of first publication with the work simultaneously licensed under a Creative Commons
Attribution License that allows others to share the work with an acknowledgment of the work's authorship and initial publication in this
series.
2. Authors are able to enter into separate, additional contractual arrangements for the non-exclusive distribution of the series's published
version of the work (e.g., post it to an institutional repository or publish it in a book), with an acknowledgment of its initial
publication in this series.
3. Authors are permitted and encouraged to post their work online (e.g., in institutional repositories or on their website) prior to and
during the submission process, as it can lead to productive exchanges, as well as earlier and greater citation of published work (See
Open access policy for details).
References
[1]. Akkaya, G. C., & Uzar, C. (2012). Financial efficiency test of the ISE tourism companies: Data envelopment analysis application. International Journal of Economics and Finance Studies, 4(1), 95-100.
[2]. Mu, X., Guo, X., & Ming, Q. (2020). Spatial-temporal patterns and spatial effects of tourism financial efficiency in the Yangtze River Economic Belt. Economic Theory, 40(6), 214-223.
[3]. Jaisinghani, D., Joshi, M., Goyal, J., & Sharma, S. (2022). Persistence of financial efficiency in the Indian hospitality and tourism industry: A dynamic panel approach. Quality & Quantity, 1-19.
[4]. Li, J., & Shu, B. (2022). Research on the tourism financial efficiency of six central provinces: Dynamic evolution, spatial pattern, and driving factors. Economic Issues Exploration, (1), 67-78.