


1. Introduction
The report of the 20th National Congress of the Communist Party of China has established “advancing the great rejuvenation of the Chinese nation through Chinese-style modernization” as the core development program for the new era and specifically emphasized that “Chinese-style modernization is modernization with a large population.” This assertion profoundly reveals the fundamental role of population factors in the national modernization process: as the only economy in the world with a population exceeding 1.4 billion, China must not only avoid the potential threat posed by the “low fertility rate trap” to long-term development but also resolve the structural contradictions in converting the demographic advantage into a human capital dividend. The strategic importance of population issues has surpassed the simple dimension of quantity, turning towards considerations of quality, structure, and intergenerational balance. The latest data from the National Bureau of Statistics shows that by the end of 2024, China’s total population had decreased by 1.39 million compared to the previous year, marking three consecutive years of negative growth, with the natural population growth rate dropping to a historical low of -0.99‰. This continuous population decline signals that China has entered the stage of “endogenous negative growth,” which not only creates sustained pressure on labor supply, social security systems, and innovation momentum but may also shake the population scale base required for Chinese-style modernization. Therefore, how to resolve the fertility dilemma through institutional innovation and stabilize the total fertility rate within a moderate range (1.6-1.8) is both an inherent requirement for achieving long-term balanced population development and a strategic choice for maintaining the country’s competitive advantage.
In response to the challenges posed by demographic structural transformation, the implementation of the three-child fertility policy in 2021 marked a paradigm shift in China’s fertility policy from a “restrictive” to a “supportive” approach. The policy adjustment, which lifted the restriction on the number of children, theoretically released a broader range of fertility choices for the childbearing population. However, existing studies show that the policy loosening has not achieved the expected results: the number of births in 2021, 2022, and 2023 was 10.62 million, 9.56 million, and 9.02 million, respectively, showing a decreasing trend year by year [1]. This paradox highlights the complexity of the fertility decision-making mechanism in the post-population transition period—when institutional constraints are lifted, the implicit cost constraints derived from economic and social transformation become dominant. Specifically, residents’ fertility willingness, as a core variable connecting macro policies with micro behaviors, continues to decline under the combined influence of higher education universalization, accelerated urbanization, and modernized marriage and childbearing concepts [2]. The childbearing population increasingly exhibits tendencies such as “delayed marriage,” “fewer children,” and even “non-marriage,” creating the typical feature of the coexistence of “policy leniency” and “low fertility.”
Further analysis reveals that the suppressive effect on fertility willingness arises from the systematic accumulation of multiple pressures: first, the intensification of labor market involution exacerbates the work-family conflict, with high-intensity competition leading 46.7% of female employees to delay childbearing due to career development anxiety [3]; second, the intergenerational child-rearing model has shifted from a “extensive” to a “refined” approach, with the proportion of rigid expenditures such as education and healthcare rising, forcing families to adopt a “quality over quantity” strategy for childbearing [4]; third, the accelerated population mobility weakens the traditional family support network, with the fertility rate of migrant populations being 34.2 percentage points lower than that of the registered population [5]. These mechanisms collectively point to the squeezing effect of workplace involution on the “economic space” for childbearing: rising housing costs compress household budget allocation, the 996-work system erodes individual time resources, and implicit discrimination such as the “35-year age threshold” increases the opportunity costs of childbearing [6, 7]. In this context, family childbearing is no longer merely a biological reproductive act but has been alienated into a complex decision-making process requiring precise calculation of time costs, economic investment, and career risks. What is especially concerning is the growing separation between “birth” and “child-rearing”—while childbearing is encouraged by policies, the absence of a child-rearing support system leads to a “family burden” dilemma, causing a dual reinforcement of the “reluctance to give birth” and “unable to afford to raise” situation.
Current research largely focuses on the macro effects of fertility policies or the analysis of single influencing factors, but the mechanisms by which workplace involution suppresses fertility willingness through time allocation, economic constraints, and psychological pressure remain insufficiently deconstructed. This paper attempts, based on existing research, to construct an “institutional environment-structural pressure-behavioral decision” analytical framework and focuses on the following questions: First, how does labor market competition squeeze marriage and childbearing resources through the “time poverty” mechanism? Second, how does the reinforcement of female individual consciousness lead to the abandonment of fertility as a personal value realization choice? Third, how does the competitive anxiety arising from workplace involution reshape individual fertility value perception? Answers to these questions will not only help reveal the logical formation of low fertility willingness but also provide precise policy targets for building a fertility-friendly society, thus facilitating the strategic transformation from a demographic dividend to a human capital dividend within the period of population scale advantage, and consolidating the development foundation for Chinese-style modernization.
2. Literature review
The report of the 20th National Congress of the Communist Party of China establishes “optimizing the population development strategy and establishing a fertility support policy system” as the core guideline for high-quality population development, highlighting the strategic value of fertility willingness research during the period of sustained population scale advantage. Since the reform and opening up, China’s fertility policies have undergone gradual adjustments from the “one-child policy” (2013), to the “two-child policy” (2015), and then to the “three-child policy” (2021), with the policy goal shifting from controlling population numbers to improving population structure. However, simulations using computable general equilibrium (CGE) models show that the marginal effect of the three-child policy on fertility willingness is only 0.08 children, significantly weaker than the stimulating effect of the two-child policy, which was 0.23 children [8]. The adjustment of fertility policies has not changed the ongoing downward trend in China’s birth rate [1].
The overall fertility level of a society is directly influenced by two factors: the national fertility policy and the fertility willingness of the people [9]. Therefore, to implement more effective and targeted fertility policies, understanding national fertility willingness is essential. Existing research has found that fertility willingness varies, primarily reflecting differences in family environment, region, household registration, education, gender, and age. Research on family environment has shown that only-child families tend to have lower fertility willingness [10]. Fertility rate reflects fertility willingness [2]. A quantitative analysis of 41 cities in the Yangtze River Delta revealed that regions with higher levels of economic development have higher fertility rates, while regions with higher urbanization and education levels have lower fertility rates. Rural and urban women differ in their education, cultural environment, and economic strength. Rural migrant women generally have lower fertility willingness but greater fertility potential, with a preference for males, although this preference has weakened to some extent [11].
Most previous fertility studies have focused on families as a whole, with few considering the differences in fertility decision-making preferences between men and women. Studies specifically exploring gender differences in fertility willingness have found that male fertility willingness is significantly higher than that of females, and this difference expands with the number of children. Furthermore, as fertility policies relax, the gender difference in fertility willingness continues to widen [4]. As women age, their physical function may decline, fertility risks increase, and concerns about potential communication difficulties with children due to a large age gap may further reduce fertility willingness [11]. In recent years, influenced by the COVID-19 pandemic, childcare burdens have increased, leading many women to delay or even reduce plans for expanding their families [12].
Reviewing the literature on factors influencing fertility willingness, fertility willingness refers to people’s attitudes toward and choices regarding reproductive behavior, primarily including the desired number of children, preferred timing for childbirth, and gender preferences for children. A review of the literature reveals that the factors influencing fertility willingness can be summarized into three main categories: individual, family, and social factors. At the individual level, fertility willingness is mainly influenced by factors such as personal economic conditions (income), education level, nature of the work unit, social class, physical health, and social media usage. Economic conditions form the material basis for raising children, and individuals with higher incomes and more assets tend to have stronger fertility willingness [13]. In contrast, income constraints are also a major inhibiting factor for fertility willingness, and income’s influence on fertility willingness follows a U-shaped curve [14].
In addition, existing studies have shown that female education has a negative impact on fertility willingness because women can participate more in social work, which leads to an increase in the opportunity cost of having children [10]. Moreover, career development intentions also have an impact, especially for women in lower socioeconomic positions [15]. The nature of the work unit has a significant influence on the desired number of children and the willingness to have a second child for women in their prime childbearing years. Working in government or public institutions with less work pressure and more regular working hours can increase women’s fertility willingness, while working outside the system carries high opportunity costs and penalties for childbirth [3]. Non-formal employment tends to have higher fertility willingness than formal employment, and the “having children to ensure old-age security” mindset is stronger [16]. The influence of social media use on individual fertility willingness needs to be discussed on a case-by-case basis. When women are exposed to information passively, they have not formed clear fertility plans and are easily influenced by preconceptions, which have a significant negative correlation with fertility willingness for both unmarried and married women, while the correlation with actively seeking information is not significant [17]. In terms of family factors, intergenerational care and paternal involvement have a significant impact on fertility willingness and decision-making. Paternal involvement (referring to fathers’ participation in child-rearing) can improve life satisfaction, household satisfaction, and reduce the “motherhood penalty,” thus increasing fertility willingness [18].
From the Perspective of Social Influencing Factors, various aspects such as policies, the natural environment, economic conditions, traditional culture, and social welfare all influence residents’ fertility intentions. For instance, the rise in housing prices has a significant negative impact on fertility intentions [6], whereas digital inclusive finance has enhanced fertility intentions by easing liquidity constraints [19]. Traditional culture, which primarily includes clan culture (Confucianism), has deeply influenced the Chinese population with ideas like “there are three forms of unfilial behavior, the worst of which is having no descendants” and “more children, more blessings,” which have been passed down through generations and have a substantial impact, boosting fertility intentions and male preference for children. The country’s household registration and urbanization policies have increased social security efficiency, weakened public welfare and had a crowding-out effect on fertility intentions [20]. There is limited research on the impact of the natural environment on fertility intentions. However, some scholars have found that air pollution affects the physiological and psychological health of women of childbearing age, as well as the health of future generations, thereby indirectly negatively impacting fertility intentions [21].
Involution research reveals that involution is a zero-sum, intense competition phenomenon within limited developmental space. Existing literature clearly defines the nature of workplace involution: due to the limitations in expanding a particular work domain, individuals fall into a state of irrational competition with high resource input but low economic output in response to the contradiction between resource demand and allocation.
The main cause of involution is the limited and closed space, with competitive rules being exclusive, forming a zero-sum game. In such a competition, the input increases but the total social output does not grow, preventing a win-win situation for individual gains and overall growth. Involution exists in all areas and stages of social development, in specific groups and situations. As long as there is intense zero-sum competition in a limited space, involution will occur. In an excessively competitive “suicidal” social environment, the cost of obtaining specific benefits (such as educational qualifications, job positions, or promotions) continues to rise, marginal benefits decrease, and life satisfaction diminishes [22]. Similarly, regarding the causes of workplace involution, scholars argue that under the social background of economic and social development leading to a reduction in overall resources, employees and leaders, in pursuit of maximizing benefits and individual thought patterns, actively or passively participate in workplace involution. Workplace involution has had certain negative impacts on enterprise management. To address career burnout caused by involution, scholars have proposed feasible reform measures from four directions: management cognition, leadership style, employee management, and institutional setting.
Based on the analysis of existing literature on workplace involution and factors affecting fertility intentions, it can be inferred that the impact of workplace involution on fertility intentions can be classified into two aspects: one is the emphasis on personal interests and the pursuit of social status, and the other is the concern for future generations. As the social environment opens up and women’s awareness rises, a series of women’s liberation movements have led to the call for “women’s independence,” which has been widely promoted. Women have started to participate more in the workforce. However, under the social conditions of mothers in China, the phenomenon of “motherhood penalty” still exists, with the opportunity cost of having children being high, resulting in a decrease in fertility intentions and fertility decisions. Furthermore, China is deeply influenced by Confucian culture, which holds the belief that “only through hard work can one succeed.” This mindset is intolerant of poor academic or career performance, leading to high academic achievements among students and increasing anxiety among parents and children [23]. When life satisfaction decreases to the point where life is no longer considered worth living, and it is believed that descendants will repeat the same living conditions [8], both those who have children and those who do not will reduce or abandon fertility strategies and behaviors.
Although existing research has accumulated rich results in analyzing the factors influencing fertility intentions and social involution phenomena, it has yet to deeply reveal the transmission mechanisms through which micro-level competitive ecology, such as workplace involution, affects fertility decisions. Current countermeasures mainly focus on macro-policy regulation and cultural guidance, while ignoring the latent path through which intense workplace competition compresses individual time resources, increases survival anxiety, and suppresses fertility intentions. This paper breaks through the traditional macro perspective and constructs, for the first time, an interdisciplinary framework linking workplace involution and fertility intentions. Through quantitative analysis of the direct depletion effects of workplace involution on fertility plans and its psychological mediating effects, the paper reveals the “involution—resource depletion—fertility delay” chain logic. Based on this, corresponding countermeasures and solutions are proposed, providing a breakthrough for solving the low fertility dilemma with both theoretical innovation and practical operability.
3. Theoretical analysis of the impact of workplace involution on residents’ fertility intentions
This article is based on related theories in development economics, labor economics, and population economics, and discusses the impact mechanism of workplace involution on residents’ fertility intentions from the following three aspects.
(1) The Displacement Effect of Disposable Time: Workplace involution causes residents to invest more of their time in work. In modern workplaces, due to the prevalence of mobile internet and smart devices, the boundaries of work hours have become blurred, making it increasingly difficult for workers to distinguish between work and personal time. This ambiguity forces workers to extend working hours to increase income, and excessive work requires relaxation through consumption, which further increases daily expenses, forming a hidden cycle of “work and then consume” [24]. At the same time, with the extension of working hours and increased work intensity, residents’ time outside of work becomes very limited, making it difficult for them to participate in family activities, including caring for children and making family decisions, thus reducing the time and energy available for childbirth and child-rearing [25]. In addition, due to intense workplace competition, many people need to invest a significant amount of time in their careers to improve their abilities and competitiveness, which further compresses the space for family and personal life. With the development of the economy and society, and changes in fertility concepts, family fertility decisions are entering a more rational and cost-constrained phase. When people make rational predictions about the time consumed by fertility activities and believe that the return on investment from having children is lower [7], this not only worsens their labor supply, wage income, and health but also increases the opportunity cost of having children, thereby reducing fertility behavior. Therefore, workplace involution not only increases working hours but also influences residents’ fertility intentions through the dual pressure of economic costs and time costs.
(2) The Suppressive Effect on the Realization of Female Personal Value: With the widespread popularization of higher education, people’s horizons have broadened, and women no longer view “continuing the family line” as their sole value goal. The opportunities for education and career development have led women to invest more in their careers rather than traditional childbearing roles. At the same time, the narrowing gender income gap and increased competitiveness of women in the workplace have increased the opportunity cost of having children for women. Specifically, higher educational levels typically suppress women’s fertility intentions by increasing opportunity costs and delaying marriage age.
Workplace involution exacerbates this effect, as the increase in living costs and the unequal distribution of educational resources brought about by economic development make career women face a trade-off between childbearing and career development. This trade-off often comes at the cost of reduced fertility intentions [1]. Moreover, as women’s participation in the workplace increases, the issue of balancing work and family becomes more pronounced, further lowering their fertility intentions [10]. In addition, the increase in educational expectations reduces the actual number of children families have. In a socially involuted educational environment, parents (especially women) may increase investment in their children’s education due to high expectations for their future. This investment is not only financial but also involves time and effort. This high level of investment further squeezes the resources and time women have for childbearing and child-rearing, thereby suppressing fertility intentions [26].
(3) The Anticipatory Effect of Workplace Involution: The term “involution” initially emerged as a negative term in internet vocabulary and has become widely circulated. It is often associated with definitions such as “meaningless effort,” “malignant competition,” and “low-level repetition.” Involution pervades all stages of life, requiring workers to unintentionally “involve” themselves in different roles throughout life. As parents, they strive to ensure their children “win at the starting line”; as employees, they release high levels of productivity to compete for resource allocation. According to frequency analysis and social semantic network studies, involution is more commonly represented as negative psychological consequences, with failure and pressure being the most frequently associated emotional words [27]. Moreover, the fast-paced, highly competitive modern society compresses the daily life of workers, blurring the boundaries between work and life. This leads people to make more rational trade-offs regarding emotional investment and fertility choices, making them reluctant to enter intimate relationships and tending toward not having children or delaying childbirth [28]. Workplace involution makes some residents of childbearing age feel great psychological pressure, reducing their life satisfaction, and they project this sense of involution onto various aspects of life, such as academic pursuits. When this feeling reaches a certain point, in order to prevent their offspring from becoming involved in this vicious cycle of competition, they directly choose to reduce fertility behavior [8].
4. Analysis of typical facts regarding workplace involution and residents’ fertility intentions
4.1. Typical facts of workplace involution
Existing research has shown that the current state of workplace involution in China exhibits three typical characteristics: First, the distortion of the educational signal caused by the alienation of job competition and the inflation of educational thresholds, leading to an increase in the rate of professional mismatch and structural waste of human capital. Second, the normalization of overtime work has led to a continuous upward shift in the threshold of work intensity, with employees’ average weekly working hours generally exceeding 54 hours, resulting in stagnation in the development of professional skills. Third, the path dependence caused by the weakening of innovation momentum forces workers to choose low-level repetitive labor as a career survival strategy, caught between the lagging rate of knowledge updating and the accelerating pace of technological iteration. These characteristics collectively form an ecological dilemma in the workplace that is downward-compatible rather than upward-breaking.
Although existing research has revealed the superficial mechanisms of involution from the perspective of organizational behavior, there are still gaps in the following key areas: First, there is a lack of empirical support for the causal effect between the elevation of educational thresholds and the waste of human capital; second, the nonlinear impact of overtime work on the evolution of professional abilities has not been modeled quantitatively; and third, the regulatory role of institutional environment and market structure in the involution process remains to be validated. This paper constructs a three-dimensional analytical framework that incorporates individual heterogeneity, company characteristics, and policy variables, integrating micro-level labor market survey data and employer decision-making data, and uses dynamic panel models and structural equation models to reveal the interactive mechanisms of involution in various dimensions. In particular, a quasi-natural experiment is constructed to evaluate the effects of the “Double Reduction Policy” through the difference-in-differences method, quantifying the marginal effects of policy intervention and providing a new research path for the systemic governance of workplace involution.
4.1.1. Heterogeneity characteristics of workplace involution
This article comprehensively uses methods such as variance analysis, regression analysis, and kernel density curves to explore the heterogeneity characteristics and patterns of workplace involution across different regions, industries, occupations, and educational levels (seen as Figure 1 and Figure 2).
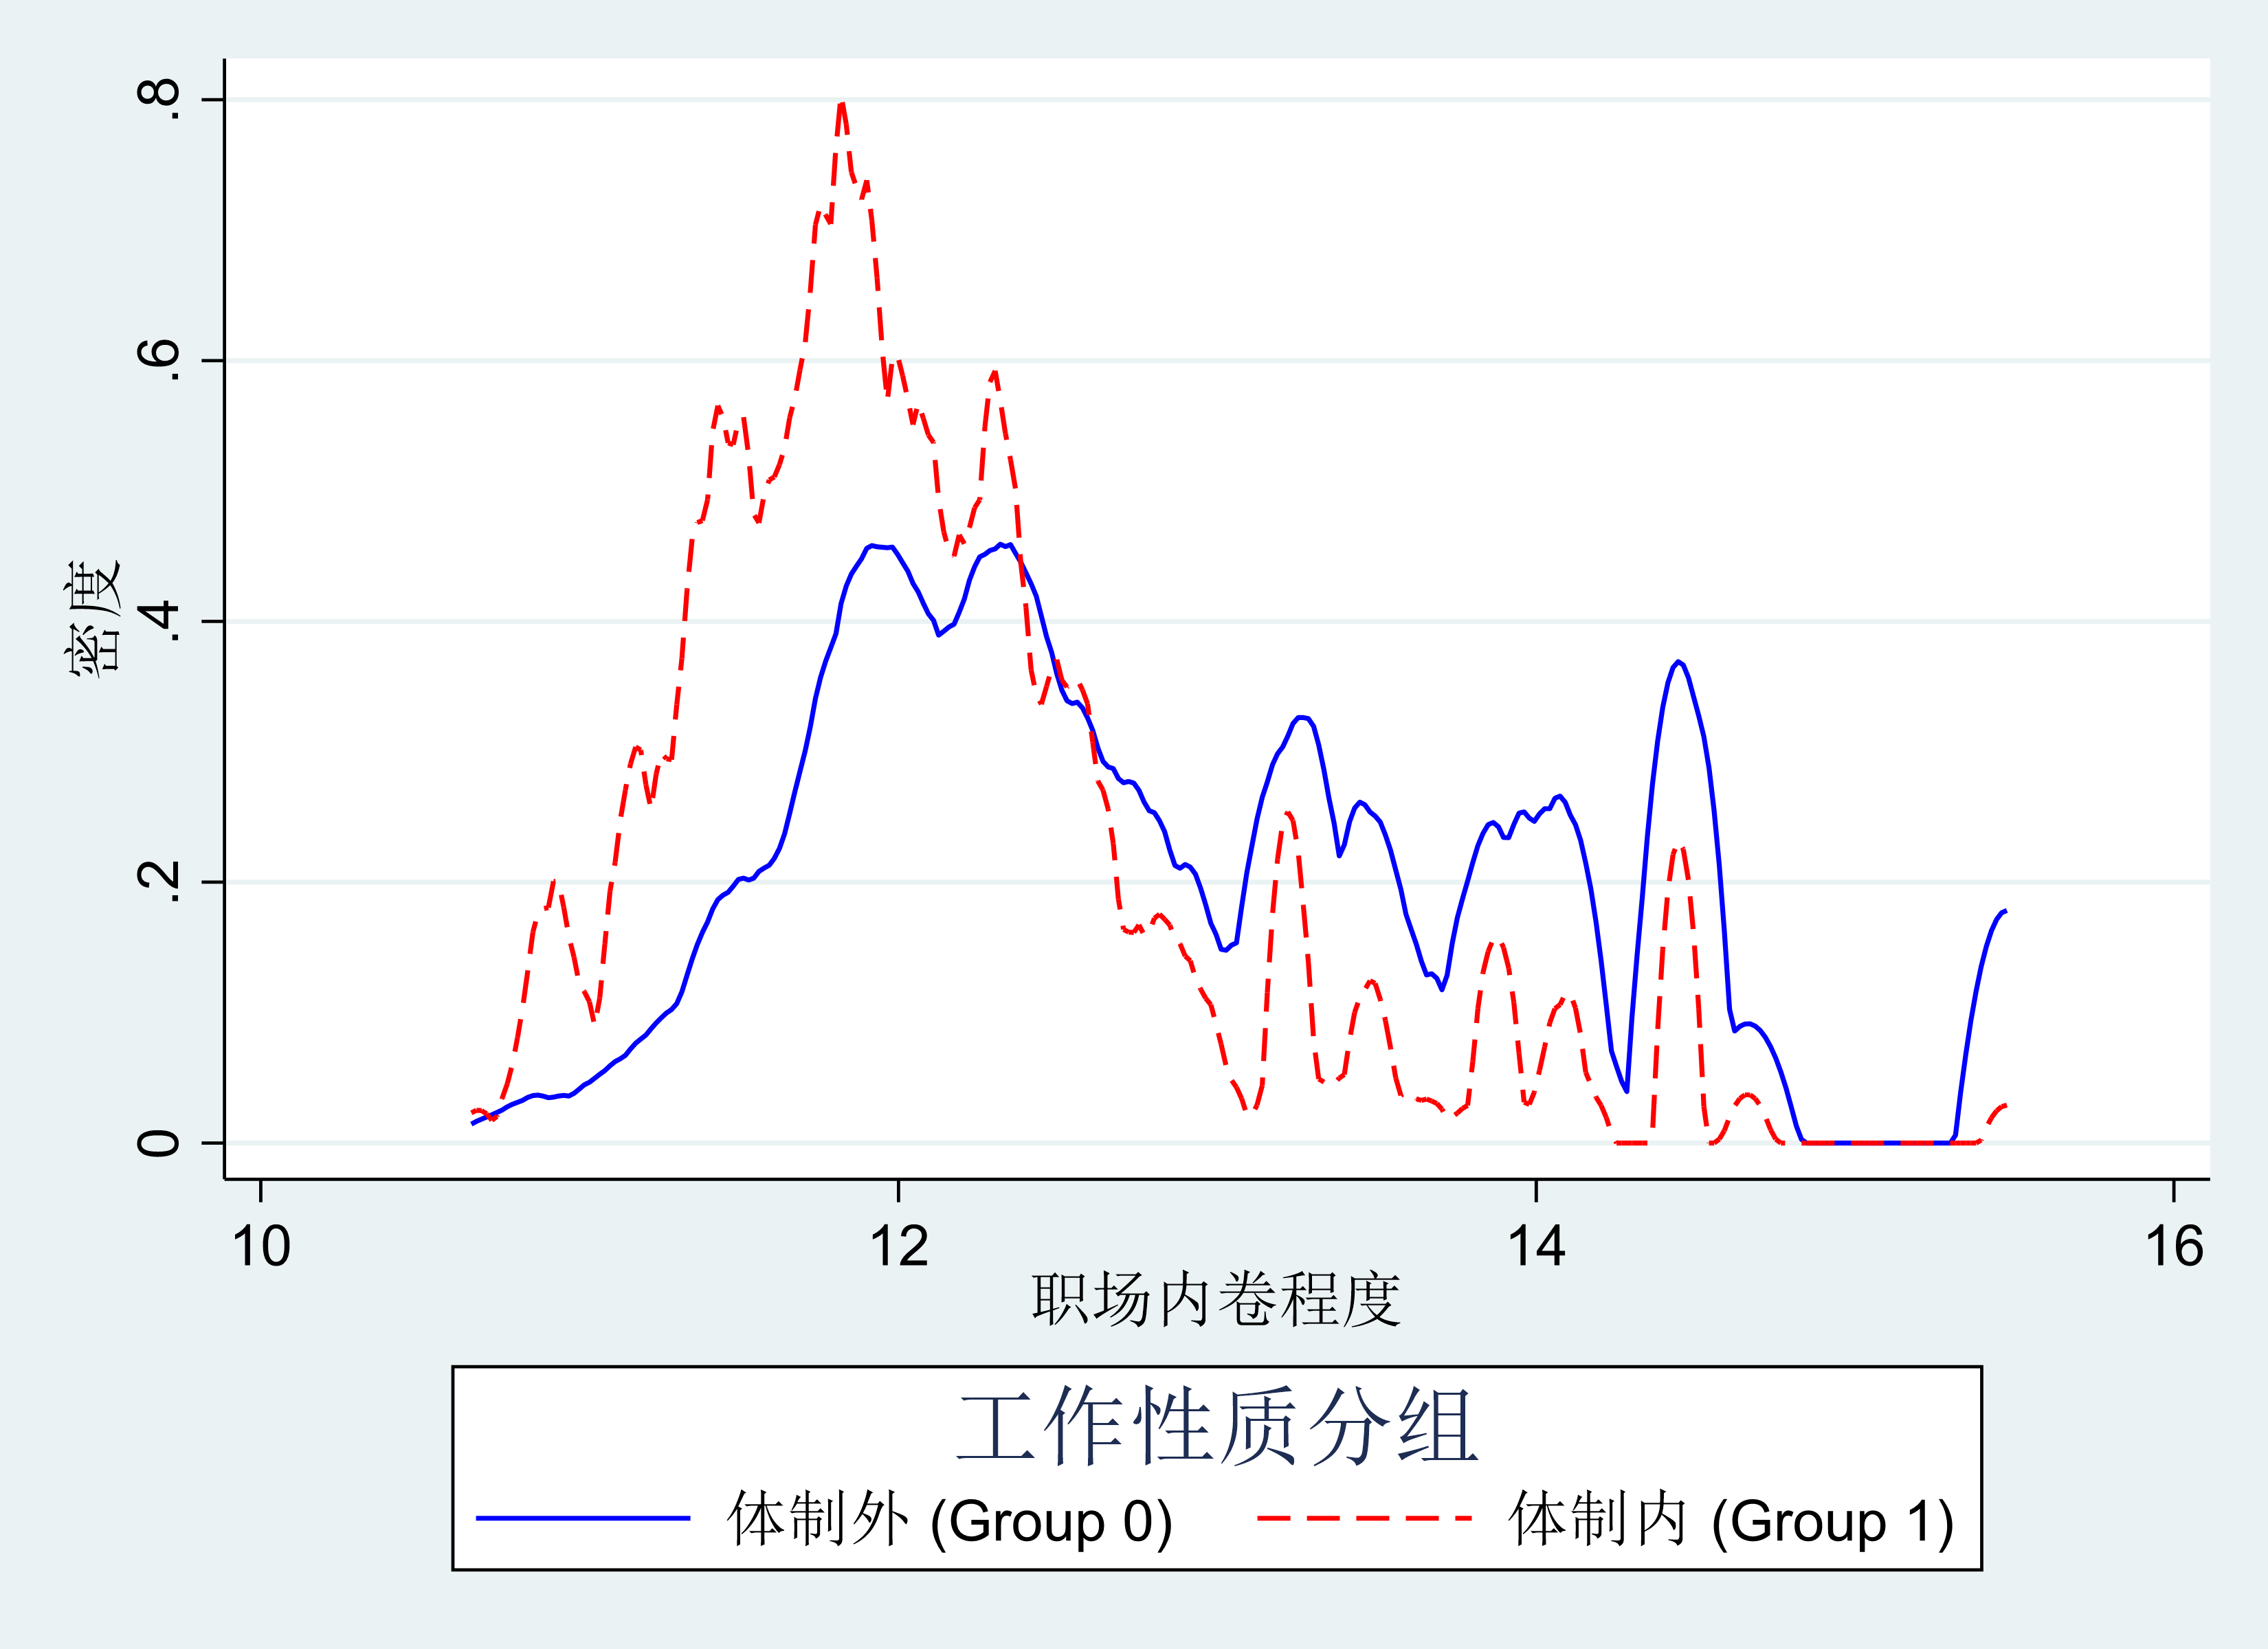
Note: The horizontal axis represents the degree of workplace involution, and the vertical axis represents the density; the blue line represents the non-institutional group (Group 0), and the red line represents the institutional group (Group 1).
Figure 1. Kernel density curve of workplace involution by job type
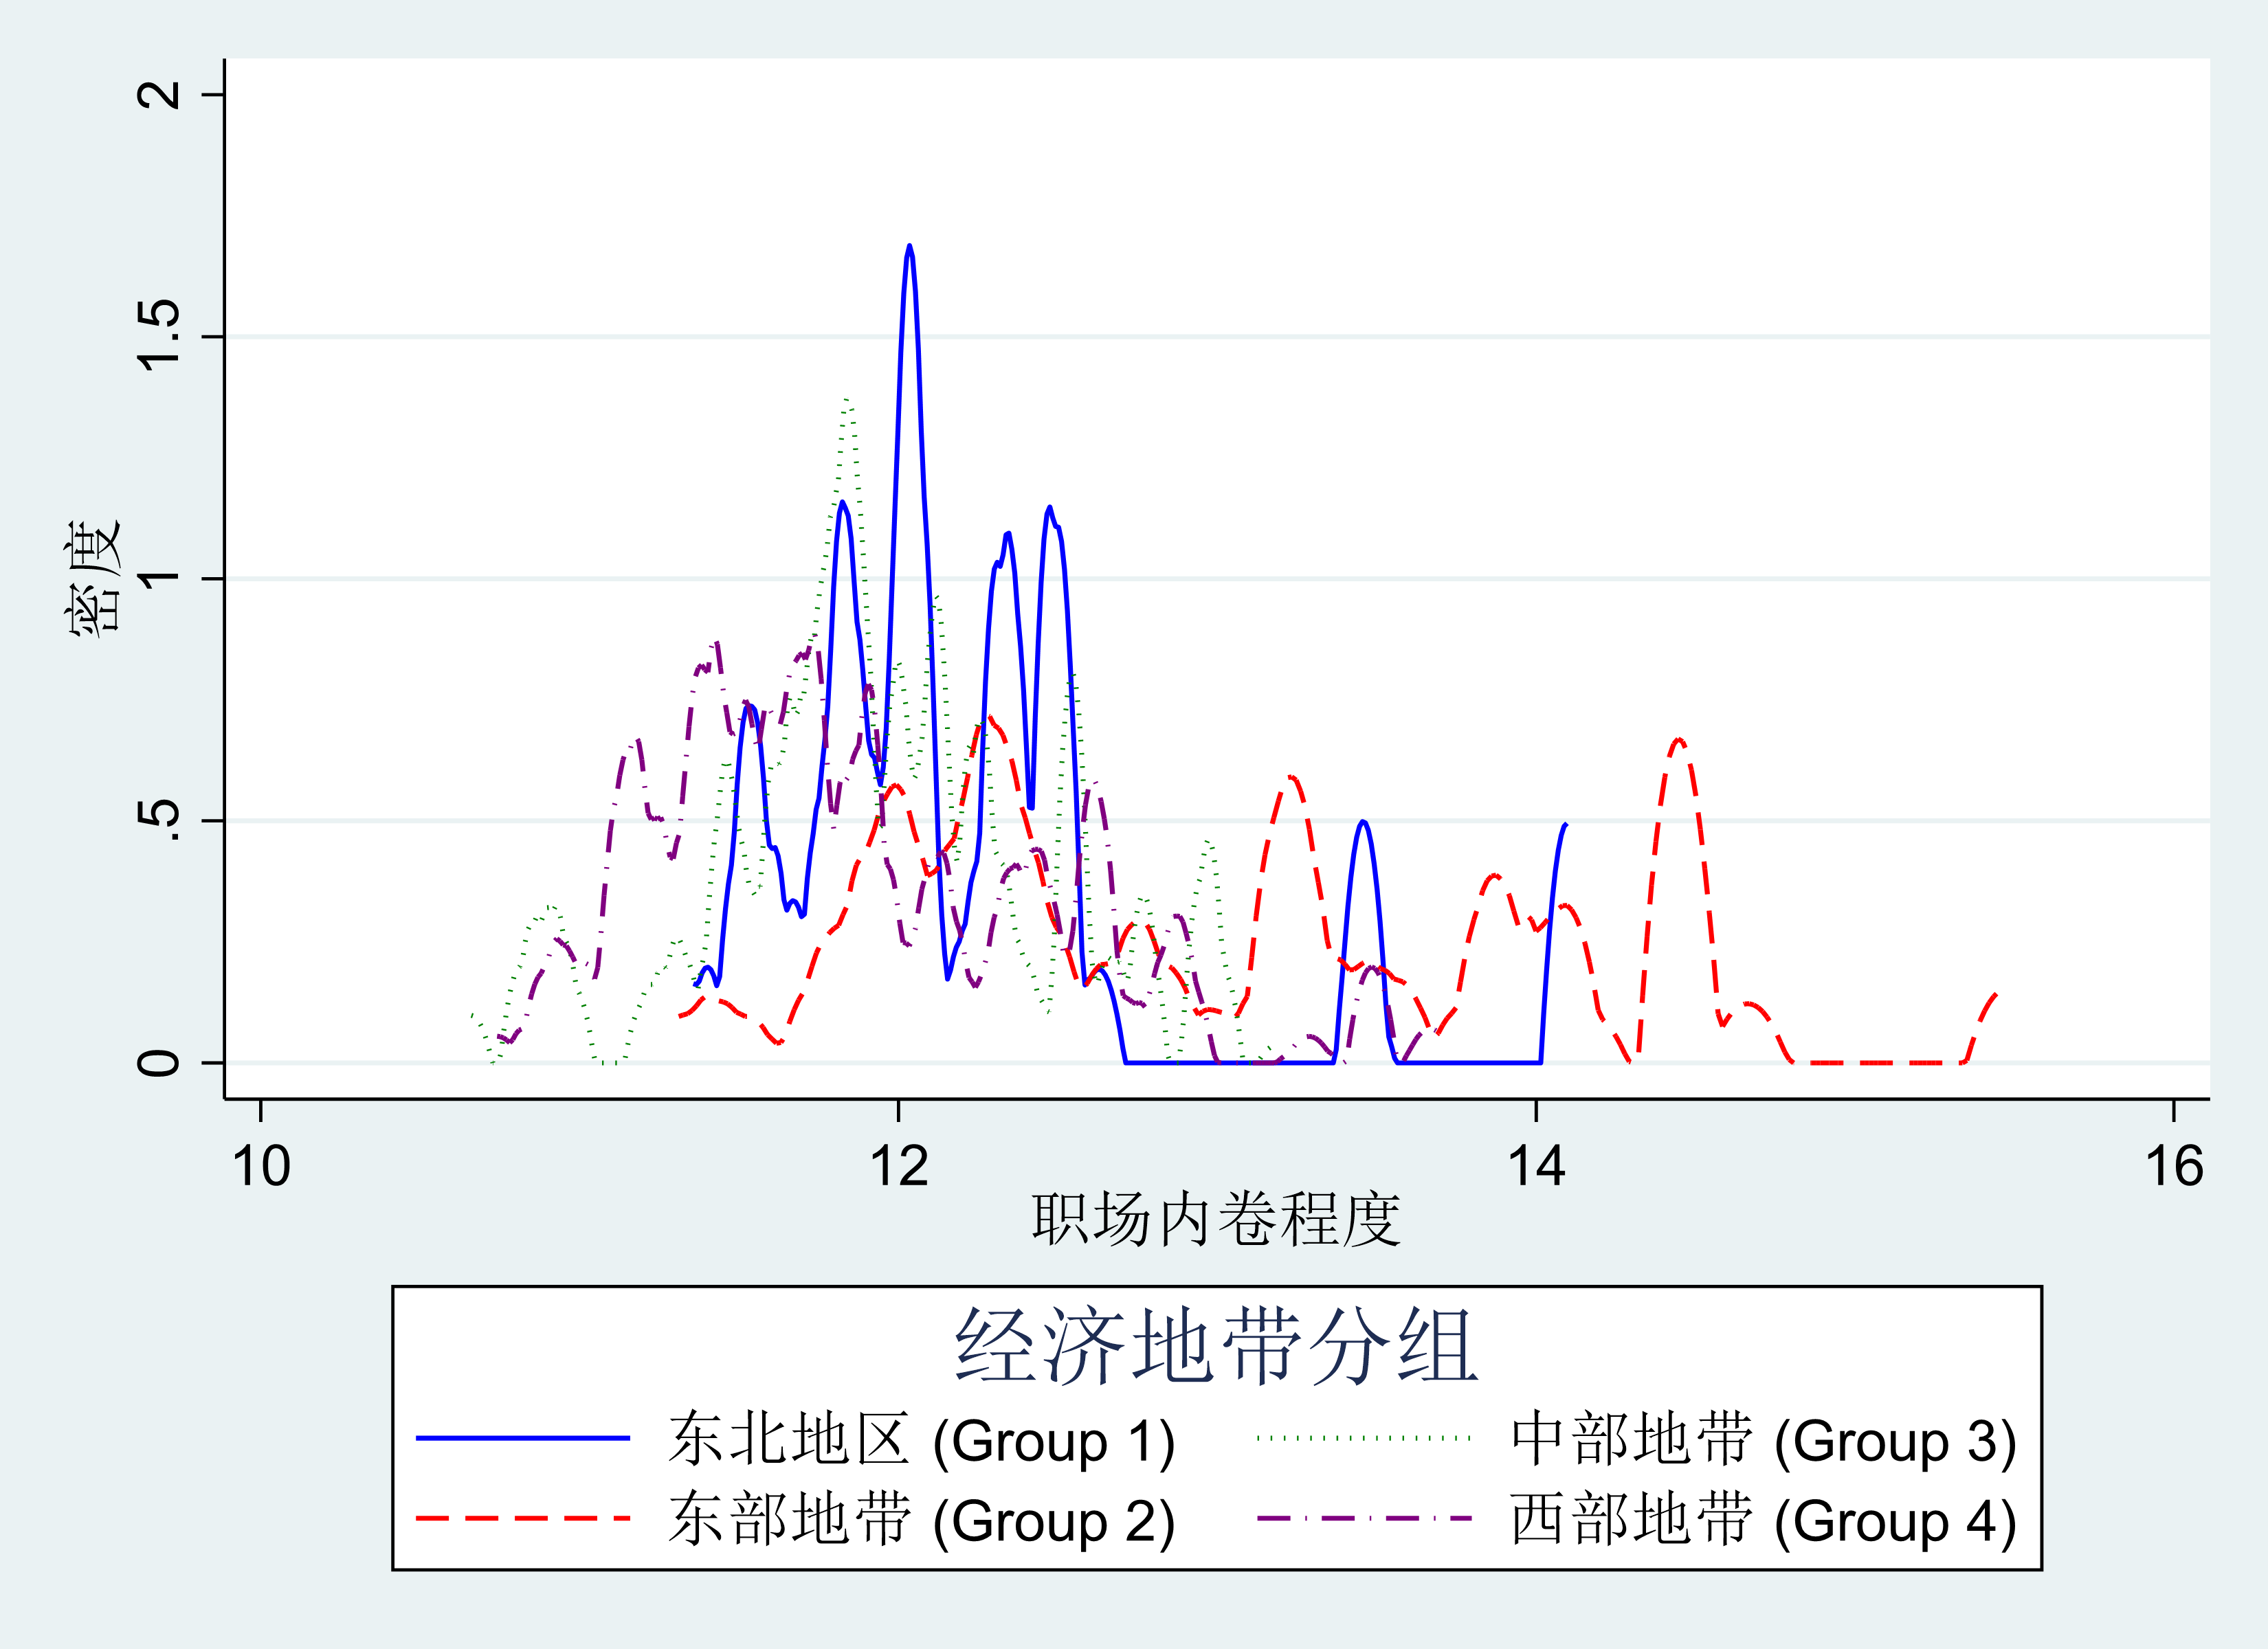
Note: The horizontal axis represents the degree of workplace involution, and the vertical axis represents the density; the blue line represents the Northeast region (Group 1), the red line represents the Eastern region (Group 2), the green line represents the Central region (Group 3), and the purple line represents the Western region (Group 4).
Figure 2. Kernel density curve of workplace involution by economic region
4.2. Typical fact analysis of fertility policies and fertility willingness of residents
The history of China’s family planning policy can be roughly divided into four stages: preliminary preparation (1955-1979), official implementation (1979-2015), and adjustment and improvement (2016-present) (seen as Figure 3). This paper adopts text analysis and literature research methods to systematically review the historical changes, adjustments, and the background of China’s fertility policies, as well as their impact on fertility rates. It was found that China has continuously adjusted its fertility policies based on the population situation, which has had some influence on residents’ fertility willingness, though not significantly, indicating that fertility rates are not singular and are mainly influenced by national policies.
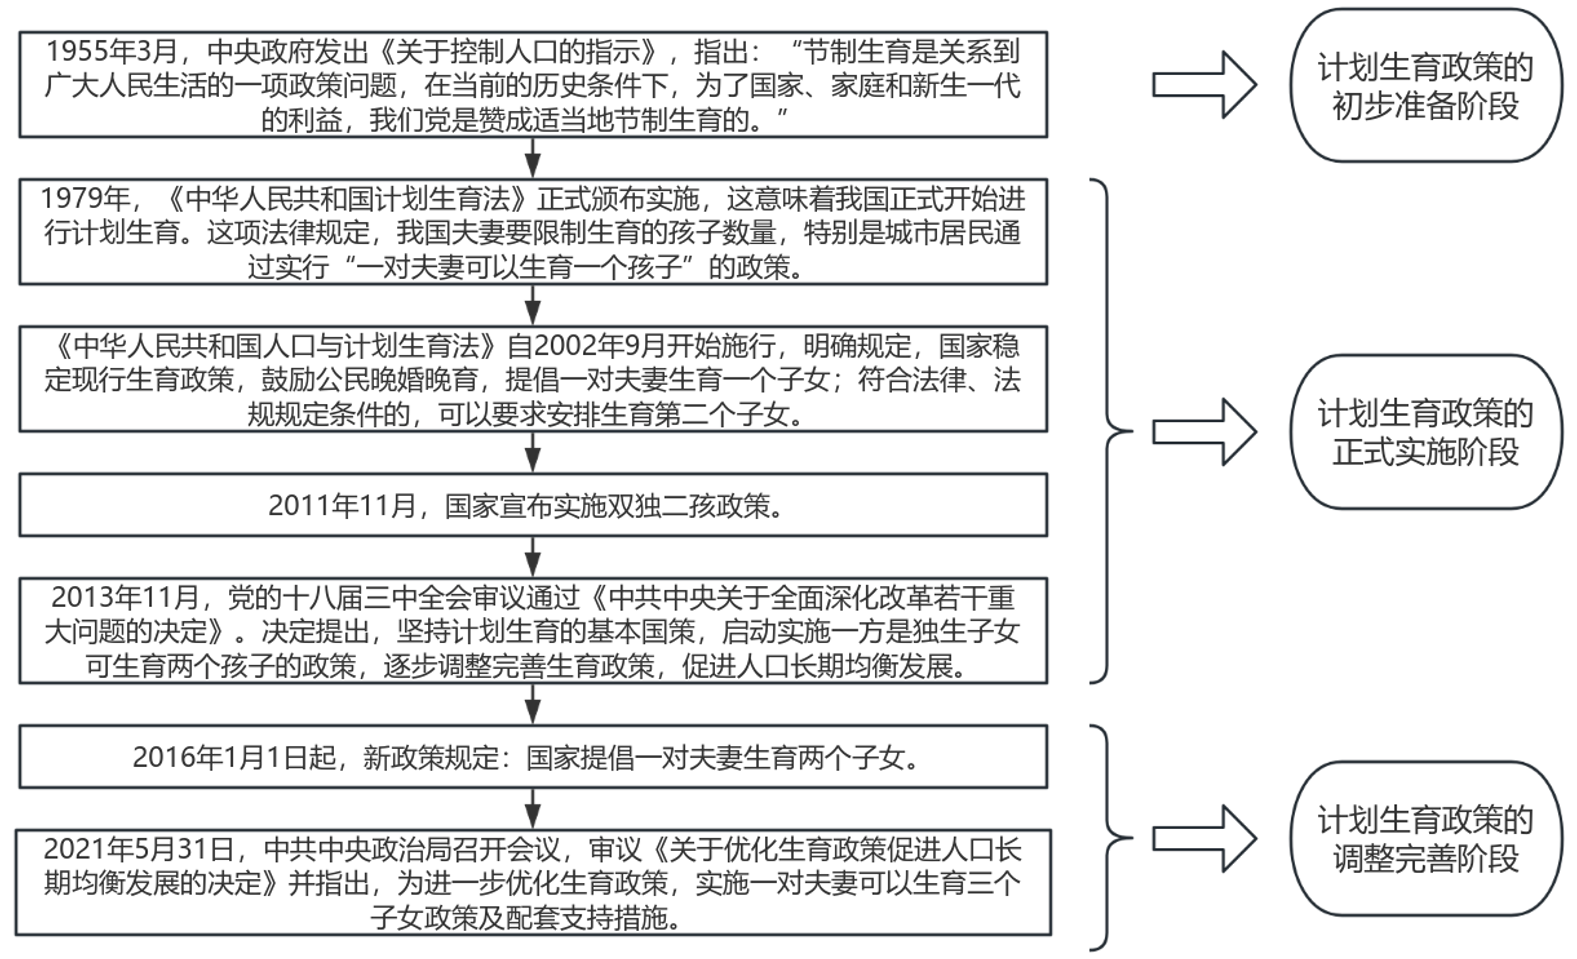
Figure 3. Development flowchart of family planning policies
In the Figure 3, separate parts mean as follow:
Initial Preparation Phase:
March 1955: The Central Government issued the “Directive on Controlling Population,” stating: “Controlling birth is a policy issue related to the livelihood of the people. Under the current historical conditions, for the benefit of the country, family, and the new generation, our party supports the appropriate control of birth.”
Formal Implementation Phase:
1979: The “Family Planning Law of the People’s Republic of China” was officially implemented, marking the official start of family planning in our country. This legal provision limited the number of children couples could have, especially urban residents, to implement the policy that “a couple could have one child.”
The “Law of the People’s Republic of China on Population and Family Planning” was implemented from September 2002, which clearly stipulated that the state would stabilize the current fertility policy, encourage late marriage and childbirth, and suggest that a couple could have one child; under conditions permitted by law and regulations, they could request to have a second child.
November 2011: The state announced the implementation of the two-child policy.
November 2013: The decision was made at the Third Plenary Session of the 18th Central Committee of the Communist Party of China to adhere to the basic national policy of family planning, to start implementing the policy that allows one couple to have two children, to gradually improve and perfect the fertility policy, and to promote long-term balanced population development.
Adjustment and Improvement Phase:
From January 1, 2016, the new policy stipulated that the state encourages a couple to have two children.
May 31, 2021: The Central Political Bureau of the Communist Party of China held a meeting to review the “Decision on Further Improving the Fertility Policy to Promote Long-term Balanced Population Development.” It was pointed out that to further improve the fertility policy, the implementation of policies allowing a couple to have three children and a series of supporting measures would be carried out.This paper uses relevant statistical analysis methods, based on high-quality micro-survey data such as the China General Social Survey (CGSS) and the national population census, to analyze the dynamic trends of fertility rates among women of childbearing age across the country, including the first-child fertility rate, second-child fertility rate, and the fertility rate of three or more children.
Note: Orange represents the total population (in ten thousand), while blue represents the growth rate (‰).
Figure 4. Total population and natural growth rate of China (2019-2023)
According to data analysis as shown in Figure 4, the rise and fall of the national fertility rate show certain regularities. In 2017, there was a small peak in the national fertility rate, which coincided with a peak in the second-child fertility rate. This is closely related to the implementation of the “Two-Child Policy” in 2016. Although the relaxation of fertility policies stimulated a short-term rebound in fertility rates, the long-term downward trend in fertility rates has not changed (seen as Figure 5).
Note: Blue represents the national fertility rate (‰), orange represents the first-child fertility rate (‰), gray represents the second-child fertility rate (‰), and yellow represents the fertility rate for three or more children (‰).
Figure 5. Trend of fertility rate among women of childbearing age nationwide
5. Empirical analysis
5.1. Data and variables
The data used in this paper comes from the 2005 National Population Sampling Survey Database of the National Bureau of Statistics. The empirical analysis process includes the following variable processing steps. The dependent variable is “number of children born” from the questionnaire, used as a proxy for fertility willingness. By excluding extreme observations in the 5-18 range, the number of children born in the valid sample is normalized to a continuous variable within the [0, 4] range. This processing method aligns with the standard practice for quantifying fertility behavior in demographic research. The core independent variable focuses on the “monthly income status” from the questionnaire. The natural logarithm and standard deviation of the average income are calculated to construct the wage dispersion index (lnwage_var). This measurement is based on labor market segmentation theory and effectively captures the heterogeneity of income distribution, providing a quantitative basis for analyzing workplace competition intensity.
The control variables system integrates demographic characteristics and socioeconomic factors. The respondent’s year of birth is converted to age at the time of the survey, and the sample is limited to individuals aged 20-45 according to the fertility active period theory. Ethnicity and household registration location are categorized. The household registration type is converted into a binary dummy variable (Agricultural = 0, Non-agricultural = 1). Educational level, industry category, and occupation type are also included as variables reflecting human capital and occupational characteristics. Data processing was completed using Stata 17.0 software, employing multiple imputation for handling missing values and standardizing continuous variables to eliminate unit differences. The final dataset contains valid observation values.
Table 1. Variable description
Variable Type | Variable Name | Variable Meaning |
Core Independent Variable | lnwage_var | County-level average wage variance (i.e., dispersion) |
Dependent Variable | ceb | Number of children born |
Control Variables | age_05 | Age |
ethnic | Ethnicity | |
place | Household registration location | |
registration | Household registration type | |
edu | Educational level | |
industry | Industry | |
job | Occupation |
In the data preprocessing stage, a systematic data cleaning process was adopted: First, exclusion criteria were set based on questionnaire response quality, and invalid data with identical responses for all items, logical contradictions, and extreme values were removed. Then, a missing value processing rule was established, and data with systematic non-response (e.g., continuous “Don’t know” or “Refuse to answer”) were excluded. Based on the fertility cycle characteristics of the study population, the sample frame was limited to individuals aged 20-45, and duplicate samples were detected and removed using unique identifiers. After the above data cleaning, the final valid sample contained 378,323 observations. Descriptive statistical summaries of the related variables are shown in Table 2.
Table 2. Descriptive statistical summary of key variables
Variable | Obs | Mean | Std. dev. | Min | Max |
ceb | 378,323 | 1.554 | 0.841 | 0 | 4 |
lnwage_var | 378,323 | 12.351 | 0.957 | 10.660 | 15.476 |
age_05 | 378,323 | 34.601 | 6.213 | 20 | 45 |
ethnic | 378,323 | 2.042 | 4.162 | 1 | 98 |
place | 378,323 | 1.251 | 0.625 | 1 | 3 |
registration | 378,323 | 0.246 | 0.430 | 0 | 1 |
edu | 378,323 | 2.899 | 1.060 | 1 | 7 |
industry | 378,323 | 23.778 | 31.146 | 1 | 98 |
job | 378,323 | 49.659 | 16.298 | 0 | 99 |
5.2. Model specification
Based on the theoretical analysis in the previous section, this paper primarily explores the impact of workplace involution on residents’ fertility willingness. Therefore, the econometric model is specified as equation (1):
\( \begin{array}{c} lnwagevar={β_{0}}+{β_{1}}ceb+{β_{2}}ag{e_{0}}5+{β_{3}}ethnic+{β_{4}}registration+{β_{5}}place \\ +{β_{6}}edu+{β_{7}}industry+{β_{8}}job \end{array} \) (1)
In this paper, “number of children born” is used to represent residents’ fertility willingness, and thus the dependent variable is a numerical variable, limited within the range of 0-4. The county-level average wage variance (i.e., dispersion) is used as a proxy for workplace involution. Therefore, an ordered logit (ologit) model is employed for baseline regression analysis. The definitions of other variables are provided in Table 1.
5.3. Baseline Regression Analysis
Table 3. Ologit baseline regression results
Variable | (1) | (2) | (3) | (4) | (5) | (6) | (7) | (8) |
Workplace Involution | -0.485*** | -0.562*** | -0.544*** | -0.536*** | -0.385*** | -0.335*** | -0.319*** | -0.307*** |
(-144.004) | (-159.719) | (-153.771) | (-139.822) | (-96.738) | (-83.340) | (-78.917) | (-74.961) | |
Age | 0.167*** | 0.169*** | 0.168*** | 0.189*** | 0.186*** | 0.186*** | 0.186*** | |
(280.401) | (282.449) | (279.760) | (297.524) | (289.264) | (289.606) | (289.417) | ||
Ethnicity | 0.038*** | 0.038*** | 0.032*** | 0.022*** | 0.022*** | 0.021*** | ||
(48.534) | (48.536) | (40.478) | (27.873) | (27.678) | (26.832) | |||
Household Registration Location | -0.032*** | -0.062*** | -0.059*** | -0.014** | -0.001 | |||
(-5.446) | (-10.405) | (-9.798) | (-2.169) | (-0.206) | ||||
Household Registration Type | -2.058*** | -1.387*** | -1.233*** | -1.239*** | ||||
(-229.944) | (-132.346) | (-105.876) | (-106.286) | |||||
Educational Level | -0.496*** | -0.466*** | -0.479*** | |||||
(-117.685) | (-107.497) | (-109.077) | ||||||
Industry | -0.005*** | -0.005*** | ||||||
(-29.874) | (-32.937) | |||||||
Occupation | -0.004*** | |||||||
(-18.619) | ||||||||
Pseudo R2 | 0.2089 | |||||||
Sample Size | 378,323 |
Note: * , ** , *** indicate significance at the 10%, 5%, and 1% levels, respectively. Z statistics are in parentheses.
In the baseline regression analysis (as shown in Table 3), the dependent variable and core independent variable are first subjected to an ologit regression. Subsequently, the control variables are added one by one, and the results are presented in Table 3. Based on the results of the baseline regression analysis, it is found that in the regression results with all control variables included, all explanatory variables, except for the “place” (household registration location) variable, show statistical significance at the 1% level. Specifically, age (age_05, β=0.186) and ethnicity (ethnic) variables exhibit a positive predictive effect, with the standardized regression coefficient for age being the largest, indicating a clear age cumulative effect on individual fertility willingness.
In terms of negative effects, variables such as the natural logarithm of wage (lnwage_var), household registration type (registration), education level (edu), industry (industry), and occupation (job) all exhibit significant suppressive effects. Notably, the regression coefficient for household registration type (β=-1.239) demonstrates a strong explanatory power. This suppressive effect may stem from higher childcare costs, career development demands, and educational competition pressures associated with urban household registration. This finding suggests that the social security disparities arising from the household registration system may pose important constraints on fertility decisions.
The “place” (household registration location) variable, however, does not significantly affect fertility, as its confidence interval includes zero, indicating that regional administrative divisions are not a core influencing factor for fertility willingness. Although the absolute values of the coefficients for other variables are relatively small, their statistical significance still reveals the complex, multidimensional social features that influence fertility decisions.
5.4. Endogeneity Test
Considering the complexity of the issue of workplace involution, the econometric model may suffer from endogeneity issues such as omitted variables, bidirectional causality, and measurement errors, which could lead to inconsistent parameter estimates. To effectively address these issues, this paper adopts a method from existing related literature by using the moving share method to construct Bartik instrumental variables. The growth rate of the monthly wage variance in the previous period is calculated and then multiplied by the wage variance in the previous period to obtain the predicted value of the monthly wage variance. Two-stage least squares estimation is then applied to identify the causal effect of workplace involution on residents’ fertility intentions as reasonably as possible. The specific calculation formula is as equation (2):
\( P\_lnwage\_var=\frac{\sum _{j}^{n}{lnwage\_var_{i}}/n}{\sum _{j}^{n}{lnwage\_var_{i-1}}/n}×{lnwage\_var_{i}} \) (2)
Here, \( \sum _{j}^{n}{lnwage\_var_{i}}/n \) and \( \sum _{j}^{n}{lnwage\_var_{i-1}}/n \) represent the average monthly wage variance of j individuals, excluding the i−th and (i−1)−th individuals. The ratio of the two represents the national growth rate of monthly wage variance for that year; \( {lnwage\_var_{i}} \) represents the monthly wage variance of the i-th individual. The Bartik instrument is predicted by the growth rate of the average monthly wage variance, thus satisfying the exogeneity requirement. Moreover, since the formula includes the lagged value of the monthly wage variance, it also satisfies the relevance requirement.
Instrumental variable two-stage least squares regression results are shown in Table 4. As can be seen, in the first-stage regression, the instrumental variable is significantly negatively correlated with the local (county-level) average wage variance and exhibits strong significance. The second-stage regression results show that the regression coefficient of the core explanatory variable is significantly negative at the 5% statistical level, indicating that even after considering potential endogeneity issues, the baseline regression results remain valid, once again confirming the conclusion that workplace involution negatively impacts fertility intentions.
Table 4. Bartik Instrumental Variable Regression
First Stage | Second Stage | |
Local (County-Level) Average Wage Variance | Fertility Intentions | |
(1) | (2) | |
Local (County-Level) Average Wage Variance | 0.0696*** (-28.44) | |
lnIV | -15.3767*** (-396.39) | |
Age | 0.0069*** (37.48) | 0.0580*** (322.48) |
Ethnicity | -0.0130*** (-47.39) | 0.0078*** (29.14) |
Household Registration Location | 0.2466*** (120.18) | -0.0086*** (-3.82) |
Household Registration Type | 0.0086** (2.27) | -0.3577*** (-97.71) |
Education Level | 0.0825*** (56.88) | -0.1507*** (-104.95) |
Industry | 0.0049*** (93.67) | -0.0019*** (-36.19) |
Occupation | 0.0084*** (111.06) | -0.0020*** (-26.86) |
Constant | 210.9071*** (416.90) | 1.4317*** (52.80) |
Sample Size | 378323 | 378323 |
R2 | 0.481 | 0.367 |
Note: * **, *** represent significance at the 10%, 5%, and 1% levels, respectively. The values in parentheses represent the t-values for the first stage and the z-values for the second stage.
6. Robustness check and heterogeneity analysis
6.1. Robustness check
6.1.1. Adding control variables method
To further verify the accuracy of the results, this paper adds three control variables—health status, employment status, and primary source of income—during the robustness check, and runs the same regression as in the previous section. The results are shown in Table 5. It can be observed that after adding the control variables, the core explanatory variable and the dependent variable still show a negative correlation, and the significance of each variable remains strong. The overall regression model’s F-test is significant, consistent with the previous conclusion.
Table 5. Multiple linear regression results
ols | |
Workplace Involution | -0.07*** |
(0.00) | |
Age | 0.04*** |
(0.00) | |
Ethnicity | 0.01*** |
(0.00) | |
Household Registration Location | 0.01*** |
(0.00) | |
Household Registration Type | -0.32*** |
(0.00) | |
Education Level | -0.11*** |
(0.00) | |
Industry | -0.00*** |
(0.00) | |
Occupation | -0.00** |
(0.00) | |
Health Status | -0.08*** |
(0.01) | |
Employment Status | 0.07*** |
(0.00) | |
Primary Source of Income | -0.01*** |
(0.00) | |
Constant | 1.16*** |
(0.03) | |
Sample Size | 167053 |
R2 | 0.326 |
Note: * **, *** represent significance at the 10%, 5%, and 1% levels, respectively; numbers in parentheses represent standard errors.
6.1.2. Changing estimation methods
Considering that the dependent variable “number of children ever given birth” is a count variable, after removing outliers, the model was analyzed using multiple linear regression, logistic regression, and probit regression. The results are shown in Table 6.
Table 6. Robustness Check Results
Multiple Linear Regression | Logistic Regression | Probit Regression | |
Workplace Involution | -0.0952*** | -0.083*** | -0.038*** |
(0.00) | (-9.626) | (-8.378) | |
Age | 0.0582*** | 0.270*** | 0.123*** |
(0.00) | (157.623) | (159.290) | |
Ethnicity | 0.0074*** | -0.002 | -0.002** |
(0.00) | (-1.132) | (-2.194) | |
Household Registration Location | 0.0044* | -0.259*** | -0.143*** |
(0.00) | (-22.967) | (-23.914) | |
Household Registration Type | -0.3564*** | -0.517*** | -0.263*** |
(0.00) | (-21.267) | (-21.086) | |
Education Level | -0.1475*** | -0.372*** | -0.168*** |
(0.00) | (-37.837) | (-33.740) | |
Industry | -0.0018*** | 0.000 | 0.000 |
(0.00) | (0.106) | (0.494) | |
Occupation | -0.0018*** | 0.005*** | 0.003*** |
(0.00) | (9.783) | (10.638) | |
Constant | 1.3415*** | -2.963*** | -1.124*** |
(0.02) | (-27.158) | (-20.034) | |
Sample Size | 378323 | 378,323 | 378,323 |
R2 | 0.368 | 0.2832 | 0.2708 |
Note: * **, *** represent significance at the 10%, 5%, and 1% levels, respectively; numbers in parentheses represent standard errors / Z statistics / z statistics.
The empirical results from the multiple linear regression model show that all explanatory variables are statistically significant at the 1% level (p < 0.01). Age, ethnicity, and household registration location have a positive predictive effect, while the logarithm of wages, household registration type, education level, industry, and occupation have significant inhibitory effects. The positive effect of the age variable indicates that for every additional year of age, the willingness to give birth increases by approximately 5.82%, which confirms the positive association between physiological maturity and resource accumulation in fertility decision-making. The negative coefficient of household registration type reveals the structural influence of the household registration system. The negative elasticity of education level confirms the substitution effect between human capital accumulation and fertility behavior. For every additional year of education, the willingness to give birth decreases by 14.75%. The inhibitory effect of wage variance reflects the constraint mechanism of economic uncertainty on fertility plans. For every 1 standard deviation increase in county-level income dispersion, the willingness to give birth decreases by 9.52%, which aligns with the propositions in this paper.
In the logistic regression, workplace involution as the core explanatory variable shows significant results, meaning that at the 5% significance level, holding other variables constant, wage dispersion has a significant negative effect on fertility willingness.
Overall, the results pass the F-test, and the regression models are significant. The coefficients of workplace involution in the multiple linear regression, logistic regression, and probit regression are -0.0952, -0.083, and -0.038, respectively, indicating that per capita wage variance indeed has a negative effect on fertility willingness, consistent with the previous conclusion.
6.2. Heterogeneity analysis
6.2.1. Grouped by the four economic regions
This study conducts regression analysis by grouping the data into four economic regions: Northeast, Eastern, Central, and Western regions. These regions exhibit significant differences in economic development, social-cultural backgrounds, population structure, and family characteristics. By performing grouped regressions, the heterogeneous characteristics of fertility intentions across these regions can be more accurately revealed.
Table 7. Regression results by economic region
Variable | Northeast Region (Group 1) | Eastern Region (Group 2) | Central Region (Group 3) | Western Region (Group 4) |
Workplace Involution | -0.214*** (0.021) | -0.294 (0.007)*** | -0.021 (0.015) | -0.015 (0.011) |
Age | 0.207 (0.001)*** | 0.252 (0.001)*** | 0.206 (0.001)*** | 0.194 (0.001)*** |
Ethnicity | -0.009 (0.004)* | 0.018 (0.003)*** | -0.006 (0.004) | 0.015 (0.001)*** |
Household Registration Location | 0.030 (0.027) | -0.220 (0.009)*** | 0.033 (0.021) | 0.061 (0.016)*** |
Household Registration Type | 0.016 (0.037) | -0.017 (0.016) | 0.142 (0.024)*** | 0.201 (0.019)*** |
Education Level | 0.037 (0.018)* | -0.134 (0.008)*** | 0.056 (0.010)*** | -0.102 (0.008)*** |
Industry | -0.007 (0.001)*** | -0.003 (0.000)*** | -0.011 (0.000)*** | -0.012 (0.000)*** |
Occupation | -0.003 (0.001)* | -0.002 (0.000)*** | -0.004 (0.001)*** | -0.001 (0.001) |
Constant | -4.607 (0.259)*** | -4.592 (0.092)*** | -6.741 (0.182)*** | -6.083 (0.127)*** |
R2 | 0.4124 | 0.4992 | 0.4479 | 0.4129 |
Sample Size | 40476 | 246799 | 121806 | 208523 |
Note: * **, *** represent significance at the 10%, 5%, and 1% levels, respectively; numbers in parentheses represent standard deviations.
This study uses regression analysis to systematically examine the spatial heterogeneity of fertility intentions across geographical regions (Northeast, Eastern, Central, and Western). The empirical results show that the regression coefficients for the four regional models pass the 1% significance level test (p<0.01), indicating that the models have good explanatory power and are capable of capturing regional differences.
The results of the regional regressions indicate that the effect of income dispersion on fertility intentions exhibits significant regional heterogeneity (Table 7). In the Northeast region (Group 1), the income variance coefficient is -0.214 (p<0.01), indicating that income inequality significantly suppresses fertility decisions. The Eastern region (Group 2) shows the strongest negative effect (β = -0.294, p<0.01), which may be related to its higher economic development level and prominent income stratification: higher-income groups focus more on optimizing quality of life, while lower-income groups face more severe economic constraints. In contrast, in the Central and Western regions (Group 3 and Group 4), the income variance coefficients are not statistically significant (β = -0.021 and -0.015, p>0.1), likely due to the more balanced income distribution in these regions resulting from regional economic structure differences.
Regarding control variables, age significantly and positively affects fertility intentions in all regions (β = 0.194 - 0.252, p<0.001). The household registration variable shows regional differentiation: in the Eastern region, the location of household registration has a significant negative effect (β = -0.220, p<0.001), while the type of household registration in the Central region shows a positive association (β = 0.142, p<0.001). Ethnicity only shows a weak positive effect in the Western region (β = 0.015, p<0.001). These findings reveal that the impact mechanisms of demographic structure variables on fertility decisions exhibit spatial heterogeneity.
The suppressive effect of income dispersion on fertility numbers shows significant regional heterogeneity: in the Eastern region, each standard deviation increase in income inequality leads to a 0.294 unit decrease in fertility intentions (p<0.01). This may stem from the higher economic development level and income polarization in the Eastern region—higher-income groups actively delay childbearing due to rising opportunity costs, while lower-income groups reduce fertility due to economic constraints. In contrast, the coefficients for income dispersion in the Northeast, Central, and Western regions are -0.214, -0.021, and -0.015, respectively. This forms an explanatory loop with the relatively balanced income distribution in these regions, suggesting that the suppressive effect of income inequality on fertility decreases as the level of regional marketization declines.
Age positively and significantly affects fertility numbers across all four regions. As age increases, family economic conditions and life stability improve, thereby enhancing both fertility intentions and the ability to have children. Additionally, other control variables (such as ethnicity, household registration location, household registration type, education level, and industry) show different effects in different regions, indicating that cultural traditions, policy environments, and life stability may also influence fertility numbers across regions.
6.2.2. Classification based on job nature
Employment stability and job satisfaction constitute a dual institutional constraint mechanism for fertility decisions. Employment within the system offers institutional advantages in terms of job security, welfare coverage, and psychological safety perception, whereas external employment groups face systemic risks such as short-term employment relationships, fragmented social security, and income volatility. These differences directly affect workers’ fertility intentions and family planning. By distinguishing the characteristics of employment within and outside the system, a more comprehensive understanding of the formation mechanism of fertility intentions can be gained, allowing for more targeted policy recommendations. Therefore, this paper simplifies the classification of employment units into two major categories: employment within the system and employment outside the system. Specifically, employment within the system includes party and government agencies, people’s organizations, the military, state-owned/collective public institutions, state-owned enterprises, and state-controlled enterprises. Employment units that do not belong to these categories are classified as external employment.
Table 8. Regression Results Based on Job Nature Classification
Variable | Employment Within the System (Group 0) | Employment Outside the System (Group 1) |
Workplace Involution | -0.265 (0.008)*** | -0.210 (0.005)*** |
Age | 0.320 (0.001)*** | 0.185 (0.000)*** |
Ethnicity | -0.006 (0.003)* | 0.019 (0.001)*** |
Household Registration Location | 0.001 (0.010) | 0.009 (0.011) |
Household Registration Type | 0.014 (0.018) | -0.012 (0.014) |
Education Level | -0.253 (0.010)*** | -0.071 (0.005)*** |
Industry | -0.002 (0.000)*** | -0.007 (0.000)*** |
Occupation | -0.000 (0.000) | 0.000 (0.000) |
Constant | -7.387 (0.111)*** | -3.378 (0.065)*** |
R2 | 0.5196 | 0.4068 |
Sample Size | 172,819 | 444,785 |
Note: * , ** , *** indicate significance at the 10%, 5%, and 1% levels, respectively. Standard deviations are provided in parentheses.
This study, based on the theory of labor market institutional segmentation, conducts a heterogeneity analysis of fertility intentions between employment groups within and outside the system. The empirical results show that both models pass the 1% significance level test (within the system: F=23365.09, p<0.001; outside the system: F=38119.19, p<0.001), and the overall model fit is good.
The regression results by employment type indicate that the intensity of workplace competition has a suppressive effect on fertility decisions, with departmental heterogeneity (Table 8). Employment within the system (Group 0) shows a stronger negative effect of wage dispersion (β=-0.265, p<0.001), which may be related to its higher job stability, making the opportunity cost of childbirth more sensitive. Employment outside the system (Group 1) also shows a significant effect (β=-0.210, p<0.001), but the effect size decreases by 23.4%, possibly reflecting the diminishing marginal impact of market competition pressure on fertility decisions.
The age variable shows a positive correlation in both sectors, but the effect is significantly stronger within the system (β=0.320 vs. 0.185, p<0.001). Demographic variables show selective effects: ethnicity has a weak positive moderation effect outside the system (β=0.019, p<0.001), while education level (β=0.127, p<0.01) and industry characteristics (β=0.085, p<0.05) are statistically significant only within the system. These differences may stem from the systemic differences in career development paths and social security levels between the two employment types.
Overall, both models, within and outside the system, show significant effects of wages and age on the number of children, but the specific coefficients and directions of influence differ. This may be related to the different work environments and economic incentive mechanisms in different types of employment.
7. Conclusion and policy recommendations
This paper uses the 2005 population sampling survey data from the National Bureau of Statistics to empirically analyze the impact of workplace involution on residents’ fertility intentions. First, logistic regression and multiple linear regression were conducted using the monthly per capita wage dispersion as a proxy for workplace involution and the number of children ever born as a proxy for fertility intention. The results show a negative relationship between workplace involution and residents’ fertility intentions, indicating that an increase in the degree of workplace involution can suppress fertility intentions to some extent. Subsequently, endogenous checks were performed through the construction of Bartik instrumental variables, and robustness tests were conducted through the addition of control variables and the use of different estimation methods. The main conclusions remain valid. In the heterogeneity analysis, the sample was grouped by region and job nature to explore the findings. It was found that the impact of wage dispersion on the number of children is most significant in the eastern regions; both public-sector and private-sector employment have a significant negative impact on the number of children, and as age increases, residents’ fertility intentions become stronger.
In summary, to alleviate the negative phenomenon of workplace involution in China and actively address the issue of low fertility, the paper proposes the following recommendations: (1) optimize the efficiency of the labor market by establishing a multidimensional performance evaluation system that includes skill premiums and occupational contributions, pilot a collective wage negotiation system in the manufacturing and service industries, revise and establish fertility-friendly salary benchmarks to ease the budget constraint effects on fertility decisions; (2) break down the institutional barriers in the labor market and address the differences in fertility opportunity costs caused by the division between public and private sectors, implement flexible working systems for civil servants and employees in public institutions, incorporate the use of parental leave into state-owned enterprises’ social responsibility assessment, and use tax levers to regulate fertility benefits in the private sector; (3) implement regionally differentiated fertility support, such as recognizing that fertility intentions in eastern regions are more sensitive to changes in wage dispersion. Pilot wage dispersion monitoring and early warning systems in these areas, while linking the allocation of affordable housing and the cost of raising children for multi-child families dynamically, to enhance the marginal improvement effect of fertility support policies; (4) build a full-cycle fertility incentive system, designing progressive fertility rewards based on career development stages. Provide professional skills training and childcare service exchanges for the 25-29 age group, implement deferred personal income tax reductions for the 30-34 age group, and use lifecycle compensation mechanisms to offset the fertility-inhibiting effects of workplace competition.
References
[1]. Du, X., Wang, Z., & Zheng, P. (2023). The impact of economic development and educational resources on the fertility intentions of professional women in the context of modernization. Population and Development, 29(03), 23-33.
[2]. Fang, H., Chen, J., Yuan, F., et al. (2021). The impact of urban housing prices on fertility rates in China: An econometric analysis of 41 cities in the Yangtze River Delta. Geographical Research, 40(09), 2426-2441.
[3]. Sun, W., & Zhang, Z. (2023). The impact of workplace nature on women’s fertility intentions. Journal of Population Studies, 45(02), 15-27.
[4]. Shi, Z., & Zheng, Z. (2023). A gender perspective on fertility intentions. Financial and Trade Economics, 34(06), 9-20.
[5]. Zhou, S., Wang, T., & Hu, J. (2024). Research on the current situation of rural populations and fertility intentions in China. Journal of Tsinghua University (Philosophy and Social Science Edition), 39(01), 221-236, 242.
[6]. Yang, K. (2019). Do high housing prices affect fertility intentions? An empirical analysis of housing prices and fertility intentions among women of childbearing age. Southern Population, 34(05), 69-80.
[7]. Wang, C., & Shi, Z. (2024). Family education expectations and fertility effects under the three-child policy. Population and Economy, (01), 76-89.
[8]. Chen, S. (2024). Fertility rate, fertility policy, and climate policy: A case study in China. Structural Change and Economic Dynamics, 69, 339-348.
[9]. Feng, X. (2004). Fertility intentions of urban youth: Status and comparative analysis. Jiangsu Social Sciences, (04), 175-181.
[10]. Li, J., Qin, Y., Wang, J. (2023). The impact of female education on fertility intentions. Financial and Trade Economics, 34(01), 34-45, 66.
[11]. Wang, Z., Luo, P., & Wu, J. (2023). The fertility potential, intentions, and influencing factors of rural migrant women: An empirical test based on machine learning algorithms. Financial and Trade Economics, 34(02), 1-11.
[12]. Zhang, Z., Zhao, N., Liao, W. (2023). Educational mismatch and workers’ fertility intentions: Evidence from China. Behavioral Sciences, 13(10), 837.
[13]. Wang, X., & Shi, Z. (2022). From income to wealth: Wealth inequality and residents’ fertility intentions. Economic Review, (01), 114-126.
[14]. Li, C., Yang, Z., & Fan, X. (2023). Education level, income class, and fertility intentions. Educational Economics Review, 8(02), 106-128.
[15]. Zhang, L., Xu, G., & Zhang, Y. (2023). Family fertility in the process of Chinese-style modernization: Dilemmas, essence, and strategies for improvement. Chongqing Social Sciences, (12), 88-104.
[16]. Liu, C., & Zheng, L. (2022). The impact of informal employment on fertility intentions: Theory and empirical analysis. Financial Science, (09), 107-122.
[17]. Jiang, Q., Wang, H., & Chen, Z. (2023). The impact of social media information acquisition on the fertility intentions of women of childbearing age: A comparative study of active information seeking and incidental exposure to information. China Population Science, (01), 39-55.
[18]. Zhang, X., Kong, H., & Yan, H. (2023). Father involvement and fertility intentions. Labor Economic Research, 11(01), 3-30.
[19]. Wang, W., & Li, J. (2022). Can digital inclusive finance improve residents’ fertility intentions? Evidence from the China Family Panel Studies. Social Science Front, (12), 53-61.
[20]. Zhou, H. (2022). The impact of household registration urbanization on fertility intentions: An empirical test based on CGSS 2017 data. Journal of Jiangxi University of Finance and Economics, (06), 42-54.
[21]. Du, S., & Wang, S. (2023). Does air pollution affect residents’ fertility intentions? Labor Economic Research, 11(01), 31-51.
[22]. Deng, X. (2023). The “suicidal society” under excessive competition: An analysis and prediction based on technological squeezing. Journal of Tsinghua University (Philosophy and Social Science Edition), 38(02), 213-226, 232.
[23]. Nie, Y., & Feng, X. (2022). Can grandparental childcare increase fertility intentions? A qualitative study based on 23 city families. Jianghuai Forum, (06), 128-134, 142.
[24]. Tan, J., & Ma, K. (2023). Factors influencing the fertility intentions of youth from the perspective of the “fertility time scarcity” view: Data analysis based on 23,884 youth surveys. Huxiang Forum, 36(05), 103-115.
[25]. Zhu, M., & Ai, W. (2023). The crowding-out effect of self-human capital investment on fertility numbers under the condition of extended life expectancy. Population and Society, 39(01), 17-34.
[26]. Bian, S., & Xiong, Y. (2023). The impact and mechanism analysis of educational expectations on fertility behavior under the background of involution. Population and Development, 29(05), 2-11.
[27]. Chen, Z. (2021). Awakening and breakthrough: A discourse analysis of the internet buzzwords “working people” and “involution.” New Media Research, 7(11), 6-13, 34.
[28]. Jiang, Z., Ju, X., & Li, Y. (2024). Urban single youths’ attitudes toward marriage and love from an integrated social work perspective. Chinese Youth Studies, (03), 42-50.
Cite this article
Jiang,X.;Zhu,X.;Dai,J. (2025). Does workplace involution suppress residents’ willingness to have children?. Journal of Applied Economics and Policy Studies,18(3),86-100.
Data availability
The datasets used and/or analyzed during the current study will be available from the authors upon reasonable request.
Disclaimer/Publisher's Note
The statements, opinions and data contained in all publications are solely those of the individual author(s) and contributor(s) and not of EWA Publishing and/or the editor(s). EWA Publishing and/or the editor(s) disclaim responsibility for any injury to people or property resulting from any ideas, methods, instructions or products referred to in the content.
About volume
Journal:Journal of Applied Economics and Policy Studies
© 2024 by the author(s). Licensee EWA Publishing, Oxford, UK. This article is an open access article distributed under the terms and
conditions of the Creative Commons Attribution (CC BY) license. Authors who
publish this series agree to the following terms:
1. Authors retain copyright and grant the series right of first publication with the work simultaneously licensed under a Creative Commons
Attribution License that allows others to share the work with an acknowledgment of the work's authorship and initial publication in this
series.
2. Authors are able to enter into separate, additional contractual arrangements for the non-exclusive distribution of the series's published
version of the work (e.g., post it to an institutional repository or publish it in a book), with an acknowledgment of its initial
publication in this series.
3. Authors are permitted and encouraged to post their work online (e.g., in institutional repositories or on their website) prior to and
during the submission process, as it can lead to productive exchanges, as well as earlier and greater citation of published work (See
Open access policy for details).
References
[1]. Du, X., Wang, Z., & Zheng, P. (2023). The impact of economic development and educational resources on the fertility intentions of professional women in the context of modernization. Population and Development, 29(03), 23-33.
[2]. Fang, H., Chen, J., Yuan, F., et al. (2021). The impact of urban housing prices on fertility rates in China: An econometric analysis of 41 cities in the Yangtze River Delta. Geographical Research, 40(09), 2426-2441.
[3]. Sun, W., & Zhang, Z. (2023). The impact of workplace nature on women’s fertility intentions. Journal of Population Studies, 45(02), 15-27.
[4]. Shi, Z., & Zheng, Z. (2023). A gender perspective on fertility intentions. Financial and Trade Economics, 34(06), 9-20.
[5]. Zhou, S., Wang, T., & Hu, J. (2024). Research on the current situation of rural populations and fertility intentions in China. Journal of Tsinghua University (Philosophy and Social Science Edition), 39(01), 221-236, 242.
[6]. Yang, K. (2019). Do high housing prices affect fertility intentions? An empirical analysis of housing prices and fertility intentions among women of childbearing age. Southern Population, 34(05), 69-80.
[7]. Wang, C., & Shi, Z. (2024). Family education expectations and fertility effects under the three-child policy. Population and Economy, (01), 76-89.
[8]. Chen, S. (2024). Fertility rate, fertility policy, and climate policy: A case study in China. Structural Change and Economic Dynamics, 69, 339-348.
[9]. Feng, X. (2004). Fertility intentions of urban youth: Status and comparative analysis. Jiangsu Social Sciences, (04), 175-181.
[10]. Li, J., Qin, Y., Wang, J. (2023). The impact of female education on fertility intentions. Financial and Trade Economics, 34(01), 34-45, 66.
[11]. Wang, Z., Luo, P., & Wu, J. (2023). The fertility potential, intentions, and influencing factors of rural migrant women: An empirical test based on machine learning algorithms. Financial and Trade Economics, 34(02), 1-11.
[12]. Zhang, Z., Zhao, N., Liao, W. (2023). Educational mismatch and workers’ fertility intentions: Evidence from China. Behavioral Sciences, 13(10), 837.
[13]. Wang, X., & Shi, Z. (2022). From income to wealth: Wealth inequality and residents’ fertility intentions. Economic Review, (01), 114-126.
[14]. Li, C., Yang, Z., & Fan, X. (2023). Education level, income class, and fertility intentions. Educational Economics Review, 8(02), 106-128.
[15]. Zhang, L., Xu, G., & Zhang, Y. (2023). Family fertility in the process of Chinese-style modernization: Dilemmas, essence, and strategies for improvement. Chongqing Social Sciences, (12), 88-104.
[16]. Liu, C., & Zheng, L. (2022). The impact of informal employment on fertility intentions: Theory and empirical analysis. Financial Science, (09), 107-122.
[17]. Jiang, Q., Wang, H., & Chen, Z. (2023). The impact of social media information acquisition on the fertility intentions of women of childbearing age: A comparative study of active information seeking and incidental exposure to information. China Population Science, (01), 39-55.
[18]. Zhang, X., Kong, H., & Yan, H. (2023). Father involvement and fertility intentions. Labor Economic Research, 11(01), 3-30.
[19]. Wang, W., & Li, J. (2022). Can digital inclusive finance improve residents’ fertility intentions? Evidence from the China Family Panel Studies. Social Science Front, (12), 53-61.
[20]. Zhou, H. (2022). The impact of household registration urbanization on fertility intentions: An empirical test based on CGSS 2017 data. Journal of Jiangxi University of Finance and Economics, (06), 42-54.
[21]. Du, S., & Wang, S. (2023). Does air pollution affect residents’ fertility intentions? Labor Economic Research, 11(01), 31-51.
[22]. Deng, X. (2023). The “suicidal society” under excessive competition: An analysis and prediction based on technological squeezing. Journal of Tsinghua University (Philosophy and Social Science Edition), 38(02), 213-226, 232.
[23]. Nie, Y., & Feng, X. (2022). Can grandparental childcare increase fertility intentions? A qualitative study based on 23 city families. Jianghuai Forum, (06), 128-134, 142.
[24]. Tan, J., & Ma, K. (2023). Factors influencing the fertility intentions of youth from the perspective of the “fertility time scarcity” view: Data analysis based on 23,884 youth surveys. Huxiang Forum, 36(05), 103-115.
[25]. Zhu, M., & Ai, W. (2023). The crowding-out effect of self-human capital investment on fertility numbers under the condition of extended life expectancy. Population and Society, 39(01), 17-34.
[26]. Bian, S., & Xiong, Y. (2023). The impact and mechanism analysis of educational expectations on fertility behavior under the background of involution. Population and Development, 29(05), 2-11.
[27]. Chen, Z. (2021). Awakening and breakthrough: A discourse analysis of the internet buzzwords “working people” and “involution.” New Media Research, 7(11), 6-13, 34.
[28]. Jiang, Z., Ju, X., & Li, Y. (2024). Urban single youths’ attitudes toward marriage and love from an integrated social work perspective. Chinese Youth Studies, (03), 42-50.