


1. Introduction
At present, China is at a critical stage of comprehensively promoting rural revitalization and accelerating the modernization of agriculture and rural areas. However, as an important ecological barrier and a region where poverty is relatively concentrated, rural areas in the Yellow River Basin are generally constrained by factors such as fragile ecosystems, frequent natural disasters, and weak infrastructure. These constraints have led to a limited range of livelihood strategies among local farmers and a weak capacity to withstand risks, causing many to fall into poverty traps. According to data from the National Bureau of Statistics, the poverty incidence rate in the nine provinces and regions of the Yellow River Basin reached as high as 5.3% in 2024, significantly higher than the national average. In the face of a complex and ever-changing living and policy environment, how farmers perceive various risk factors and choose appropriate livelihood strategies is crucial to the broader goals of rural revitalization and sustainable development in the Yellow River Basin.
Scholars have conducted extensive and in-depth research on issues such as poverty vulnerability, risk perception, and livelihood choices among farmers. On one hand, from a dynamic perspective of poverty, the concept of poverty vulnerability has been introduced, emphasizing the likelihood that farmers may fall into poverty under multiple shocks. For example, the World Bank [1] used data from six countries to empirically examine how livelihood capital and external shocks affect poverty vulnerability. On the other hand, Western scholars were among the first to introduce the concept of risk perception into studies of farmers’ behavior. Chaudhuri S. [2], for instance, developed a theoretical model linking risk perception to decision-making behavior. Since then, many scholars have conducted empirical analyses on how farmers’ risk perception affects their livelihood behaviors, such as technology adoption and production investment.
Although a considerable amount of theoretical and practical work has been done by scholars both at home and abroad on poverty vulnerability, risk perception, and livelihood choices, few studies have systematically examined the mediating effect of risk perception in the relationship between poverty vulnerability and farmers’ livelihood choices. Therefore, based on survey data from 3,235 rural households in six provinces in the middle and upper reaches of the Yellow River Basin, this study employs poverty vulnerability theory and econometric models to systematically analyze the mechanism through which farmers’ risk perception mediates the impact of poverty vulnerability on livelihood choices. The aim is to provide valuable insights for promoting rural revitalization and supporting sustainable livelihood transformation for farmers in the Yellow River Basin and beyond.
2. Literature review and theoretical analysis
2.1. A review of research on farmers’ poverty vulnerability
2.1.1. Definition of farmers’ poverty vulnerability
Poverty vulnerability refers to the likelihood that farmers will fall into poverty when confronted with multiple shocks such as natural disasters and market risks. Unlike traditional static studies of poverty, poverty vulnerability adopts a dynamic perspective to examine farmers’ poverty status, emphasizing that poverty is not solely determined by current income levels, but is more significantly influenced by the uncertainty of future income. Kuhl J. [3] defined poverty vulnerability as the probability that a household’s future utility from consumption will fall below a predetermined poverty line, highlighting the instability of household consumption. Calvo and Dercon [4] approached the concept from the perspective of farmers’ sensitivity to shocks and their resilience, arguing that the likelihood of falling into poverty after experiencing risks is closely tied to a household’s coping capacity.
Chinese scholars, drawing on international research and integrating the realities of rural China, have further enriched and expanded the connotation of poverty vulnerability. Wang Jianying et al. [5] pointed out that poverty vulnerability is a multidimensional and comprehensive concept encompassing the probability of farmers encountering risks, their risk management ability, and expected welfare losses. Zhu Jianhua [6] further defined poverty vulnerability as a non-permanent, dynamically changing state of poverty that reflects the risk of farmers falling into poverty in the future. Based on existing literature, this study defines farmers’ poverty vulnerability as the probability of future poverty resulting from the interaction between external shocks and internal resilience. This concept encapsulates key characteristics such as the dynamic nature of poverty, the instability of farmers’ livelihoods, and the uncertainty surrounding the onset of poverty.
2.1.2. Determinants of farmers’ poverty vulnerability
Farmers’ poverty vulnerability is shaped by a range of factors including the natural environment, socioeconomic conditions, and human capital. Dutta et al. [7] empirically examined the impact of endowment factors such as education level, health status, and social capital on poverty vulnerability, finding that human capital and social networks significantly reduce vulnerability. Glewwe P. [8], focusing on the context of climate change, investigated poverty vulnerability among Chinese farmers and found that the increasing frequency of extreme weather events exacerbates livelihood risks and elevates poverty vulnerability. Research by Adu, based on survey data from Ghanaian farmers, showed that access to formal credit and participation in agricultural training can alleviate poverty vulnerability.
In the context of rural China, scholars have further expanded research into the mechanisms influencing poverty vulnerability. Feng Jiao et al. [9], using data from contiguous poverty-stricken areas, conducted an empirical analysis of how factors such as agricultural resource endowments, household demographic structure, and social security affect multidimensional poverty vulnerability among farmers. Their findings suggest that poverty vulnerability among Chinese farmers is shaped not only by natural resource constraints but also by demographic and socioeconomic factors such as social security. In a later study, Feng Jiao et al. [9] focused on ecologically fragile areas in the Yellow River Basin and explored the impact and mechanisms of ecological management policies—such as ecological compensation—on farmers’ poverty vulnerability. These studies suggest that farmers’ poverty vulnerability is endogenous to a complex socio-ecological system and is influenced by a combination of factors including natural endowments, human capital, social networks, and policy environments. Identifying these factors is of great significance for accurately assessing the risk of poverty and formulating targeted poverty alleviation policies.
2.2. A review of research on farmers’ risk perception
2.2.1. Connotation and dimensions of farmers’ risk perception
Risk perception reflects individuals’ subjective awareness and evaluation of risk events. Farmers’ risk perception is endogenous to the natural and social environments in which they live and is influenced by psychological factors such as personality traits and cognitive biases. Western scholars were the first to introduce risk perception theory into the study of farmers’ behavior. Based on a survey of German farmers, Keil identified two core dimensions of farmers’ risk perception: perceived probability of risk and perceived loss from risk, which respectively capture farmers’ subjective assessments of the likelihood and consequences of risk events. Subsequent studies have built upon this dual-dimensional model, further expanding the concept and dimensions of risk perception. For instance, Morgan argued that in addition to perceived probability and loss, a sense of control is also a critical psychological factor influencing risk perception and coping behavior among farmers.
Chinese scholars have contributed to the refinement of the concept of risk perception by incorporating localized perspectives. Zou Wei et al. [10], in a study on cotton farmers in Xinjiang, developed a scale for measuring risk perception that includes three dimensions: risk awareness, risk attitude, and risk knowledge. Zhu Xudong et al. proposed that farmers’ risk perception comprises three aspects: risk perception, risk understanding, and risk attitude, and emphasized the dynamic and interactive nature of this perception. Other scholars have examined the perceptual differences farmers have toward various sources of risk, further enriching the conceptual framework. For example, Fang Yingfeng and Zou Wei [11] compared farmers’ subjective perceptions of agricultural production risks, market risks, and policy risks, finding significant perceptual differences among risk types. Drawing on both domestic and international studies, this paper defines farmers’ risk perception as their overall perception and evaluation—based on both subjective and objective factors—of the probability, severity, and controllability of risk events. It consists of multiple psychological dimensions including cognition, attitude, and behavioral tendency, is embedded within farmers’ socio-ecological contexts, and evolves dynamically over time.
2.2.2. Mechanism of the Impact of Farmers’ Risk Perception
How farmers’ risk perception influences their livelihood decision-making has long been a focus of academic inquiry. Sitkin and Pablo were the first to propose the “risk perception–behavioral decision-making” theoretical model, which revealed how farmers’ subjective perception of risk drives their livelihood choices. This model emphasizes that farmers weigh the utility of alternative options based on their individual risk perceptions, opting for the strategy that minimizes expected losses. Building on this model, numerous scholars have further explored the internal mechanisms through which risk perception shapes various types of livelihood behavior among farmers. For instance, Islam A et al. [12], using data from Filipino farmers, found that a higher perceived market risk reduces farmers’ willingness to adopt modern farming techniques, with risk-avoidance motivation acting as a key mediating factor. Fuente ADL et al. [13], focusing on Chinese farmers’ perception of environmental risks, found that those with heightened environmental risk awareness are more inclined to adopt environmentally friendly production practices to reduce pollution control costs. These studies suggest that farmers’ risk perception influences their evaluation and choice of livelihood strategies through mediating factors such as income expectations and risk preferences.
Domestic scholars have further examined the boundary conditions under which risk perception affects farmers’ livelihood decisions. Liu Qijun et al. [14], based on a survey of farmers in Gansu Province, found that the institutional environment significantly moderates the relationship between risk perception and employment choice. Specifically, sound employment services and social security can alleviate farmers’ perceived risks of off-farm employment and enhance their willingness to pursue diversified livelihoods. Lin Quan et al. [15], using data from farmers in Hainan Province, demonstrated that social networks play a key mediating role in the relationship between risk perception and livelihood diversification. Social networks help farmers access essential information and resources for livelihood development, thereby reducing their perceived risks associated with new livelihood options. These context-specific studies show that while farmers’ risk perception influences livelihood behavior through mediating mechanisms, the effectiveness of these mediating effects is shaped by contextual factors such as resource endowment and social networks.
2.3. Theoretical analysis of the relationship among poverty vulnerability, risk perception, and livelihood choice
Although extensive research has been conducted both domestically and internationally on poverty vulnerability, risk perception, and livelihood choice among farmers, several limitations remain in the existing literature. First, there is a lack of systematic examination of the mediating effect of farmers’ risk perception. Most studies focus on the unidirectional impact of either poverty vulnerability or risk perception on livelihood behavior, overlooking the internal mechanism by which poverty vulnerability affects livelihood choice—particularly the mediating role of risk perception. Second, there is insufficient comparative analysis of how different sources of risk influence farmers’ livelihood decisions. Given the multiplicity of risks farmers face, understanding how they weigh these different risks to make rational livelihood decisions is crucial to deepening our understanding of their behavior. However, existing research rarely compares how subjective perceptions of production risk, market risk, and policy risk differ and influence livelihood strategies. Third, cross-context empirical validation needs to be strengthened. Variations in resource endowment, socio-cultural norms, and policy environments across regions may lead to heterogeneity in both the formation of farmers’ risk perceptions and the resulting behavioral outcomes. Most current studies are limited to specific regional samples and lack comparative analysis and empirical testing across different contexts.
In response, this study proposes an analytical framework based on Sitkin and Pablo’s “risk perception–behavioral decision-making” model to examine the relationship among poverty vulnerability, risk perception, and livelihood choice. Specifically, it explores the mechanism through which poverty vulnerability affects livelihood choices via risk perception. On the one hand, poverty vulnerability influences farmers’ subjective perception of livelihood risk. Farmers with higher vulnerability face greater survival pressures and are more sensitive to livelihood risks, thereby reducing their preference for high-risk livelihood options such as off-farm employment or entrepreneurship. On the other hand, the risk attitudes formed based on risk perception further drive livelihood decisions. Farmers with stronger perceptions of livelihood risk tend to opt for risk-averse strategies, avoiding non-agricultural livelihoods that are more susceptible to market risks and policy uncertainty. In summary, this study argues that poverty vulnerability influences farmers’ livelihood strategies by shaping their risk perception, with risk perception playing a mediating role in this process.
Moreover, this study further conducts a comparative analysis of farmers’ perceptions of production risk, market risk, and policy risk, and how these perceptions influence livelihood choices. Generally, production risk stems from uncertainties in agricultural production, such as natural disasters and pests; market risk arises from price volatility and is influenced by market supply and demand dynamics and market order; policy risk is associated with uncertainties in the policy environment, including policy changes and implementation effectiveness. Differences in farmers’ perceptions of these risk sources reflect the diversity of their risk preferences and consequently lead to differentiated livelihood choices.
Finally, in view of the significant regional differences in resource endowment, socio-cultural norms, and policy environments, this study selects samples of farmers from different areas in the upper, middle, and lower reaches of the Yellow River Basin for comparative analysis. Spanning eastern, central, and western China, the Yellow River Basin covers various geomorphic units such as the Qinghai-Tibet Plateau, the Loess Plateau, and the North China Plain, with complex and diverse natural conditions. It serves as both a critical ecological barrier and a key poverty-stricken area in China. The upper reaches are characterized by high altitudes and fragile ecosystems, the middle reaches by severe soil erosion on the Loess Plateau, and the lower reaches by dense populations and advanced economies. Regional differences in livelihood capital endowments, cultural traditions, and policy support are substantial, which may result in divergent patterns of risk perception and livelihood behavior. Conducting a comparative analysis of farmer samples across these regions will facilitate a deeper understanding of the general patterns and regional variations in how poverty vulnerability influences livelihood choice. This, in turn, can inform place-based strategies for rural revitalization and the optimization of farmers’ livelihood strategies.
3. Research design
3.1. Research hypotheses
Based on the theoretical analysis presented earlier, this study proposes the following hypotheses:
H1: Farmers’ vulnerability to poverty significantly affects their choice of livelihood strategies. Specifically, the higher the vulnerability, the more inclined farmers are to adopt risk-averse livelihood strategies, namely agriculture-oriented approaches.
H2: Farmers’ risk perception plays a significant mediating role in the relationship between poverty vulnerability and livelihood strategy choices. Vulnerability to poverty affects farmers’ subjective perception of livelihood risks, which in turn drives their strategy selection.
H2a: Farmers’ perception of production risk mediates the relationship between poverty vulnerability and livelihood strategy selection.
H2b: Farmers’ perception of market risk mediates the relationship between poverty vulnerability and livelihood strategy selection.
H2c: Farmers’ perception of policy risk mediates the relationship between poverty vulnerability and livelihood strategy selection.
H3: There are significant differences in farmers’ perceptions of different risk sources, which in turn exert differentiated effects on their livelihood strategies.
H3a: Compared with production risks, farmers perceive market and policy risks more strongly; hence, the suppressive effect of market and policy risk perception on livelihood diversification is more significant.
H3b: The livelihood effects of differences in farmers’ perceptions of various risk sources show significant regional variation within the Yellow River Basin.
3.2. Data sources and variable selection
3.2.1. Data sources
The data used in this study come from a farmer questionnaire survey conducted by the research team in the middle and upper reaches of the Yellow River Basin during August and September 2022. The survey covered six provinces: Qinghai, Ningxia, Inner Mongolia, Shaanxi, Shanxi, and Henan, resulting in a total of 3,235 returned questionnaires. Stratified random sampling was employed, taking into account both regional representativeness and the diversity of farmer types to ensure scientific and comprehensive sample distribution. The questionnaire addressed multiple dimensions, including household characteristics, poverty status, livelihood sources, risk perception, and livelihood choices, providing a holistic view of farmers’ livelihood conditions and influencing factors.
To ensure data quality, the team adhered strictly to academic standards throughout the survey process. Prior to the fieldwork, the team designed a targeted questionnaire, revising its content and item structure through multiple rounds of discussion to ensure reliability and validity. During the survey, experienced professionals were selected as interviewers, collecting firsthand information through household interviews and probing deeply into key issues to obtain detailed and objective data. Post-survey, the research team systematically reviewed, entered, and cleaned the data, excluding samples from livestock-only households, households without labor force, and those with missing key variables.
After rigorous screening, the final valid sample consisted of 2,559 questionnaires. The reliability and validity of the data were verified and found to meet the basic requirements for econometric analysis. Overall, the high-quality data collection and careful data cleaning process provided solid micro-level data support for the empirical analysis in this paper.
3.2.2. Variable selection
3.2.2.1. Dependent variable: farmers’ livelihood choice
Following the approach of other researchers, this study classifies livelihood strategies based on the proportion of total household income derived from agriculture. Three types are identified: Agriculture-dominated (agricultural income > 50%); Balanced agriculture and non-agriculture (agricultural income between 30% and 70%); Non-agriculture-dominated (non-agricultural income > 70%). These are coded as 1, 2, and 3, respectively.
3.2.2.2. Independent variable: farmers’ poverty vulnerability
This study adopts the poverty vulnerability measurement model proposed by Wan Guanghua et al. (2009) to construct a poverty vulnerability index. The index comprehensively considers both the probability and depth of poverty to capture farmers’ multidimensional vulnerability. The calculation formula is as equation (1):
\( {V_{i}}=Pr({Y_{i}} \lt Z) \) (1)
Where \( {V_{i}} \) represents the poverty vulnerability of farmer 𝑖, \( {Y_{i}} \) is the per capita net income of farmer 𝑖, and \( Z \) is the poverty line, set at RMB 4,000 based on China’s 2020 rural poverty standard. The probability of poverty is estimated using a logistic regression model (equation 2):
\( Pr({Y_{i}} \lt Z)=F({X_{i}}β) \) (2)
Where \( {X_{i}} \) denotes the explanatory variables affecting farmer 𝑖’s poverty, \( β \) represents the parameters to be estimated, and \( F(\cdot ) \) is the logistic distribution function. The estimated probability is substituted into the formula above to derive the vulnerability index.
3.2.2.3. Mediating variable: farmers’ risk perception
Drawing on the studies by Keil, this study measures farmers’ risk perception across three dimensions: production risk, market risk, and policy risk. Production risk perception is measured by farmers’ perceived threats from droughts, floods, pests, and diseases. Market risk perception is assessed by perceptions of volatility in agricultural product prices and supply-demand relationships. Policy risk perception is based on perceived risks associated with agricultural policy adjustments and implementation deviations. A five-point Likert scale is used to score each type of risk perception, with higher scores indicating stronger subjective perceptions of the respective risks.
3.2.2.4. Control variables
Based on existing literature, control variables incorporated into the model include the household head’s age, education level, household size, per capita arable land, social capital, and location conditions, to account for potential confounding effects.
3.3. Model Construction
(1) Mediation Effect Test Model
To test the mediating effect of farmers’ risk perception on the relationship between poverty vulnerability and livelihood strategy choice, this study constructs the following model (equation 3 and 4) based on the mediation effect testing procedure proposed:
\( {M_{j}}={β_{0}}+c\cdot vu{l_{i}}+\sum _{k}{λ_{k}}\cdot {X_{k}}+{ε_{i}} \) (3)
\( {Y_{i}}={β_{0}}+{c^{ \prime }}\cdot vu{l_{i}}+b\cdot {M_{j}}+\sum _{k}{λ_{k}}\cdot {X_{k}}+{ε_{i}}{λ_{k}} \) (4)
Where denotes the i-th farmer’s perception of the j-th type of risk [𝑝𝑟𝑜𝑑𝑢𝑐𝑡𝑖𝑜𝑛 𝑟𝑖𝑠𝑘 𝑝𝑒𝑟𝑐𝑒𝑝𝑡𝑖𝑜𝑛, 𝑚𝑎𝑟𝑘𝑒𝑡 𝑟𝑖𝑠𝑘 𝑝𝑒𝑟𝑐𝑒𝑝𝑡𝑖𝑜𝑛, 𝑝𝑜𝑙𝑖𝑐𝑦 𝑟𝑖𝑠𝑘 𝑝𝑒𝑟𝑐𝑒𝑝𝑡𝑖𝑜𝑛]; \( vu{l_{i}} \) represents the farmer’s poverty vulnerability; \( {X_{k}} \) indicates the control variables; \( β,c,{c^{ \prime }},b,λ \) stands for the coefficients to be estimated; and \( {ε_{i}} \) is the random error term. According to the mediation effect testing procedure proposed by Baron and Kenny, when both \( C \) and \( b \) are statistically significant, and 𝑐′ is not significant, the mediation effect is considered significant. Otherwise, the difference between coefficients \( C \) and 𝑐′ must be further compared.
(2) Multinomial Logistic Regression Model
Given that the dependent variable—farmers’ livelihood strategy—is an unordered categorical variable, a multinomial logistic regression model is employed for estimation (equation 5):
\( ln(\frac{P({Y_{i}}=j)}{P({Y_{i}}=1)})={β_{0}}+{β_{1}}\cdot vu{l_{i}}+{β_{2}}\cdot {M_{j}}+\sum _{k} {λ_{k}}\cdot {X_{k}}+{ε_{i}},j=2,3 \) (5)
Here, \( {Y_{i}} \) represents the livelihood strategy type chosen by farmer i, where 𝑗=1 indicates a livelihood mainly based on agriculture, 𝑗=2 indicates a mixed livelihood, and 𝑗=3 indicates a livelihood mainly based on non-agricultural activities, with the agricultural livelihood (j = 1) as the reference category. The estimated coefficients \( {β_{1}} \) and \( {β_{2}} \) measure the influence of poverty vulnerability and risk perception, respectively, on livelihood choice. A significantly negative \( {β_{1}} \) indicates that higher poverty vulnerability leads farmers to prefer agriculture-based livelihoods; similarly, a significantly negative \( {β_{2}} \) suggests that stronger risk perception drives farmers to adopt agriculture-based livelihood strategies.
(3) Comparative Analysis of the Heterogeneous Impact of Risk Perceptions
To examine the heterogeneous effects of different sources of risk perception, the model (2) is modified by substituting the general risk perception variable \( {M_{j}} \) with separate variables for each dimension (production, market, and policy risks). This allows for comparison of their estimated coefficients and for testing Hypothesis H3. Additionally, to test Hypothesis H3b, the sample is divided by region within the Yellow River Basin, and group regressions are conducted to investigate regional heterogeneity in how risk perception influences livelihood strategies (Research framework as shown in Figure 1).
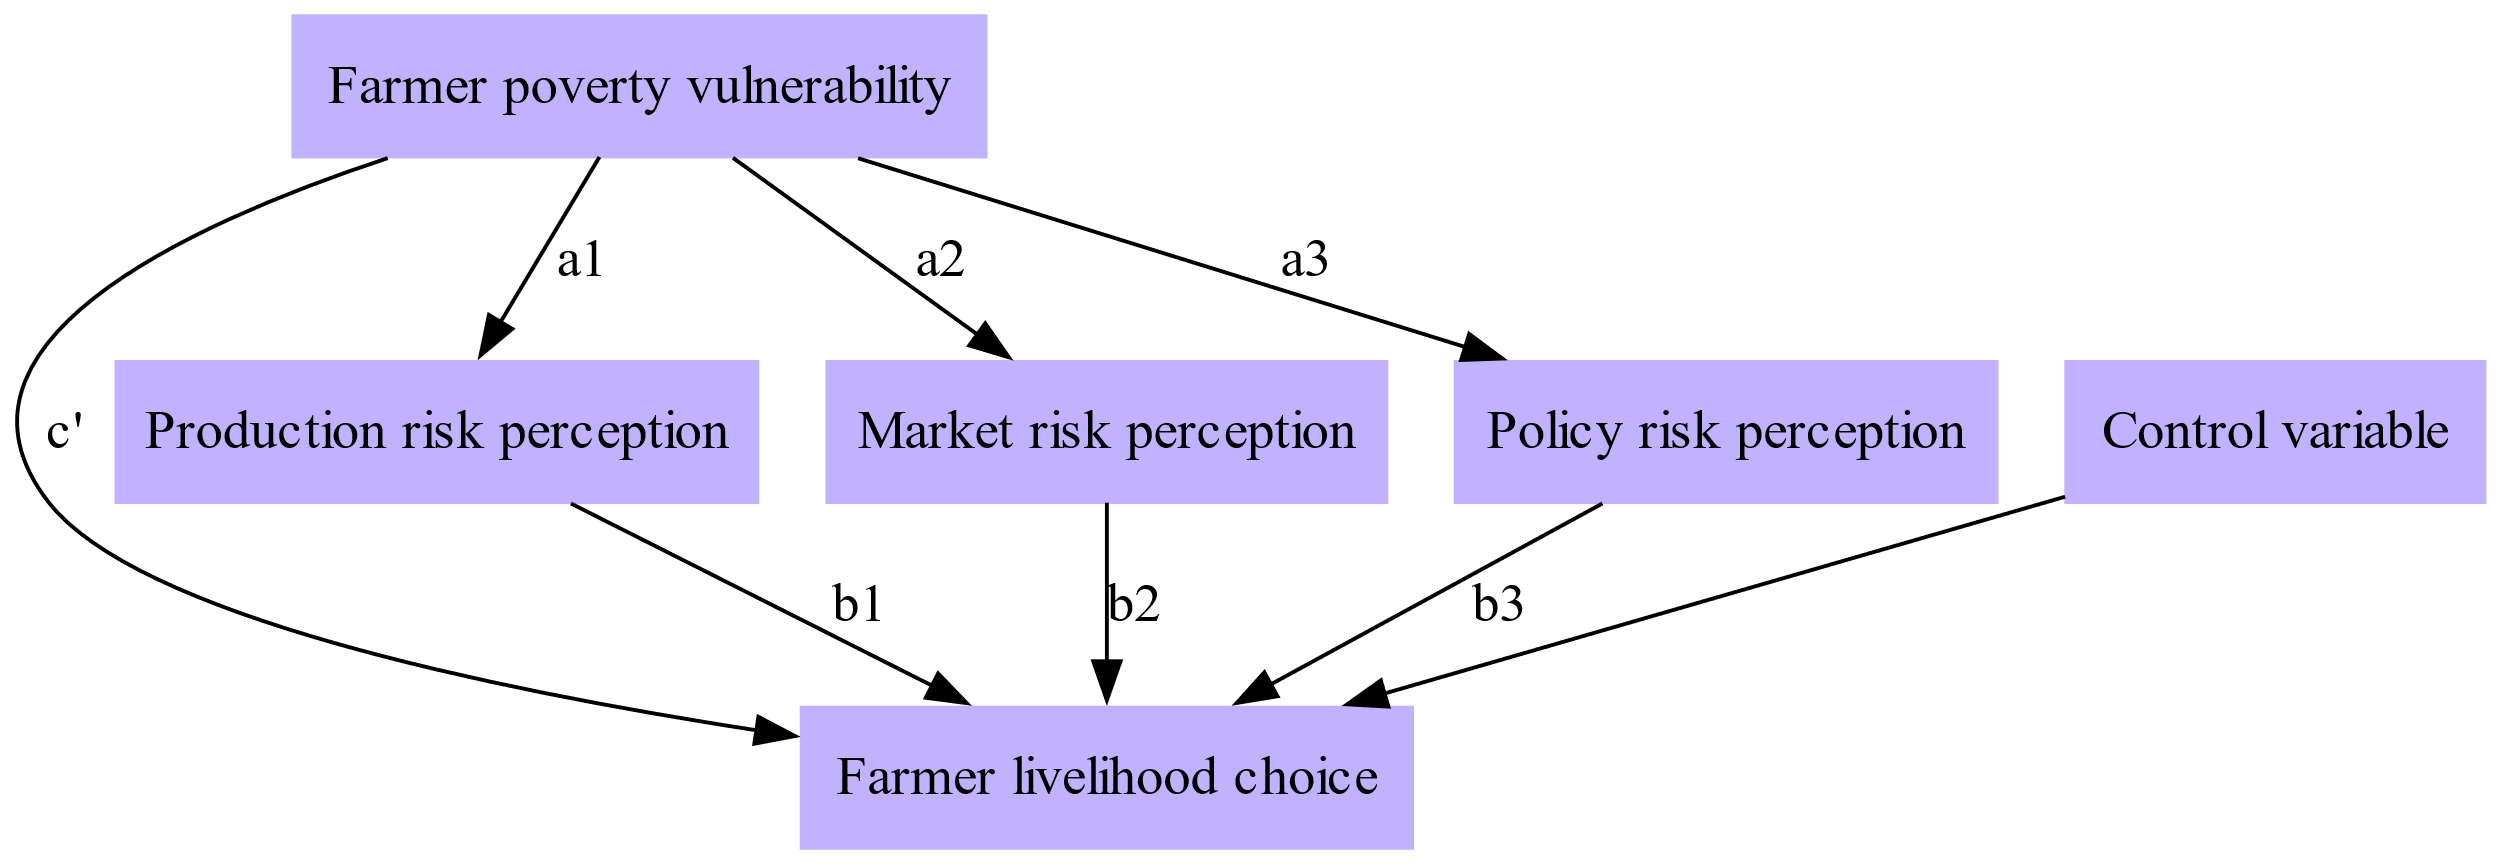
Figure 1. Research framework
Table 1. Variable definitions and descriptions
Variable Type | Variable Name | Variable Definition |
Dependent Variable | Farmers’ Livelihood Strategy | Mainly agricultural = 1, Mixed agriculture/non-agriculture = 2, Mainly non-agricultural = 3 |
Independent Variable | Poverty Vulnerability | Poverty vulnerability index |
Mediating Variables | Production Risk Perception | Average score on 5-point Likert scale |
Market Risk Perception | Average score on 5-point Likert scale | |
Policy Risk Perception | Average score on 5-point Likert scale | |
Control Variables | Age of Household Head | Actual age of household head |
Education Level of Household Head | Years of education completed by household head | |
Household Size | Number of permanent household members | |
Per Capita Arable Land Area | Household’s arable land area per capita (mu) | |
Social Capital | Number of social organizations participated in | |
Location Condition | Distance to the nearest county town (km) |
Data Source: Survey data of farmers in Yan’an, Shaanxi, January 2023.
As shown in Table 1, most sample households rely primarily on agriculture. Poverty vulnerability levels are slightly below average. Farmers perceive market risks most strongly, followed by production risks, while policy risks are perceived to a lesser extent. The average age of household heads is 47, with generally low education levels. Households tend to be small with limited arable land per capita, low participation in social capital, and poor location conditions. Overall, the sample exhibits typical characteristics of underdeveloped rural areas in western China, providing a representative basis for analysing livelihood choices among poverty-vulnerable households.
4. Empirical analysis
4.1. Descriptive statistical analysis
To gain a preliminary understanding of the basic characteristics of farmers’ livelihood choices and their influencing factors, this study conducted a descriptive statistical analysis of the main variables of the sample farmers. As shown in Table 2, the proportion of farmers mainly engaged in agriculture is the highest (54.32%), followed by those engaged in both agriculture and non-agricultural activities (41.35%), while the proportion of those primarily engaged in non-agricultural activities is the lowest (4.33%). This indicates that livelihoods in the surveyed areas are predominantly agriculture-based, though a trend toward livelihood diversification is emerging. In terms of poverty status, the average poverty vulnerability index of the sample farmers is 0.127, which is at a relatively low to moderate level, suggesting that farmers face a certain degree of poverty risk. Regarding risk perception, farmers perceive market risks most strongly (3.519), followed by production risks (3.213), while their perception of policy risks is relatively weaker (3.052). This may be related to factors such as increased fluctuations in agricultural product prices and the frequent occurrence of extreme weather events.
Table 2. Descriptive statistics of variables
Name | Mean | Standard Deviation | |
Dependent Variable | Farmers’ Livelihood Choice | ||
Mainly Agricultural | 54.32% | ||
Agriculture & Non-agriculture | 41.35% | ||
Independent Variable | Mainly Non-agricultural | 4.33% | |
Mediating Variable | Farmers’ Poverty Vulnerability | 0.127 | 0.114 |
Production Risk Perception | 3.213 | 0.925 | |
Market Risk Perception | 3.519 | 0.844 | |
Control Variables | Policy Risk Perception | 3.052 | 1.132 |
Age of Household Head | 47.256 | 11.033 | |
Education Level of Household Head | 7.845 | 2.976 | |
Household Size | 4.125 | 1.341 | |
Per Capita Arable Land Area | 2.452 | 1.865 | |
Social Capital | 1.865 | 0.954 | |
Location Condition | 37.114 | 24.336 |
Analysis of the control variables shows that the average age of household heads is 47, and their years of education are less than 8, reflecting limited human capital among the farmers. Household size and per capita arable land are both relatively small, indicating limited land resource endowment. Farmers have limited participation in social organizations, reflecting low levels of social capital accumulation. The average distance to the nearest town is 37 kilometers, suggesting poor location conditions. Overall, the sample farmers exhibit typical characteristics of underdeveloped rural areas in western China, providing a representative sample for analyzing livelihood choices among poverty-vulnerable households.
4.2. Measurement of farmers’ poverty vulnerability
The poverty vulnerability of farmers is measured using the vulnerability as expected poverty model proposed by Wan Guanghua et al. [16]. The results show that among the 2,559 valid samples, 323 farmers have a vulnerability index above the 0.5 threshold, meaning that 12.62% of farmers face a high risk of falling into poverty. Further classification reveals that 7.35% of farmers are currently poor and remain highly likely to be poor in the future ([vulnerable poor households]), while 5.27% are currently non-poor but likely to become poor in the future ([vulnerable non-poor households]). These households are at significant risk of falling into poverty due to internal or external shocks and should receive particular attention from policymakers.
Table 3. Measurement results of farmers’ poverty vulnerability
Number of Households | Proportion (%) | |
Vulnerable Households (V > 0.5) | 323 | 12.62 |
Vulnerable Poor Households | 188 | 7.35 |
Vulnerable Non-poor Households | 135 | 5.27 |
Non-vulnerable Households (V ≤ 0.5) | 2,589 | 80.03 |
4.3. Identification of farmers’ livelihood strategy types
K-means clustering analysis is employed to identify the livelihood strategies of farmers. Based on five income indicators—agricultural income, wage income, business income, property income, and transfer income—farmers’ livelihoods are categorized into three types: mainly agricultural (agricultural income accounts for more than 50%), balanced agriculture and non-agriculture (agricultural income accounts for 30%–50%), and mainly non-agricultural (non-agricultural income accounts for more than 70%). The silhouette coefficient of the clustering result is 0.68, indicating a good clustering structure. The validity test of the clustering results shows that the between-group sum of squares is significantly greater than the within-group sum of squares (F = 375.62, p < 0.001), indicating that the differences among the three livelihood strategy types are statistically significant.
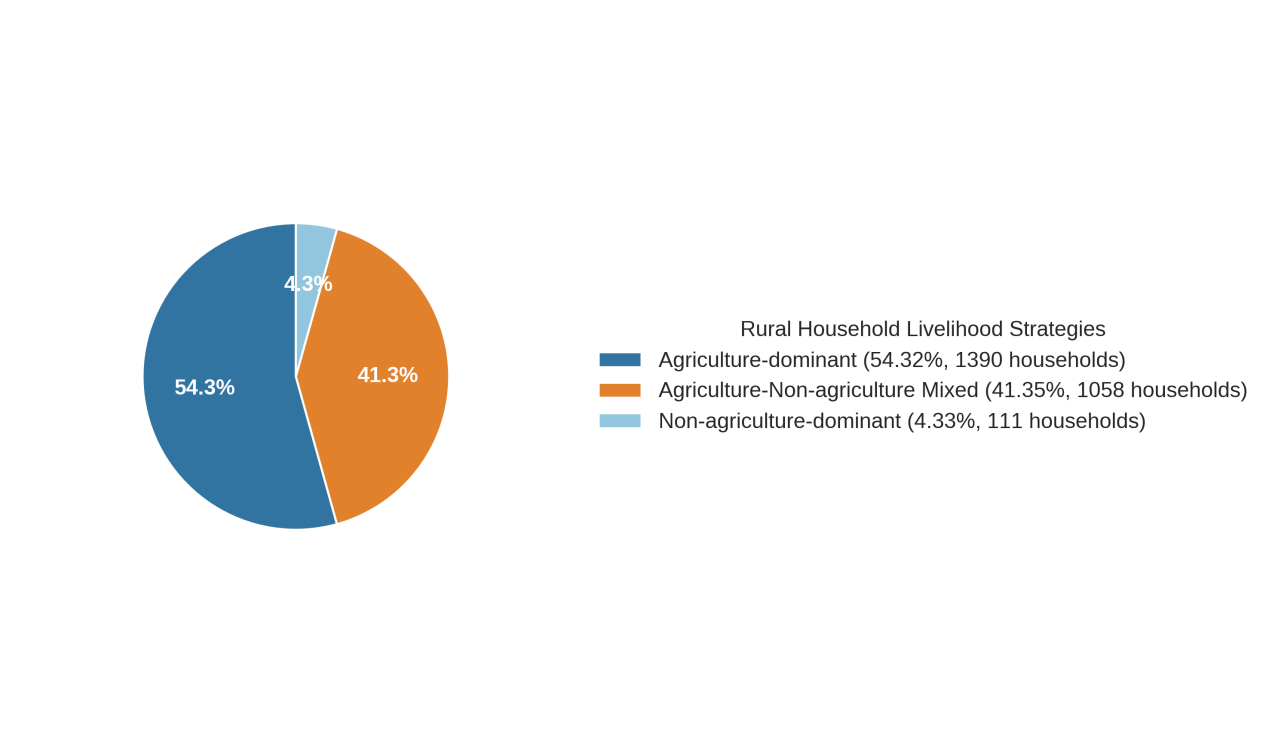
Figure 2. Calculation results of farmers’ poverty vulnerability
As shown in Figure 2, the majority of farmers rely primarily on agriculture, accounting for 54.32%. The next largest group is those who balance both agriculture and non-agriculture, comprising 41.35%, while the smallest group consists of farmers who rely primarily on non-agriculture, accounting for only 4.33%. This indicates that in the surveyed area, the livelihood of farmers is primarily agricultural, but the trend of livelihood diversification is already emerging. This finding is consistent with the descriptive statistics mentioned earlier.
4.4. Empirical test of the impact of poverty vulnerability on livelihood choices
To verify the impact of farmers’ poverty vulnerability on their livelihood choices (Hypothesis H1), this study constructs a multinomial logistic regression model. Using “agriculture as the main livelihood” as the reference group, the study separately examines the impact of poverty vulnerability on “agriculture and non-agriculture balanced” and “non-agriculture as the main livelihood.” At the same time, control variables such as household head’s age, education level, household size, per capita cultivated land area, social capital, and location conditions are included to exclude the potential influence of other factors. The estimation results are shown in Table 4.
Table 4. Estimation results of the impact of poverty vulnerability on farmers’ livelihood choices
Variable | Agriculture and Non-Agriculture Balanced | Non-Agriculture as the Main Livelihood |
Poverty Vulnerability | -0.618** (0.253) | -1.263*** (0.384) |
Age of Household Head | -0.016*** (0.006) | -0.035*** (0.011) |
Education Level of Household Head | 0.052** (0.023) | 0.184*** (0.044) |
Household Size | 0.101* (0.053) | 0.312*** (0.091) |
Per Capita Arable Land Area | -0.084** (0.035) | -0.261*** (0.062) |
Social Capital | 0.146** (0.068) | 0.369*** (0.117) |
Location Condition | -0.010*** (0.004) | -0.027*** (0.007) |
Constant | -0.752* (0.389) | -2.815*** (0.686) |
Note: ***, **, * indicate significance at the 1%, 5%, and 10% levels, respectively. Standard errors are in parentheses.
The model estimation results show that the coefficients of poverty vulnerability on “agriculture and non-agriculture balanced” and “non-agriculture as the main livelihood” are -0.618 and -1.263, respectively, and both are significant at the 1% level. This means that, compared to agriculture as the main livelihood, farmers with higher poverty vulnerability are less likely to choose a diversified livelihood strategy, either balancing agriculture and non-agriculture or relying primarily on non-agriculture. The negative and significant coefficients support Hypothesis H1. The underlying reason might be that farmers with higher poverty vulnerability, in order to avoid livelihood risks, tend to choose more stable agricultural livelihoods and avoid high-risk livelihoods such as non-agricultural employment or self-employment.
Regarding control variables, the negative and significant coefficients for household head’s age and per capita cultivated area indicate that older household heads and those with more land resources are more likely to choose traditional agricultural livelihoods. This is related to the dependence of agricultural production on land and farming experience. On the other hand, the positive and significant coefficients for household head’s education level, household size, and social capital suggest that the richer the human capital, family labor resources, and social network, the stronger the tendency of farmers to engage in non-agricultural livelihoods. Additionally, the negative and significant coefficient for location conditions shows that farmers located farther from towns are more likely to engage in agricultural livelihoods, highlighting the important influence of location factors.
4.5. Mediation effect of risk perception in the influence of poverty vulnerability on livelihood choices
As analyzed earlier, poverty vulnerability significantly affects farmers’ livelihood choices. However, how poverty vulnerability affects livelihood decisions through farmers’ risk perceptions requires further examination. To explore the mediation effect of farmers’ risk perceptions on the relationship between poverty vulnerability and livelihood choices Hypothesis H2, this study follows the mediation effect testing procedure outlined by Wen Zhonglin and constructs a stepwise regression model.
Step 1: The total effect of poverty vulnerability on livelihood choices is tested by setting farmers’ livelihood choices as the dependent variable and poverty vulnerability as the independent variable, while controlling relevant variables. The results show that poverty vulnerability has a significant negative effect on both “agriculture and non-agriculture balanced” and “non-agriculture as the main livelihood” (M1), with the total effect being significant.
Step 2: The impact of poverty vulnerability on risk perception is tested by setting production risk perception, market risk perception, and policy risk perception as the dependent variables and poverty vulnerability as the independent variable, while controlling relevant variables. The results show that poverty vulnerability has a significant negative effect on all three types of risk perception (M2-M4). That is, the higher the poverty vulnerability, the weaker the farmers’ perception of production risk, market risk, and policy risk.
Step 3: The effect of poverty vulnerability and risk perception on livelihood choices is tested by setting farmers’ livelihood choices as the dependent variable and both poverty vulnerability and risk perception as independent variables, while controlling relevant variables. As shown in M5-M6, after including the risk perception variables, the direct effects of poverty vulnerability on farmers’ choice of “agriculture and non-agriculture balanced” (M5) and “non-agriculture as the main livelihood” (M6) both decreases, and the mediation effect of production risk perception and policy risk perception is relatively significant. Further comparison of coefficient differences and Sobel tests show that the mediation effects pass the significance test.
Table 5. Mediation effect test of risk perception
Variable | M1: Total Effect | M2: Production Risk Perception | M3: Market Risk Perception | M4: Policy Risk Perception | M5: Agriculture and Non-Agriculture Balanced | M6: Non-Agriculture as the Main Livelihood |
Poverty Vulnerability | -0.894***(0.218) | -0.527***(0.083) | -0.336***(0.076) | -0.618***(0.097) | -0.712***(0.221) | -0.938***(0.337) |
Production Risk Perception | -0.196**(0.089) | -0.313*(0.164) | ||||
Market Risk Perception | -0.042(0.094) | -0.089(0.175) | ||||
Policy Risk Perception | -0.115*(0.069) | -0.297**(0.128) | ||||
Control Variables | Yes | Yes | Yes | Yes | Yes | Yes |
Mediation Effect | 19.45% | 27.33% |
Based on the stepwise regression results, farmers’ production risk perception and policy risk perception play a partial mediating role in the effect of poverty vulnerability on livelihood choices, and the mediation effects are significant, validating Hypotheses H2a and H2c. However, the mediation effect of market risk perception is not significant, and H2b is not supported. The policy implication of this result is that farmers with higher poverty vulnerability may lower their perception of production and policy risks, which in turn influences their livelihood strategy choices. Enhancing farmers’ confidence in production and policy environments helps stimulate their endogenous motivation for livelihood diversification.
5. Robustness checks
To ensure the robustness of empirical results and the reliability of theoretical mechanisms, this study primarily employs two methodological approaches for robustness testing. First, the variable replacement method was applied, particularly focusing on mediator variables, to examine potential subjective evaluation biases: For production risk perception: The subjective scoring measure was replaced with the ratio of agricultural insurance expenditure to farm income over the past three years, objectively reflecting risk prevention behaviors against droughts, floods, and pests. For market risk perception: Farmers' subjective assessments of price fluctuations and supply-demand imbalances were substituted with the number of market information channels accessed during the preceding three-year period. For policy risk perception: Subjective evaluations of policy adjustments and implementation deviations were replaced with attendance counts at government-organized policy training sessions over three years. Second, the winsorization approach was implemented. Core variables underwent 1% winsorization at both tails to mitigate the influence of extreme values. Comparative analysis demonstrated negligible differences in coefficient magnitudes and statistical significance between these robustness checks and the main regression results. This consistency confirms that our findings remain unaffected by extreme values or subjective farmer evaluations, thereby substantiating the reliability of the study's conclusions.
6. Research conclusions and discussion
6.1. Main research conclusions
Based on preliminary research in the six provinces of the upper and middle reaches of the Yellow River Basin, this study empirically analyzes the role of farmers’ risk perception in how poverty vulnerability influences their livelihood choices. The main research conclusions are as follows:
First, farmers’ poverty vulnerability significantly affects their livelihood choices. The higher the poverty vulnerability, the more likely farmers are to choose a risk-averse, agriculture-dominated livelihood strategy, avoiding high-risk livelihood activities such as non-farm employment and self-employment. This indicates that farmers with high poverty vulnerability, driven by the need to maintain a basic survival threshold, tend to adopt passive livelihood strategies centered around “stability,” preferring to avoid risks rather than engaging in potentially profitable but riskier activities. In contrast, farmers with lower poverty vulnerability, having a certain capacity to withstand risks, are more inclined to diversify their livelihoods for higher returns.
Second, farmers’ production risk perception and policy risk perception are important mediating variables in the influence of poverty vulnerability on livelihood choices. Farmers with high poverty vulnerability have a stronger perception of risks such as natural disasters and production accidents, leading them to choose agricultural livelihoods that are lower in risk but also limited in returns. Additionally, farmers with high poverty vulnerability are more sensitive to the uncertainties of the policy environment, worrying about market fluctuations caused by policy adjustments, thus avoiding non-farm activities that heavily depend on policies. This highlights the critical mediating role of farmers’ subjective risk perception in the process by which poverty vulnerability influences livelihood behaviors.
Third, there are significant differences in farmers’ perceptions of different risk sources, and these perceptual differences influence farmers’ livelihood choices in a regionally differentiated manner. Compared to production risk, farmers have a stronger perception of market and policy risks. Furthermore, the suppressive effect of policy risk perception on farmers’ livelihood diversification is stronger than that of market risk perception. Further regional analysis shows that farmers in the lower reaches of the Yellow River are more influenced by market factors, while those in the upper and middle reaches are more sensitive to policy risks, and the effects of risk perception differences on livelihood choices display clear regional imbalances.
6.2. Research insights and policy recommendations
The conclusions of this study offer important insights for targeted poverty alleviation and rural revitalization practices. To effectively enhance the livelihood capacity of impoverished farmers and help them achieve a sustainable livelihood transformation, the following policy recommendations are proposed:
First, continuing to strengthen farmers’ risk protection based on poverty alleviation efforts and reduce their poverty vulnerability. By deepening agricultural insurance, improving rural social security, and strengthening anti-poverty and poverty monitoring and early warning systems, a comprehensive “safety net” can be provided for farmers. This enhances their ability to withstand production and business risks, thus laying a solid foundation for breaking free from “basic survival thinking” and actively participating in rural industry development. Special efforts should be made to assist farmers facing high risks of poverty, to prevent them from falling into the “trap” again in their livelihood choices.
Second, strengthening farmers’ risk management education to improve their ability to identify and cope with risks. Practical technical training in disaster prevention and reduction, comprehensive agricultural practices, and other areas should be actively conducted to enhance farmers’ ability to recognize and scientifically respond to natural disasters and agricultural pests and diseases, guiding them to objectively perceive production risks. At the same time, rural financial literacy should be strengthened to improve farmers’ understanding of market supply and demand and price trends, enhancing their intrinsic motivation to engage with new rural business entities and agricultural business models.
Third, reinforcing rural industry policy guidance and improving inclusive risk-sharing mechanisms. The government should play a greater role in promoting agricultural leading enterprises, improving interest linkage mechanisms, and forming an industrial development model of “leading enterprises + cooperatives + farmers,” which will create platforms for farmers to diversify their production and business risks. Inclusive support for farmers should be provided through policies related to finance, insurance, and other aspects, establishing sound risk-sharing mechanisms, stabilizing farmers’ expectations, and guiding them to actively engage in high-return and diversified livelihood activities.
Fourth, optimizing farmers’ livelihood development environment based on regional resource endowments. Given the significant differences in resource endowments and regional conditions among farmers in different sections of the Yellow River Basin, it is crucial to scientifically grasp the risk perception characteristics and livelihood needs of farmers in different regions, implementing targeted measures and interventions. For example, in the lower reaches of the Yellow River, efforts should focus on optimizing the agricultural product market environment, while in the upper and middle reaches, the emphasis should be on improving agricultural support and protection policies and eliminating bottlenecks that restrict farmers’ livelihood choices.
The mechanism by which farmers’ poverty vulnerability influences their livelihood choices through risk perception is a multi-disciplinary research issue involving economics, management, psychology, and geography. There are still many theoretical and practical issues to explore. Future research should continue to deepen efforts in expanding sample sizes, refining mechanisms, dynamic simulations, and comparative analyses, aiming to provide a solid theoretical foundation and practical strategies for addressing farmers’ livelihood issues and contributing to rural revitalization, stable income increases for farmers, and agricultural and rural modernization.
7. Conclusion
The Yellow River Basin is an important ecological barrier and poverty-stricken area in China and serves as a major battleground for rural revitalization. Currently, rural areas in the Yellow River Basin are accelerating their transformation toward high-quality development, but some impoverished and vulnerable farmers still face challenges such as underdeveloped economies and fragile ecological environments. Traditional agricultural livelihood models are no longer sustainable, and the road to livelihood transformation is fraught with challenges. To overcome this development dilemma, it is necessary to continue to increase external support, such as industry support and infrastructure investment, while also paying close attention to internal factors such as farmers’ inherent endowments and cognitive levels. As revealed by the conclusions of this study, the cognitive biases and behavioral choices of impoverished and vulnerable farmers are key micro factors that constrain their livelihood capacity and sustainable transformation. Only by focusing on the farmers’ perspective and fully considering their risk perception characteristics can more precise and effective paths be developed to address farmers’ livelihood issues.
References
[1]. World Bank. (2000). World development report 2000/2001: Attacking poverty. Oxford University Press.
[2]. Chaudhuri, S., Jalan, J., & Suryahadi, A. (2002). Assessing household vulnerability to poverty from cross-sectional data: A methodology and estimates from Indonesia. Columbia University Department of Economics Discussion Paper.
[3]. Kuhl, J. (2003). Disaggregating household vulnerability—Analyzing fluctuations in consumption using a simulation approach. Manuscript, Institute of Economics, University of Copenhagen, 34(2), 2-5.
[4]. Calvo, C., & Dercon, S. (2005). Measuring individual vulnerability. Department of Economics Discussion Paper Series, 229(3), 1-30.
[5]. Wang, J., He, B., & Bi, J. (2022). New rural pension and the poverty vulnerability of low-income rural households: Based on precision poverty alleviation background and different poverty standards. Economic Theory and Economic Management, 3.
[6]. Zhu, J. H. (2019). Measurement, factor identification, and reduction strategies of urban residents’ family poverty vulnerability. Hebei University Journal (Philosophy and Social Sciences Edition), 44(03), 129-138.
[7]. Dutta, I., Foster, J., & Mishra, A. (2010). On measuring vulnerability to poverty. Working Papers, 37(4), 743-761.
[8]. Glewwe, P., & Hall, G. (2010). Are some groups more vulnerable to macroeconomic shocks than others? Hypothesis tests based on panel data from Peru. Journal of Development Economics, 56(1), 181-206.
[9]. Feng, J., Zhou, L., & Chen, Y. (2017). Research progress on poverty vulnerability. Chinese Desert, 37(06), 1261-1270.
[10]. Zou, W., & Zheng, H. (2014). Measurement and decomposition of household poverty vulnerability in China: A new analytical approach. Social Science Research, 54-65.
[11]. Fang, Y., & Zou, W. (2013). Capability investment, health shocks, and poverty vulnerability. Economic Dynamics, 07, 36-50.
[12]. Islam, A., & Maitra, P. (2012). Health shocks and consumption smoothing in rural households: Does microcredit have a role to play? Monash Economics Working Papers, 97(2), 232-243.
[13]. Fuente, A. D. L. (2010). Remittances and vulnerability to poverty in rural Mexico. World Development, 38(6), 828-839.
[14]. Liu, Q. J.(2020). Measurement and differentiation of vulnerability of farmers in typical deep poverty areas: Based on micro-survey data from inland arid areas. Chinese Journal of Agricultural Machinery and Chemistry, 41(07), 215-223.
[15]. Lin, Q. (2023). “Sending piglets” and “exchanging for cash”: An analysis of the effect of financial capital in mitigating poverty vulnerability—Based on tracking data of registered poverty households. Economics and Management, 37(06), 1-12.
[16]. Wan, G. H., Liu, F., & Zhang, Y. (2014). Decomposition of poverty vulnerability from an asset perspective: Empirical analysis based on Chinese household panel data. China Rural Economy, (04), 4-19.
Cite this article
Li,X. (2025). A study on the impact of poverty vulnerability on farmers’ livelihood choices from the perspective of risk perception: evidence from the Yellow River Basin. Journal of Applied Economics and Policy Studies,18(4),24-34.
Data availability
The datasets used and/or analyzed during the current study will be available from the authors upon reasonable request.
Disclaimer/Publisher's Note
The statements, opinions and data contained in all publications are solely those of the individual author(s) and contributor(s) and not of EWA Publishing and/or the editor(s). EWA Publishing and/or the editor(s) disclaim responsibility for any injury to people or property resulting from any ideas, methods, instructions or products referred to in the content.
About volume
Journal:Journal of Applied Economics and Policy Studies
© 2024 by the author(s). Licensee EWA Publishing, Oxford, UK. This article is an open access article distributed under the terms and
conditions of the Creative Commons Attribution (CC BY) license. Authors who
publish this series agree to the following terms:
1. Authors retain copyright and grant the series right of first publication with the work simultaneously licensed under a Creative Commons
Attribution License that allows others to share the work with an acknowledgment of the work's authorship and initial publication in this
series.
2. Authors are able to enter into separate, additional contractual arrangements for the non-exclusive distribution of the series's published
version of the work (e.g., post it to an institutional repository or publish it in a book), with an acknowledgment of its initial
publication in this series.
3. Authors are permitted and encouraged to post their work online (e.g., in institutional repositories or on their website) prior to and
during the submission process, as it can lead to productive exchanges, as well as earlier and greater citation of published work (See
Open access policy for details).
References
[1]. World Bank. (2000). World development report 2000/2001: Attacking poverty. Oxford University Press.
[2]. Chaudhuri, S., Jalan, J., & Suryahadi, A. (2002). Assessing household vulnerability to poverty from cross-sectional data: A methodology and estimates from Indonesia. Columbia University Department of Economics Discussion Paper.
[3]. Kuhl, J. (2003). Disaggregating household vulnerability—Analyzing fluctuations in consumption using a simulation approach. Manuscript, Institute of Economics, University of Copenhagen, 34(2), 2-5.
[4]. Calvo, C., & Dercon, S. (2005). Measuring individual vulnerability. Department of Economics Discussion Paper Series, 229(3), 1-30.
[5]. Wang, J., He, B., & Bi, J. (2022). New rural pension and the poverty vulnerability of low-income rural households: Based on precision poverty alleviation background and different poverty standards. Economic Theory and Economic Management, 3.
[6]. Zhu, J. H. (2019). Measurement, factor identification, and reduction strategies of urban residents’ family poverty vulnerability. Hebei University Journal (Philosophy and Social Sciences Edition), 44(03), 129-138.
[7]. Dutta, I., Foster, J., & Mishra, A. (2010). On measuring vulnerability to poverty. Working Papers, 37(4), 743-761.
[8]. Glewwe, P., & Hall, G. (2010). Are some groups more vulnerable to macroeconomic shocks than others? Hypothesis tests based on panel data from Peru. Journal of Development Economics, 56(1), 181-206.
[9]. Feng, J., Zhou, L., & Chen, Y. (2017). Research progress on poverty vulnerability. Chinese Desert, 37(06), 1261-1270.
[10]. Zou, W., & Zheng, H. (2014). Measurement and decomposition of household poverty vulnerability in China: A new analytical approach. Social Science Research, 54-65.
[11]. Fang, Y., & Zou, W. (2013). Capability investment, health shocks, and poverty vulnerability. Economic Dynamics, 07, 36-50.
[12]. Islam, A., & Maitra, P. (2012). Health shocks and consumption smoothing in rural households: Does microcredit have a role to play? Monash Economics Working Papers, 97(2), 232-243.
[13]. Fuente, A. D. L. (2010). Remittances and vulnerability to poverty in rural Mexico. World Development, 38(6), 828-839.
[14]. Liu, Q. J.(2020). Measurement and differentiation of vulnerability of farmers in typical deep poverty areas: Based on micro-survey data from inland arid areas. Chinese Journal of Agricultural Machinery and Chemistry, 41(07), 215-223.
[15]. Lin, Q. (2023). “Sending piglets” and “exchanging for cash”: An analysis of the effect of financial capital in mitigating poverty vulnerability—Based on tracking data of registered poverty households. Economics and Management, 37(06), 1-12.
[16]. Wan, G. H., Liu, F., & Zhang, Y. (2014). Decomposition of poverty vulnerability from an asset perspective: Empirical analysis based on Chinese household panel data. China Rural Economy, (04), 4-19.