


1. Introduction
As a core component of a country’s external sector, the current account provides insight into the interplay between savings, investment, and cross-border transactions, with significant implications for economic policy and global competitiveness.
In the field of current account studies, most scholars either use large country samples or focus on single countries, with limited research on regions like the EU. The EU stands out for its high level of integration, where members share a common monetary policy but keep their own fiscal policies, population structures, and financial systems. This setup has caused long-term differences in current account performance among member states. Consequently, the empirical results on the determinants of current account balance may not be applicable to the EU.
This study has two goals: first, to see if existing theories and findings apply to EU countries, and second, to introduce new variables not explored before. Some factors in EU countries remain underexplored. This paper will look into whether these factors influence the current account balance, considering macroeconomic and demographic factors, with GDP growth included as a control variable.
In summary, this study will analyze the determinants of current account balance from a saving-investment perspective. Given data availability and to avoid the impact of the 2008-2009 financial crisis, the study will focus on data from 11 EU countries (Spain, Italy, Germany, Portugal, France, Poland, Austria, Finland, Greece, Netherlands, and Belgium) between 2010 and 2023. Since most studies use complex methodologies, this paper will employ a simpler two-way fixed effects model to control for structural differences between countries and common shocks (e.g., the COVID-19 pandemic) in the same year. This approach aims to provide a basis for comparison with more complex methods in future research.
2. Literature review
2.1. Theorical evidence
From the identity perspective, the current account balance equals national savings minus domestic investment. various theoretical approaches have explored the key factors influencing a country's current account from various angles.
The Life-Cycle Hypothesis [2] suggests that people save during working years and consume more in youth and old age. Therefore, a high proportion of elderly or young people in a country can reduce overall savings, potentially causing a current account deficit.
Building on the life-cycle saving motive, the intertemporal consumption model highlights how individuals adjust consumption and saving to maximize utility. Barro (1974) extended this with fiscal settings, leading to Ricardian Equivalence, which suggests that when the government issues bonds to finance deficits, consumers save in anticipation of future tax hikes to repay the debt [5]. However, Abell (1990) systematically proposed the twin deficit hypothesis, which argues that a fiscal deficit leads to a current account deficit through insufficient savings, forcing the government to borrow externally [1]. Thus, a positive correlation exists between the fiscal and current account deficits. Empirical studies mostly support the twin deficit hypothesis.
The Feldstein-Horioka hypothesis (1979) focuses on the strong correlation between savings and investment, suggesting incomplete international capital mobility [14]. However, with the growth of global capital markets, cross-border capital flows have risen, making this hypothesis less relevant, known as the "Feldstein-Horioka puzzle." Obstfeld and Rogoff (1996) further argued that even with high capital mobility, the link between savings and investment may stem from countries adjusting to smooth consumption and respond to shocks [27]. Tobin and de Macedo (1980s), Mendoza (1991) pointed out that countries tend to favor domestic investment to avoid exchange rate and political risks [24]. French and Poterba (1991) emphasized that investors exhibit a home-country bias, preferring to invest in domestic assets [16].
As globalization deepens, terms of trade also becomes a significant factor. According to the Harberger-Laursen-Metzler effect [19, 23], when a country's terms of trade (ToT) improve, its real income increases. Based on the consumption smoothing motive, residents are less likely to spend the entire increase in income and tend to save more, leading to a current account surplus. Sachs (1981) emphasized the HLM effect is valid only if the trade shock is temporary.
Furthermore, the impact of the real exchange rate on the current account should also be considered. Changes in the real effective exchange rate affect the price of imports and exports in relation to the domestic currency. According to the Marshall-Lerner condition in early elasticity theory, if the sum of price elasticities of demand for imports and exports is greater than one, a depreciation of the exchange rate will ultimately improve the trade balance. An appreciation of the real exchange rate increases residents' purchasing power for foreign goods, boosting their wealth perception and stimulating consumption. This, in the short term, may reduce savings, potentially leading to a widening current account deficit.
2.2. Empirical evidence
Based on a review of extensive literature, current research can be categorized into three main aspects.
First, the differences in research scope. Existing studies have explored the determinants of current accounts in different countries and regions, including Nigeria [31], the Middle East and North Africa [3], OECD countries, EU and Eurozone members [3, 6, 18], and broader cross-country comparative studies [10, 12].
Second, the differences in research methods. Earlier studies mainly used cross-sectional data, including the HLM effect. Over time, panel data became more common for econometric analysis, with methods like unit root tests, cointegration tests, panel DOLS, and fixed effects models. For single-country studies, VAR models and impulse response functions are used for short-term dynamics, while ECM describes the adjustment to long-term equilibrium. More complex models, such as system GMM, have also been used [6], and Camarero et al. (2020) developed a time-varying parameter state-space model [7-8].
Third, the differences in research periods. This varies due to the different focuses of scholars. Some studies focus on shorter periods in earlier years, possibly due to the limitations of data processing technology. Others examine the role of the current account over a country’s historical development or investigate the changes in current accounts before and after certain events.
Fourth, the differences in explanatory variables. Scholars analyze current accounts from five perspectives: macroeconomic factors (e.g., oil imports), demographic factors (e.g., dependency ratios), financial factors (e.g., private credit), institutional factors (e.g., political constraints), and macroeconomic stability (e.g., per capita GDP growth). Some focus on one perspective [31], while others use multi-dimensional frameworks. Others conduct multi-faceted analyses. This study will also employ a multi-dimensional approach, examining macroeconomic, demographic, and stability factors.
In terms of demographics, although the results differ across countries, Chinn & Ito (2006) found that the youth dependency ratio is inversely related to the current account, while the old dependency ratio has no significant effect. However, Gerigk et al. (2018) found a nonlinear inverse relationship between the old dependency ratio and the current account but didn't explore it deeply [17]. Brissimis et al. (2013) found that both the elderly and youth dependency ratios were negatively correlated with current account balances in the Netherlands and Austria. Given the focus on European countries, this study will use the elderly dependency ratio to examine the relationship between demographics and current accounts in Europe [6].
Regarding fiscal deficits, most studies have found that fiscal deficits lead to a deterioration in current accounts, supporting the "twin deficits hypothesis" [6, 18]. However, exceptions include Germany and the Netherlands, which show a negative correlation, likely due to their structural surplus status [7]. However, it remains unclear whether this relationship applies to most European countries.
Regarding the real effective exchange rate, most literature suggests that an appreciation of the real effective exchange rate weakens export competitiveness, negatively affecting the current account [3, 18]. Yet Camarero et al. (2024) find mixed effects across countries [8].
In terms of private investment, several studies found a significant negative relationship with the current account, reflecting the widening savings-investment gap, i.e., domestic investment is not fully financed by domestic savings [6], contradicting the Feldstein-Horioka hypothesis.
Regarding ToT, Chinn & Ito (2006) found the overall impact insignificant, with a slight negative effect only in African countries [10]. Aristovnik (2006) found that a deterioration in ToT worsens the current account deficit [3]. İşcan (2000) found no significant impact of ToT shocks on the current account in countries with large non-traded goods sectors and stable financial markets like Canada and the US. Chinn & Prasad (2003) found empirical evidence supporting the Harberger-Laursen-Metzler effect in countries like Australia and New Zealand [12]. However, no scholars have systematically studied this effect in European countries.
3. Hypothesis
This study employs a two-way fixed effects model to examine the relationship between private investment, fiscal deficit, old dependency ratio, real effective exchange rate(REER), trade openness, and the current account balance. GDP growth is included as a control variable to account for macroeconomic differences across countries. The hypotheses are as follows:
\( {CA_{it}}=α+{β_{1}}{OldDependency_{it}}+{β_{2}}{Investment_{it}}+{β_{3}}{FiscalDeficit_{it}}+{β_{4}}{REER_{it}}+{β_{5}}{TredeOpen_{it}}+ {β_{6}}{GDPGrowth_{it}}+{U_{i}}+{λ_{t}}+{ε_{it}} \) (1)
3.1. Old dependency ratio
According to the life-cycle hypothesis [2], demographic structure affects national saving behavior. As the population ages, households may increase savings in anticipation of future expenditures, potentially improving the current account. While some studies [12] find no significant effect, others [17] report a significant and positive relationship. This study proposes:
H1: \( {β_{1}}⟩0 \)
3.2. Private investment
The Feldstein-Horioka hypothesis [14-15] suggests that when capital mobility is limited, saving and investment remain highly correlated. However, several empirical studies [6] find a significant negative link between private investment and the current account. This study assumes:
H2: \( {β_{2}}⟩0 \)
3.3. Fiscal deficit
The twin-deficit hypothesis [1] suggests that rising fiscal deficits crowd out private saving, prompting external borrowing to maintain balance, which worsens the current account. Although Camarero et al. (2024) find a positive association between fiscal deficits and current account deficits in Germany and the Netherlands, it is unclear whether this applies broadly [7-8]. This study assumes:
H3: \( {β_{3}}⟨0 \)
3.4. REER
The Marshall-Lerner condition states that if the sum of import and export price elasticities exceeds one, currency depreciation improves the trade balance. Most studies show that REER appreciation reduces export competitiveness and worsens the current account. However, Camarero et al. (2024) suggest that appreciation may attract capital inflows and improve the current account with high capital mobility [7-8]. This study assumes:
H4: \( {β_{4}}⟨0 \)
3.5. Trade of trade
The HLM effect suggests that improved ToT can boost income and saving, improving the current account. While theory indicates a positive link, most empirical studies show weak or insignificant effects [19, 23]. This study assumes:
H5: \( {β_{5}}⟩0 \)
4. Data
The empirical analysis explores the determinants of the current account of EU countries from 2010 to 2023. The study focuses on 11 EU countries: Spain, Italy, Germany, Portugal, France, Poland, Austria, Finland, Greece, the Netherlands, and Belgium. These countries were selected for their data availability and their relevance within the EU and global economy. Based on a review of the literature and computational constraints, the following variables were included: The current account variable is the ratio of the balance to nominal GDP, controlling for scale effects. The old dependency ratio is the ratio of the population aged 65 and above to the working-age population (typically aged 15 to 64). It reflects the economic burden of an aging population on the labor force. A higher old dependency ratio puts more pressure on public finances, savings, and investment, potentially affecting the current account balance. The private investment rate is private investment as a percent of GDP. The fiscal balance is equal to general government saving minus investment as a percent of GDP, and REER is the CPI-deflated real effective exchange rate. An increase in REER implies currency appreciation. Terms of trade(ToT) is measured as the sum of exports and imports relative to nominal GDP. A higher ToT indicates stronger trade links, impacting the current account via export competitiveness and import demand. The GDP growth represents the annual percentage change in real GDP. It reflects macroeconomic performance.The final dataset consists of 154 observations. As shown in Table 1, Table 1 summarizes the definition, symbol, data source, and dataset variable name for each indicator.
Table 1. Variable definitions and data sources
Symbol | Variable Name | Source | Variable in Dataset |
CA | Current account balance (as % of GDP) | IMF | ca_gdp |
DEM | Old-age dependency ratio (index) | World Bank | ln odr |
FB | Fiscal balance (as % of GDP) | IMF | fd_gdp |
IP | Private investment (as % of GDP) | World Bank | ln_inv_gdp |
REER | Real effective exchange rate (index, CPI-based) | World Bank | ln reer |
ToT | Terms of Trade (exports + imports as % of GDP) | World Bank | trade_open |
Y | Real GDP growth rate (annual %) | World Bank | gdp_growth |
To improve model fit and address skewness, this study applies logarithmic transformation to the private investment rate, old dependency ratio, and REER. As shown in Figure 1, Figure 1 shows that these variables are right-skewed initially, but become more symmetric and approximately normal after transformation. While the visual difference is subtle, regression results show a notable increase in R², indicating a better fit. Log transformation also reduces outlier influence, enhances parameter stability, and mitigates scale differences, improving comparability [28]. However, fiscal deficit and ToT include negative or zero values, so log transformation is not applicable. They are retained in their original form to preserve data integrity.

Figure 1. Distribution of key variable
5. Methodology
This study uses panel data regression which offers advantages over cross-sectional or time-series data by controlling unobserved heterogeneity, increasing degrees of freedom, and revealing dynamic relationships. However, accounting for both cross-sectional and time-series data can make model specification difficult, and if not handled properly, may lead to biased estimates [4].
As shown in Table 2, Table 2 demonstrates that the sources of variation in different variables exhibit significant heterogeneity. Private investment and the current account balance vary greatly across countries, while fiscal deficits, ToT, and GDP growth are mainly influenced by time. As shown in Figure 2, the trends in current account balances over time by country illustrate notable cross-country differences. While overall levels remained relatively stable, countries such as Germany and the Netherlands maintained consistent surpluses, whereas Greece and Poland recorded long-term deficits. Volatility increased around 2020, likely reflecting pandemic-related disruptions.
Taken together, these observations highlight the necessity of controlling for both country-specific unobserved heterogeneity and year-specific shocks. Therefore, a two-way fixed effects model is employed for panel data, with controls for country and year effects. The basic form of the model is as follows:
\( \begin{matrix}ca\_gd{p_{it}}=α & +{β_{1}}ln\_od{r_{it}}+{β_{2}}ln\_inv\_gd{p_{it}}+{β_{3}}fd\_gd{p_{it}}+{β_{4}}ln\_ree{r_{it}} \\ & +{β_{5}}trade\_ope{n_{it}}+{β_{6}}gdp\_growt{h_{it}}+{u_{i}}+{λ_{t}}+{ε_{it}} \\ \end{matrix} \) (2)
Where \( {u_{i}} \) captures unobserved country-specific effects, \( {λ_{t}} \) denotes time-specific effects, and \( {ε_{it}} \) is the idiosyncratic error term.
Given the annual panel data,This study examines long-term average relationships between macroeconomic variables and the current account, without distinguishing short- and long-term shocks.
Table 2. Variance decomposition of main variables (log-transformed)
Variable | Overall SD | Between SD | Within SD | Between Share (%) | Within Share (%) |
ca_gdp | 3.98 | 3.62 | 1.96 | 82.86 | 17.14 |
ln odr | 0.14 | 0.11 | 0.09 | 65.20 | 34.80 |
ln_inv_gdp | 0.19 | 0.18 | 0.07 | 92.11 | 7.89 |
fd_gdp | 2.95 | 1.55 | 2.55 | 27.55 | 72.45 |
ln reer | 0.04 | 0.03 | 0.03 | 52.58 | 47.42 |
trade_open | 2.63×10¹³ | 8.66×10¹² | 2.49×10¹³ | 10.84 | 89.16 |
gdp_growth | 3.38 | 1.02 | 3.24 | 9.08 | 90.92 |
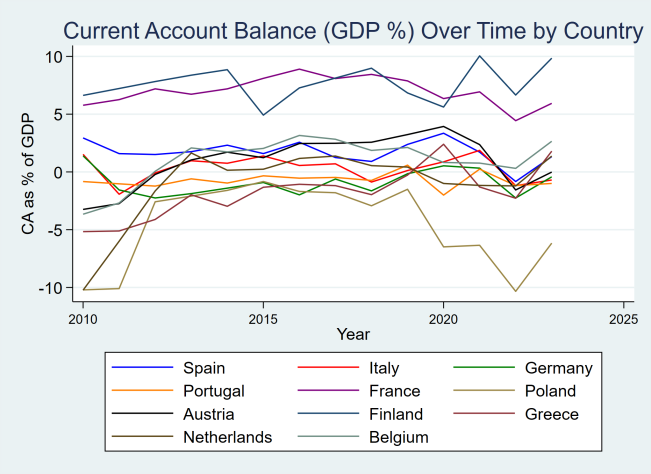
Figure 2. Current account balance (GDP%) over time by country
To test the robustness of the estimates, this study conducts two additional checks. First, the year 2020 is excluded to mitigate the potential distortions caused by the COVID-19 pandemic. Second, Nickel and Vansteenkiste (2008), by estimating a dynamic panel threshold model, argue that there exists potential endogeneity between fiscal deficits and current account balances [26]. To address simultaneity concerns in the relationship between fiscal policy and current account dynamics, the lagged fiscal balance is employed as an instrument to address simultaneity concerns in the relationship between fiscal policy and current account dynamics using a two-stage least squares estimation.
At the same time, to explore structural differences in the effects of key variables, heterogeneity analysis will be conducted. First, the sample is divided into high and low groups based on the medians of fiscal deficit and REER, followed by four separate subgroup regressions. Then, a time dummy variable (post2020) is created with 2020 as the threshold, and interaction terms with the old-age dependency ratio and ToT are added separately to test whether the marginal effects of these factors on the current account have changed after the pandemic.
6. Results
6.1. Descriptive statistics
Table 3. Descriptive statistics of main variables
Variable | Mean | Median | Std. Dev. | Min | Max |
ca_gdp | 0.8744 | 0.5380 | 3.9804 | -10.3357 | 10.0469 |
ln_odr | 3.4033 | 3.4073 | 0.1423 | 2.9454 | 3.6467 |
ln_inv_gdp | 2.9823 | 3.0132 | 0.1862 | 2.3952 | 3.2533 |
fd_gdp | -3.4462 | -2.9575 | 2.9515 | -11.5510 | 1.9500 |
ln_reer | 4.5757 | 4.5784 | 0.0382 | 4.4714 | 4.6694 |
trade_open | 2.36e+12 | -1.91e+11 | 2.63e+13 | -1.30e+13 | 3.17e+14 |
gdp_growth | 1.2191 | 1.5967 | 3.3783 | -10.9401 | 8.9311 |
Note: Variables such as ca_gdp, fd_gdp, and ln_inv_gdp are expressed as percentages of GDP. gdp_growth is the annual growth rate in percent. trade_open is the sum of exports and imports in current USD (billion). ln_odr and ln_reer are in natural logarithmic form
As shown in Table 3, Table 3 presents the descriptive statistics of the key variables. The mean the current account balance is 0.87, with a maximum of 10.05 and a minimum of -10.34, indicating significant cross-country differences. The average fiscal balance is -3.45, suggesting that fiscal deficits are common among the sample countries.
There is also notable variation in standard deviations across variables. The current account exhibits the highest volatility, followed by GDP growth and fiscal balance, implying greater heterogeneity. In contrast, the standard deviations of the real effective exchange rate and the old dependency ratio are relatively low, indicating more concentrated distributions. Although ToT shows the highest standard deviation, it is measured in billion USD and is therefore not directly comparable to the other variables. Overall, Table 3 reveals significant heterogeneity in the factors influencing current account balances across countries, providing a foundation for the panel regression analysis.
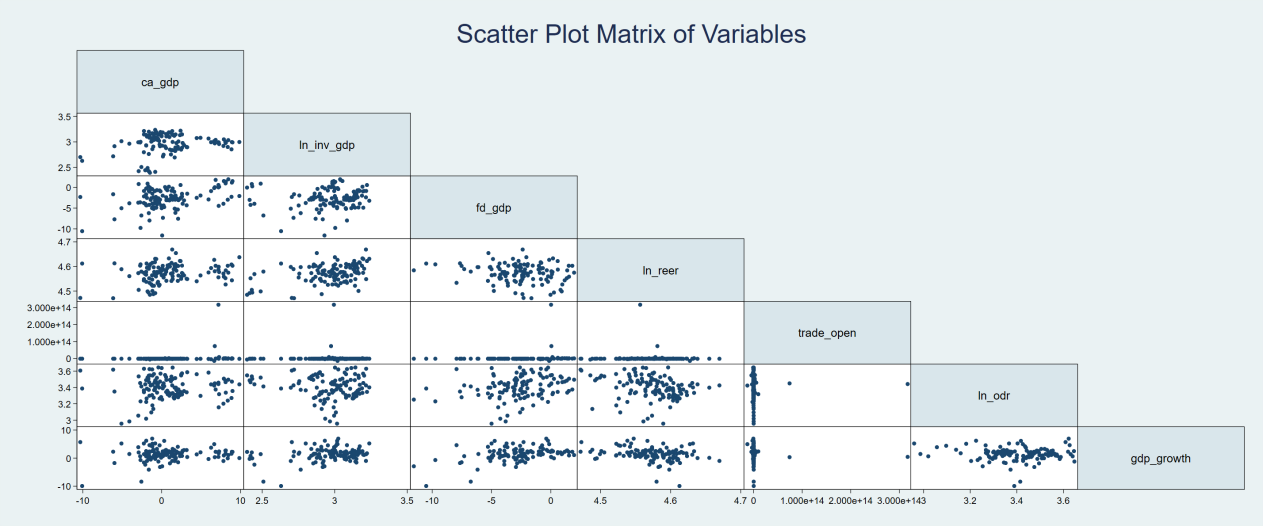
Figure 3. Scatter plot matrix of variables
As shown in Figure 3, Figure 3 presents a scatterplot matrix showing the relationships between the current account balance and key explanatory variables. Most variables do not exhibit clear linear patterns with the current account balance, indicating weak correlations that are difficult to assess visually. The REER displays a slight negative trend in parts of the sample, which may carry some economic significance. The ToT values are highly concentrated, forming nearly vertical distributions, suggesting limited variability and implying that its marginal effect may be difficult to identify within the sample period.
6.2. Main regression
Table 4. Regression results
Variable | Model with Log Variables | Model without Log Transformation | Log Variables, No Time Fixed Effects |
odr | -0.121(0.116) | -0.144(0.104) | -0.111**(0.048) |
inv_gdp | -0.260**(0.116) | -0.192**(0.093) | -0.177***(0.064) |
fd_gdp | 0.228***(0.062) | 0.213***(0.064) | 0.200***(0.060) |
reer | -0.007(0.005) | -0.007(0.005) | -0.007(0.005) |
Trade_open | 0.023(0.017) | 0.021(0.016) | 0.031**(0.014) |
gdp_growth | 0.018(0.031) | 0.007(0.031) | 0.006(0.030) |
R² | 0.916 | 0.911 | 0.891 |
AIC | 491.9 | 500.9 | 523.9 |
BIC | 510.1 | 519.1 | 539.9 |
Notes: Standard errors in parentheses. *, **, *** denote significance at the 10%, 5%, and 1% levels, respectively. ”ln” indicates log-transformed variables.
As shown in Table 4, Table 4 reports the estimation results from three model specifications. Column (2) applies logarithmic transformations to private investment, REER, and the old-age dependency ratio. Column (3) serves as a comparison model using the untransformed variables.Column (4) employs log-transformed variables with country fixed effects only, omitting time effects, to assess the impact of time fixed effects.
Comparing Columns (2) and (3), the former yields a higher R², indicating better model fit and explanatory power. This result further supports the validity of the logarithmic transformation. Overall, Column (2) is chosen as the baseline specification due to its better fit and balanced control of structural and temporal heterogeneity.
\( \begin{matrix}\begin{matrix}{CA_{it}}= & -0.121{ln{ODR}_{it}}-0.260{ln{INV}_{it}}+0.228 {FD_{it}} \\ & -0.007{ln{REER}_{it}}+0.023 {TRADE_{it}}+0.018 {GDP_{it}}+{u_{i}}+{λ_{t}}+{ε_{it}} \\ \end{matrix} \\ \end{matrix} \) (3)
Firstly, the old dependency ratio is statistically insignificant with a negative sign, indicating that H1 is not rejected and the life-cycle hypothesis does not hold. However, the sign is consistent with theoretical expectations and still holds economic significance. Similar to Chinn and Prasad (2003), the old-age dependency ratio becomes significantly negative without time fixed effects, supporting the life-cycle hypothesis [12]. This highlights the sensitivity of results to model specification, which is further explored in the heterogeneity analysis.
Secondly, private investment is statistically significant and negatively associated with the current account balance. This suggests that domestic saving only partially finances private investment, rejecting H2 and contradicting the Feldstein-Horioka hypothesis [14-15]. The result aligns with [6], indicating that EU countries are financially open with high capital mobility.
Thirdly, the fiscal deficit is statistically significant, with a coefficient between 0 and 1. This implies that rising deficits are only partly offset by private saving, worsening the current account. Accordingly, this research rejects the Ricardian equivalence hypothesis and provides partial support for the twin deficits hypothesis, given that the coefficient is less than one. This finding aligns with Camarero et al. (2024), suggesting that their broader-sample conclusions also hold in the EU context [7-8].
Fourthly, although REER is not statistically significant in any specification, a weak negative pattern observed in the scatterplots (as noted earlier) suggests it may hold economic relevance under certain conditions. Its insignificance may stem from several factors: limited sample size may reduce estimation precision; low variability in REER during the study period may obscure its effect; and model misspecification or omitted variables could further weaken its explanatory power.
Fifthly, ToT is not statistically significant in the baseline specification, so hypothesis H5 cannot be rejected, nor can the HLM effect be confirmed [19]. This may be due to a relatively small sample size or limited variability in ToT during the study period. Interestingly, when time fixed effects are excluded, the coefficient on ToT becomes significantly positive, which partially aligns with the theoretical expectation of the HLM effect. This sensitivity is further explored in the heterogeneity analysis.
6.3. Robustness analysis
To further verify the robustness of the baseline regression results, two robustness checks are conducted in this study. Firstly, given the large-scale global economic disruptions from the COVID-19 pandemic in 2020 (IMF, 2020), which may have caused structural breaks, 2020 observations were excluded, and the two-way fixed effects model was re-estimated. As shown in The results of Model 1 in Table 5 are largely consistent with the baseline regression:the signs and significance of key variables remain unchanged, indicating that the findings are robust and not sensitive to the 2020 outlier.
Secondly, to address potential endogeneity, the one-period lag of the fiscal deficit is used as an instrumental variable, and a two-stage least squares estimation is conducted [32]. The first-stage regression shows an F-statistic well above the conventional threshold [30], confirming the instrument's relevance and strength (see Table 5). As shown in Table 6 (Model 2), the estimated coefficients of key variables are highly consistent with the baseline results, further supporting the model’s robustness and indicating no significant endogeneity bias. In summary, this study are robust and reliable. Note that only two robustness checks are applied, and further extensions could be explored in future research.
Table 5. First‑stage regression
Variable | Coefficient (Std. Error) |
L_fd_gdp ln _inv_gdp ln _odr ln _reer trade_open gdp_growth | 0.744*** (0.065) -0.933 (0.738) 2.132** (1.075) 3.045 (3.422) 0.000** (0.000) 0.187** (0.073) |
Constant | -18.507 (15.251) |
Observations | 121 |
Notes: Robust standard errors in parentheses.*p < 0.1, **p < 0.05, ***p < 0.01.Year dummies included but not reported.
Table 6. Robustness checks
Model 1 | Model 2 | |
ln _inv_gdp fd_gdp fd_gdp_hat ln _odr ln _reer trade_open gdp_growth | -15.647*** (1.793) 0.265*** (0.077) -1.567 (3.368) 5.143 (5.827) 0.000 (0.000) 0.058 (0.079) | -0.921 (1.684) 0.809*** (0.222) -0.109 (3.394) 41.205*** (10.888) 0.000*** (0.000) 0.082 (0.267) |
Constant | 29.981 (31.425) | -184.062*** (51.235) |
Observations | 143 | 121 |
Notes: Robust standard errors in parentheses; *** p < 0.01. Both models include country and year fixed effects.
6.4. Heterogeneity analysis
Potential heterogeneity in the model results is further examined across macroeconomic conditions and structural factors, using both subgroup regressions and interaction terms. Specifically, four dimensions are considered: fiscal deficit, REER, old dependency ratio, and ToT.
For fiscal deficit and REER, the sample is split into high and low groups based on the median, followed by separate regressions. For old-age dependency ratio and ToT, interaction terms with a post-2020 dummy variable are included to capture potential shifts in their effects after the COVID-19 outbreak.
In terms of fisical deficits, as shown in Table 7, countries with higher fiscal deficits often face tighter budget constraints and reduced policy flexibility, which may alter the responsiveness of external balances to fiscal dynamics [6]. The regression results show that the effect of fiscal deficits remains positive and statistically significant in both groups, but the coefficient is notably larger in the low-deficit group. This suggests that the marginal impact of fiscal deficits on current account balances is stronger when countries have more fiscal space, highlighting a degree of heterogeneity in the fiscal–external balance relationship. Interestingly, ToT becomes significant only in the low-deficit group, indicating that trade integration may exert a stronger influence in fiscally healthier economies.
Regarding REER, as shown in Table 7, a higher REER reflects currency appreciation and declining export competitiveness, while a lower REER may support exports and improve external balances (Chinn, 2006). Subgroup results reveal that the negative effect of private investment on the current account is significant across both groups, but considerably larger in the high-REER group. This suggests that exchange rate conditions affect the sensitivity of capital flows to external imbalances by influencing investment behavior, import intensity, and financing conditions.
In terms of old dependency ratio, as shown in Table 8, the coefficient of this interaction term is positive but remains marginally insignificant (p = 0.144), consistent with the main results. This suggests that although the pandemic may have interfered with the expected negative link between aging and current account balances, the evidence remains inconclusive. One plausible explanation is that demographic shifts affect savings behavior gradually, with stronger effects observable only over longer horizons [12]. Moreover, the limited number of post-2020 observations may hinder the detection of such delayed effects, and the insignificance may not be fully attributable to the pandemic alone.
In terms of ToT, as shown in Table 8, the interaction term is statistically insignificant, suggesting that the pandemic didn’t substantially alter ToT's marginal impact on current account balances, consistent with prior findings. This may reflect the relatively high and stable level of ToT across EU countries, reducing cross-country variation and limiting the detectability of its effects. Moreover, the short post-pandemic window may not capture structural shifts in trade behavior. Future research could extend the sample period or use alternative measures of global economic uncertainty to further explore trade integration's role in external balances.
Table 7. Heterogeneity tests: high/low fiscal deficit & REER
High Fiscal Deficit | Low Fiscal Deficit | High REER | Low REER | |
ln(Inv/GDP) fd_gdp ln _odr ln _reer trade_open gdp_growth | -14.864*** (2.716) 0.326** (0.130) 3.027 (4.866) -5.423 (8.094) 0.000 (0.000) -0.183 (0.136) | -13.629** (5.849) 0.613** (0.279) 3.148 (8.107) 11.869 (9.806) 0.000** (0.000) 0.019 (0.197) | -24.115*** (4.124) 0.282** (0.135) 1.604 (4.741) -10.016 (15.686) -0.000 (0.000) 0.168 (0.179) | -8.459** (3.122) 0.206 (0.144) 10.874 (7.718) -5.268 (13.099) -0.000 (0.000) -0.247 (0.178) |
Constant | 61.449 (47.033) | -18.627 (66.863) | 115.572 (82.200) | 12.910 (64.966) |
Observations | 81 | 40 | 59 | 60 |
Notes: Robust standard errors in parentheses; ***p < 0.01, **p < 0.05, *p < 0.1. All models include country and year fixed effects.
Table 8. Interaction efects with post-2020 dummy
Model1: Ln_odr×post2020 | Model2:trade_open×post2020 | |
ln_odr | -0.700 (3.390) | -0.559 (3.418) |
odr_covid/trade_covid | 4.266 (2.901) | 2.02e-14 (1.14e-13) |
ln_inv_gdp | -17.13*** (2.018) | -15.90*** (1.849) |
fd_gdp | 0.255*** (0.0773) | 0.245*** (0.0781) |
ln_reer | 10.07 (6.562) | 5.389 (5.831) |
trade_open | 8.64e-16 (4.44e-15) | 3.24e-16 (4.47e-15) |
gdp_growth | 0.0756 (0.0728) | 0.0721 (0.0734) |
Constant | 4.780 (33.75) | 26.30 (30.80) |
Observations | 154 | 154 |
Note: Robust standard errors in parentheses. * p < 0. 1, ** p < 0.05, *** p < 0.01
7. Conclusion
This study examines the key factors influencing current account balances in 11 EU member states from 2010 to 2023. Unlike previous research, it focuses on the EU as an integrated yet diverse economic bloc, aiming to assess the relevance of traditional macroeconomic theories in the EU context and identify region-specific factors.
First, the empirical analysis reveals that private investment and fiscal deficits have significant effects on current account balances. Specifically, increased private investment reduces current account surpluses, indicating relatively liberalized capital mobility in the EU and contradicting the Feldstein–Horioka hypothesis [14-15]. Fiscal deficits are positively associated with current account deficits, which contradicts the Ricardian equivalence hypothesis and partially supports the twin deficits hypothesis, consistent with Rajib Das et al. In contrast, old dependency ratio, REER, and ToT do not exhibit stable or statistically significant effects in the baseline model, indicating that their influence may be constrained by the institutional and structural specificities of the EU or limited by data availability.
Next, the robustness checks confirm the reliability of the main findings. When the year 2020 marked by the COVID-19 pandemic is excluded, the direction and significance of the key coefficients remain unchanged. Additionally, using the lagged fiscal deficit as an instrumental variable in a two-stage least squares estimation addresses potential endogeneity concerns, further reinforcing the robustness and credibility of the results.
Furthermore, the heterogeneity analysis highlights that the impact of fiscal deficits and private investment on the current account varies across different economic conditions. Their effects are more pronounced under high fiscal deficits and stronger REER levels, respectively. In contrast, post-2020 interaction terms for aging and ToT remains insignificant, suggesting limited short-term shifts. These findings underscore the need to consider structural and macroeconomic differences when assessing external imbalances in the EU context.
Nevertheless, this study is subject to several limitations. First, the sample is limited to 11 EU countries over the period 2010–2023; future research could expand the country coverage and time span. Second, the model includes a limited set of control variables, and does not account for structural or institutional factors such as policy uncertainty. Finally, this paper focuses on direct effects and does not explore potential mediation or moderation mechanisms, which could be addressed in future research using structural equation modeling or interaction-based frameworks.
In conclusion, this study provides new empirical evidence on the determinants of current account balances in the EU, confirming the partial applicability of traditional international macroeconomic theories while revealing region-specific mechanisms. Despite a unified monetary policy, fiscal and exchange rate heterogeneity has led to divergent external balance dynamics across countries. These findings suggest that policies adapted to country-specific structural conditions are key to sustaining external economic balance within the EU.
References
[1]. Abell, J. D. (1990). Twin deficits during the 1980s: An empirical investigation. Journal of Macroeconomics, 12(1), 81–96.
[2]. Ando, A., & Modigliani, F. (1963). The "life cycle" hypothesis of saving: Aggregate implications and tests. The American Economic Review, 53(1), 55–84.
[3]. Aristovnik, A. (2006). The determinants of current account balances in the Central and Eastern European countries – the role of fiscal policy. MPRA Paper No. 730.
[4]. Baltagi, B. H. (2005). Econometric Analysis of Panel Data (3rd ed.). Chichester: John Wiley & Sons.
[5]. Barro, R. J. (1974). Are Government Bonds Net Wealth? Journal of Political Economy, 82(6), 1095–1117.
[6]. Brissimis, S. N., Hondroyiannis, G., Papazoglou, C., Tsaveas, N. T., & Vasardani, M. A. (2013). Current account determinants and external sustainability in periods of structural change. Economic Change and Restructuring, 46(1), 83–108.
[7]. Camarero, M., Carrion-i-Silvestre, J. L., & Tamarit, C. (2024). Current account dynamics in European countries: Evidence from panel data. Unpublished manuscript / Lecture material.
[8]. Camarero, M., Carrion-i-Silvestre, J. L., Ordóñez, J., & Tamarit, C. (2024). Fiscal policy, global shocks, and external balances: evidence from a panel of countries. Empirical Economics. https://doi.org/10.1007/s00181-024-02369-3
[9]. Chinn, M. D. (2006). A primer on real effective exchange rates. NBER Working Paper No. 11521. Cambridge, MA: National Bureau of Economic Research.
[10]. Chinn, M. D., & Ito, H. (2006). What matters for financial development? Capital controls, institutions, and interactions. Journal of Development Economics, 81(1), 163–192.
[11]. Chinn, M. D., & Ito, H. (2008). A new measure of financial openness. Journal of Comparative Policy Analysis, 10(3), 309–322.
[12]. Chinn, M. D., & Prasad, E. S. (2003). Medium-term determinants of current accounts in industrial and developing countries: An empirical exploration. Journal of International Economics, 59(1), 47–76.
[13]. Das, R., Bhattacharya, S., & Ghosh, M. (2019). Revisiting the twin-deficit hypothesis: Evidence from India. Economic Modelling, 81, 168–180.
[14]. Feldstein, M., & Horioka, C. (1979). Domestic saving and international capital flows. Economic Journal, 90(358), 314–329.
[15]. Feldstein, M., & Horioka, C. (1979). Domestic Savings and International Capital Flows. NBER Working Paper No. 0310. Cambridge, MA: National Bureau of Economic Research.
[16]. French, K. R., & Poterba, J. M. (1991). Investor diversification and international equity markets. American Economic Review, 81(2), 222–226.
[17]. Gerigk, J., Rinawi, M., & Wicht, A. (2018). Demographics and the current account. Aussenwirtschaft, 69(1), 45–76.
[18]. Gossé, J. B., & Serranito, F. (2014). Long-run determinants of current accounts in the G7. Applied Economics, 46(13), 1562–1573.
[19]. Harberger, A. C. (1950). Currency depreciation, income, and the balance of trade. Journal of Political Economy, 58(1), 47–60.
[20]. Harberger, A. C., Laursen, S., & Metzler, L. A. (1950). The effects of terms of trade changes on saving and investment. Review of Economics and Statistics, 32(2), 152–166.
[21]. International Monetary Fund. (2020). World Economic Outlook: The Great Lockdown. April 2020.
[22]. İşcan, T. B. (2000). The terms of trade, productivity growth and the current account. Journal of Monetary Economics, 45(3), 587–611.
[23]. Laursen, S., & Metzler, L. A. (1950). Flexible exchange rates and the theory of employment. The Review of Economics and Statistics, 32(4), 281–299.
[24]. Mendoza, E. G. (1991). Real business cycles in a small open economy. American Economic Review, 81(4), 797–818.
[25]. Modigliani, F., & Brumberg, R. (1954). Utility analysis and the consumption function: An interpretation of cross-section data. In K. K. Kurihara (Ed.), Post-Keynesian Economics (pp. 388–436). New Brunswick: Rutgers University Press.
[26]. Nickel, C., & Vansteenkiste, I. (2008). Fiscal policies, the current account and Ricardian equivalence. ECB Working Paper No. 935. Frankfurt: European Central Bank.
[27]. Obstfeld, M., & Rogoff, K. (1996). Foundations of International Macroeconomics. Cambridge, MA: MIT Press.
[28]. Phillips, P. C. B. (2019). Log transformations and the treatment of outliers in regression. Econometric Reviews, 38(6), 585–602.
[29]. Sachs, J. D. (1981). The Current Account and Macroeconomic Adjustment in the 1970s. Brookings Papers on Economic Activity, 1981(1), 201–268.
[30]. Stock, J. H., & Yogo, M. (2005). Testing for weak instruments in linear IV regression. In D. W. K. Andrews & J. H. Stock (Eds.), Identification and Inference for Econometric Models: Essays in Honor of Thomas Rothenberg (pp. 80–108). Cambridge: Cambridge University Press.
[31]. Uneze, E., & Ekor, M. (2012). Terms of trade and current account balances in oil-producing African countries. African Development Review, 24(3), 227–238.
[32]. Wooldridge, J. M. (2010). Econometric Analysis of Cross Section and Panel Data (2nd ed.). Cambridge, MA: MIT Press.
Cite this article
Liang,H. (2025). Determinants of current account balances: an empirical analysis based on European Union economies. Journal of Applied Economics and Policy Studies,18(4),55-65.
Data availability
The datasets used and/or analyzed during the current study will be available from the authors upon reasonable request.
Disclaimer/Publisher's Note
The statements, opinions and data contained in all publications are solely those of the individual author(s) and contributor(s) and not of EWA Publishing and/or the editor(s). EWA Publishing and/or the editor(s) disclaim responsibility for any injury to people or property resulting from any ideas, methods, instructions or products referred to in the content.
About volume
Journal:Journal of Applied Economics and Policy Studies
© 2024 by the author(s). Licensee EWA Publishing, Oxford, UK. This article is an open access article distributed under the terms and
conditions of the Creative Commons Attribution (CC BY) license. Authors who
publish this series agree to the following terms:
1. Authors retain copyright and grant the series right of first publication with the work simultaneously licensed under a Creative Commons
Attribution License that allows others to share the work with an acknowledgment of the work's authorship and initial publication in this
series.
2. Authors are able to enter into separate, additional contractual arrangements for the non-exclusive distribution of the series's published
version of the work (e.g., post it to an institutional repository or publish it in a book), with an acknowledgment of its initial
publication in this series.
3. Authors are permitted and encouraged to post their work online (e.g., in institutional repositories or on their website) prior to and
during the submission process, as it can lead to productive exchanges, as well as earlier and greater citation of published work (See
Open access policy for details).
References
[1]. Abell, J. D. (1990). Twin deficits during the 1980s: An empirical investigation. Journal of Macroeconomics, 12(1), 81–96.
[2]. Ando, A., & Modigliani, F. (1963). The "life cycle" hypothesis of saving: Aggregate implications and tests. The American Economic Review, 53(1), 55–84.
[3]. Aristovnik, A. (2006). The determinants of current account balances in the Central and Eastern European countries – the role of fiscal policy. MPRA Paper No. 730.
[4]. Baltagi, B. H. (2005). Econometric Analysis of Panel Data (3rd ed.). Chichester: John Wiley & Sons.
[5]. Barro, R. J. (1974). Are Government Bonds Net Wealth? Journal of Political Economy, 82(6), 1095–1117.
[6]. Brissimis, S. N., Hondroyiannis, G., Papazoglou, C., Tsaveas, N. T., & Vasardani, M. A. (2013). Current account determinants and external sustainability in periods of structural change. Economic Change and Restructuring, 46(1), 83–108.
[7]. Camarero, M., Carrion-i-Silvestre, J. L., & Tamarit, C. (2024). Current account dynamics in European countries: Evidence from panel data. Unpublished manuscript / Lecture material.
[8]. Camarero, M., Carrion-i-Silvestre, J. L., Ordóñez, J., & Tamarit, C. (2024). Fiscal policy, global shocks, and external balances: evidence from a panel of countries. Empirical Economics. https://doi.org/10.1007/s00181-024-02369-3
[9]. Chinn, M. D. (2006). A primer on real effective exchange rates. NBER Working Paper No. 11521. Cambridge, MA: National Bureau of Economic Research.
[10]. Chinn, M. D., & Ito, H. (2006). What matters for financial development? Capital controls, institutions, and interactions. Journal of Development Economics, 81(1), 163–192.
[11]. Chinn, M. D., & Ito, H. (2008). A new measure of financial openness. Journal of Comparative Policy Analysis, 10(3), 309–322.
[12]. Chinn, M. D., & Prasad, E. S. (2003). Medium-term determinants of current accounts in industrial and developing countries: An empirical exploration. Journal of International Economics, 59(1), 47–76.
[13]. Das, R., Bhattacharya, S., & Ghosh, M. (2019). Revisiting the twin-deficit hypothesis: Evidence from India. Economic Modelling, 81, 168–180.
[14]. Feldstein, M., & Horioka, C. (1979). Domestic saving and international capital flows. Economic Journal, 90(358), 314–329.
[15]. Feldstein, M., & Horioka, C. (1979). Domestic Savings and International Capital Flows. NBER Working Paper No. 0310. Cambridge, MA: National Bureau of Economic Research.
[16]. French, K. R., & Poterba, J. M. (1991). Investor diversification and international equity markets. American Economic Review, 81(2), 222–226.
[17]. Gerigk, J., Rinawi, M., & Wicht, A. (2018). Demographics and the current account. Aussenwirtschaft, 69(1), 45–76.
[18]. Gossé, J. B., & Serranito, F. (2014). Long-run determinants of current accounts in the G7. Applied Economics, 46(13), 1562–1573.
[19]. Harberger, A. C. (1950). Currency depreciation, income, and the balance of trade. Journal of Political Economy, 58(1), 47–60.
[20]. Harberger, A. C., Laursen, S., & Metzler, L. A. (1950). The effects of terms of trade changes on saving and investment. Review of Economics and Statistics, 32(2), 152–166.
[21]. International Monetary Fund. (2020). World Economic Outlook: The Great Lockdown. April 2020.
[22]. İşcan, T. B. (2000). The terms of trade, productivity growth and the current account. Journal of Monetary Economics, 45(3), 587–611.
[23]. Laursen, S., & Metzler, L. A. (1950). Flexible exchange rates and the theory of employment. The Review of Economics and Statistics, 32(4), 281–299.
[24]. Mendoza, E. G. (1991). Real business cycles in a small open economy. American Economic Review, 81(4), 797–818.
[25]. Modigliani, F., & Brumberg, R. (1954). Utility analysis and the consumption function: An interpretation of cross-section data. In K. K. Kurihara (Ed.), Post-Keynesian Economics (pp. 388–436). New Brunswick: Rutgers University Press.
[26]. Nickel, C., & Vansteenkiste, I. (2008). Fiscal policies, the current account and Ricardian equivalence. ECB Working Paper No. 935. Frankfurt: European Central Bank.
[27]. Obstfeld, M., & Rogoff, K. (1996). Foundations of International Macroeconomics. Cambridge, MA: MIT Press.
[28]. Phillips, P. C. B. (2019). Log transformations and the treatment of outliers in regression. Econometric Reviews, 38(6), 585–602.
[29]. Sachs, J. D. (1981). The Current Account and Macroeconomic Adjustment in the 1970s. Brookings Papers on Economic Activity, 1981(1), 201–268.
[30]. Stock, J. H., & Yogo, M. (2005). Testing for weak instruments in linear IV regression. In D. W. K. Andrews & J. H. Stock (Eds.), Identification and Inference for Econometric Models: Essays in Honor of Thomas Rothenberg (pp. 80–108). Cambridge: Cambridge University Press.
[31]. Uneze, E., & Ekor, M. (2012). Terms of trade and current account balances in oil-producing African countries. African Development Review, 24(3), 227–238.
[32]. Wooldridge, J. M. (2010). Econometric Analysis of Cross Section and Panel Data (2nd ed.). Cambridge, MA: MIT Press.