


1. Introduction
Since its establishment, China's A-share market has frequently experienced significant volatility, giving rise to what has been termed the "high volatility puzzle" [1]. To explain the excessive volatility observed in China's capital market, previous studies have primarily explored factors such as margin financing and securities lending, market sentiment, and returns [1-3]. However, most of these studies have overlooked the potential impact of stock price—a most fundamental and easily accessible piece of information—on excessive market volatility [4].
Prior research has mainly focused on stock returns rather than stock prices. According to the Efficient Market Hypothesis (EMH), future stock price movements cannot be predicted based on historical price information; thus, analyzing relative price changes, i.e., returns, serves as a better test of market efficiency and information reflection [7, 8]. Additionally, the statistical properties of returns are more stable, making them more robust for analysis [9], and returns provide a more direct and effective measure of investment performance and risk [10].
However, in actual market practice, investors pay far more attention to stock prices than to returns. In mature financial markets, stock prices are generally seen as fully reflecting all relevant information. In contrast, the situation in China's A-share market is quite different. Due to information asymmetry, an imbalanced investor structure, and strong market sentiment, stock prices often fail to fully reflect fundamental information, leading to dislocations between price movements and underlying fundamentals [4]. From a behavioral finance perspective, investors often display characteristics of bounded rationality during the decision-making process. Numerous studies have shown that investors commonly exhibit a "nominal price illusion," whereby they place excessive emphasis on a stock’s absolute price while ignoring its returns. This psychological bias leads investors to mistakenly believe that low-priced stocks offer greater upside potential, while high-priced stocks appear "expensive" [18]. In China's unique market environment—where retail investors dominate and overall financial literacy remains relatively low—such price illusion effects may be further amplified. Recent research has found that after the loosening of price limit restrictions on the ChiNext Market, the extreme volatility of low-priced stocks significantly increased [4], providing a natural experimental setting to explore the relationship between price attention and volatility. Against this theoretical and practical backdrop, this study aims to uncover the specific mechanisms through which investor attention to stock prices influences market volatility.
Employing a fixed-effects panel regression model complemented by descriptive statistical analysis, this study conducts an empirical investigation into the relationship between investor attention to absolute stock prices and the volatility of low-priced stocks in China's A-share market. It seeks to determine whether excessive attention to stock prices is a key driver of heightened volatility among low-priced stocks and further verify the existence of the "low-price, high-volatility" phenomenon.
The marginal contributions of this paper are twofold. First, it innovates and improves upon research methods. By applying a fixed-effects panel regression model and conducting subgroup tests, it effectively controls for individual and time-invariant characteristics, uses exogenous shocks from policy changes for causal inference, and accurately assesses the impact of stock price on volatility, thereby significantly enhancing the accuracy and robustness of the research findings. Second, it provides an in-depth analysis of the intrinsic link between investors' excessive attention to absolute stock prices and the volatility of low-priced stocks in China's A-share market. The study finds that lower stock prices are associated with greater volatility, thus confirming the "low-price, high-volatility" phenomenon. This finding not only offers a new perspective for understanding how psychological biases affect stock price volatility but also, by taking into account the unique institutional context of China's A-share market, opens new avenues and insights for research on volatility mechanisms in emerging markets.
2. Literature review and research hypotheses
2.1. Stock prices and volatility
There exists a connection between stock prices and returns: the lower the stock price, the higher the return, indicating the presence of a low-priced stock premium [5]. From the perspective of behavioral finance, investors’ "nominal price illusion" is regarded as a major factor behind this anomaly. Irrational investors mistakenly believe that, compared to high-priced stocks, low-priced stocks have less downside risk and greater upside potential, thus showing a preference for investing in low-priced stocks and assigning them a positive premium [13-14], thereby generating the low-priced stock premium effect. Further studies have shown that professional actors in the market, such as securities analysts, also hold significantly higher return expectations for low-priced stocks compared to high-priced ones [6], suggesting that investors’ future return expectations are substantially influenced by nominal price illusion, subconsciously perceiving low-priced stocks as having greater appreciation potential.
Existing research also indicates that low-priced stocks are associated with higher volatility risks. The low-priced stock effect was first observed in the U.S. market, where low-priced stocks not only achieved significantly higher returns but also exhibited markedly higher price volatility [15]. The emergence of the high-volatility phenomenon among low-priced stocks is not directly caused by their low prices, but rather by the "low quality" of the companies themselves. For "high-quality" companies, low stock prices do not correspond with high risk [16]. Strong (1983) found that company managers could use stock splits to achieve an optimal price level, thus eliminating systematic differences in risk across stocks at different price levels. Christie (1982) discovered that financial leverage could partially explain the high-risk phenomenon observed in low-priced stocks. More recently, Lu (2024) explained the causal relationship between stock prices and volatility from the dual perspectives of investor cognitive bias and information diffusion, arguing that stock news announcements may cause investors to confuse returns with prices. When investors exhibit "absolute price attention," stronger price reversals are likely to occur in low-priced stocks.
2.2. Absolute price attention
"Ratio bias" in the financial domain refers to a widespread cognitive bias where investors focus more on the numerator while neglecting the denominator, leading to a confusion between stock prices and returns [1]. This bias causes investors to believe that similar information should result in similar absolute price changes, rather than similar percentage returns—this phenomenon is termed "absolute price attention." Absolute price attention amplifies volatility, as it causes investors to overreact and magnify market noise. When investors excessively focus on price changes, herd behavior and positive feedback trading are triggered, further intensifying price fluctuations [18]. The strength of this cognitive bias is influenced by the numerical values themselves: the smaller the numerator, the more pronounced the bias [20], thereby making absolute price attention even more salient in low-priced stocks. Accordingly, this paper proposes the following research hypotheses:
H1: Absolute price attention positively affects the volatility of low-priced stocks.
H2: Changes in price limit policies moderate the impact of absolute price attention on the volatility of low-priced stocks.
H3: The lower the stock price, the greater the volatility, indicating the existence of a high-volatility phenomenon among low-priced stocks.
3. Empirical analysis
Building on the research by Lu and Yan (2024), it has been shown that investors in China's A-share market pay significantly more attention to the absolute price of stocks rather than to their returns. This phenomenon of "nominal price illusion" leads to more pronounced volatility among low-priced stocks. Specifically, their study found that after the price limit restrictions on the ChiNext Market were relaxed, extreme stock price fluctuations increased significantly, primarily concentrated among low-priced stocks. Based on this, the present study adopts the methodology of Lu and Yan (2024) and employs a fixed effects panel regression model to analyze daily trading data of A-share listed companies on the Shanghai and Shenzhen stock exchanges from 2021 to June 2024. The aim is to further verify whether investors' excessive attention to stock prices is a key driver of increased volatility among low-priced stocks.
3.1. Data sources
The study selects daily trading data of A-share listed companies on the Shanghai and Shenzhen stock exchanges from 2021 to June 2024 as the research sample. The data are sourced from the CSMAR database provided by GTA. Sample selection criteria are as follows: (1) Exclude financial sector companies and ST-designated companies; (2) Exclude stocks listed after January 1, 2024; (3) Exclude stocks with negative net assets; (4) Given the particularity of IPOs in China, exclude data from the first 60 trading days after listing; (5) In calculating lottery-like stock characteristics, exclude stocks whose monthly trading days account for less than 70% of the total trading days in the month; (6) For all continuous variables (except the number and frequency of extreme volatility days), apply 1% and 99% winsorization to mitigate the influence of outliers.
3.2. Variable definitions
1. Volatility. Stock volatility is measured by the Ratio calculated based on the logarithmic returns over the most recent 250 trading days, reflecting the overall volatility of individual stocks.
2. Extreme Volatility. Compared to the main board, the ChiNext Market exhibits coexisting phenomena of consecutive rises and falls at the market level and frequent "concept stock frenzies" at the individual stock level, leading to more frequent extreme volatility events. The relaxation of price limit restrictions has not achieved the policy objective of stabilizing volatility; thus, the regulators have introduced intraday temporary suspension measures for stocks experiencing severe abnormal fluctuations. To assess changes in extreme volatility following the relaxation of price limit restrictions, the following metric is used:
Extreme Volatility Days (Days): Defined as the number of trading days within a month where the intraday price amplitude (difference between the highest and lowest prices) exceeds 7.11%. The 7.11% threshold corresponds to the 90th percentile of the intraday amplitude distribution across all sample stocks.
Lottery-like Characteristics. Following the methodology of Lu et al. (2021), a corrected idiosyncratic skewness (ISkew) is used to measure the lottery-like features of a stock. The calculation formulas are as follows:
\( ISke{w_{i}}=\frac{1}{T}\sum _{t=1}^{T}{(\frac{{R_{i,t}}-μ}{σ})^{3}} \) (1)
\( μ=\frac{1}{N}\frac{1}{T}\sum _{t=1}^{T}\sum _{i=1}^{N}{R_{i,t}} \) (2)
\( {σ^{2}}=\frac{1}{N}\frac{1}{T-1}\sum _{t=1}^{T}\sum _{i=1}^{N}{({R_{i,t}}-μ)^{2}} \) (3)
where \( {R_{i,t}} \) represents the daily return of stock iii on trading day t. μ and σ² are the mean and variance of daily returns for all stocks during the formation period, respectively. This method, based on all stocks in the formation period, approximates a normal distribution and is less affected by outliers, aligning better with the A-share market's price limit system.
Definitions of other variables involved in this study are shown in Table 1.
Table 1. Variable definitions
Name | Definition and Measurement Method |
Price | Stock price: Logarithm of the closing price on the last trading day of the month |
Return | Return: Cumulative monthly return |
Insti | Institutional Ownership: Proportion of shares held by institutions (reported quarterly) |
Size | Size: Logarithm of free-float market capitalization at the end of the month |
Turnover | Turnover Rate: Ratio of monthly trading volume to free-float shares |
Spread | Bid-Ask Spread: Volume-weighted relative effective spread |
BM | Book-to-Market Ratio: Ratio of owner's equity (reported quarterly) to market capitalization on the same date |
Salesv | Sales Revenue Volatility: Logarithm of the standard deviation of main business income over rolling four quarters |
3.3. Model construction
To examine the relationship between stock price and volatility, this paper constructs a fixed-effects panel regression model, as shown in Equation (4):
\( Rati{o_{i,t}}={β_{0}}+{β_{1}}×Pric{e_{i,t-1}}+Contro{l_{i,t-1}}+{λ_{i}}+{τ_{t}}+{ε_{i,t}} \) (4)
In this model, \( Rati{o_{i,t}} \) represents the overall volatility and extreme volatility of individual stocks, while \( Pric{e_{i,t-1}} \) denotes the closing price of individual stocks at the end of the previous month. Control variables include firm size, turnover rate, bid-ask spread, book-to-market ratio, and revenue volatility. All independent variables are lagged by one period. Leveraging the natural experiment of the ChiNext Board’s price limit expansion to ±20% in August 2020, the baseline model is tested separately on the full sample and on the post-reform ChiNext sample. This study primarily focuses on \( {β_{1}} \) , and if \( {β_{1}} \) is significantly negative, it indicates that low-priced stocks exhibit more severe volatility. To control for the impact of returns on volatility, historical returns and lottery-like characteristics are also incorporated into the model.
3.4. Baseline tests: the high volatility effect of low-priced stocks
1. Descriptive Statistics
Table 2 presents a comparison of key variables between the full sample and the post-reform ChiNext sample. It is observed that the average stock price is higher in the latter. In terms of overall volatility, ChiNext stocks post-reform show higher mean values and lower standard deviations, indicating that they consistently exhibit higher levels of volatility. Regarding extreme volatility, ChiNext stocks experience a greater number of extreme fluctuation days compared to the full sample, reflecting a higher risk of extreme volatility. In terms of monthly returns, the post-reform ChiNext sample displays lower average monthly returns with greater variability; however, the extreme maximum value is slightly higher than that of the full sample, indicating greater risk and more pronounced return polarization.
Table 2. Comparison of key variables between the full sample and the post-reform ChiNext sample
Variable | Full Sample | Post-Reform ChiNext Sample | ||||||
Mean | Median | Max | Std. Dev. | Mean | Median | Max | Std. Dev. | |
Ratio | 0.440 | 0.431 | 0.778 | 0.121 | 0.492 | 0.484 | 0.821 | 0.118 |
Days | 3.865 | 3.143 | 14.182 | 2.507 | 4.314 | 3.538 | 16.667 | 2.780 |
Price | 2.125 | 1.985 | 4.416 | 0.690 | 2.209 | 2.029 | 5.303 | 0.815 |
Return (%) | 0.204 | -0.710 | 41.689 | 11.874 | 0.084 | -0.601 | 42.293 | 12.663 |
Table 3 reports the descriptive statistics of other key variables for the post-reform ChiNext sample. Institutional investors hold approximately 23% of the shares, indicating a significant disparity in institutional ownership. Meanwhile, the right-skewed distribution of the bid-ask spread and the left-skewed distribution of turnover rate suggest that market liquidity is uneven, trading activity is insufficient, but there is considerable divergence in market opinions. Combined with the extreme return expectations associated with lottery-like characteristics, these factors collectively reflect the typical features of high volatility and complex investment behavior on the ChiNext Board.
Table 3. Descriptive statistics of key variables for the post-reform ChiNext sample
Variable | Mean | Median | Min | Max | Std. Dev. |
Size | 14.743 | 14.757 | 13.985 | 15.384 | 0.352 |
Turnover (%) | 6.173 | 4.289 | 0.944 | 33.727 | 5.482 |
Spread | 0.167 | 0.157 | 0.044 | 0.440 | 0.077 |
Insti (%) | 22.323 | 21.154 | 1.080 | 60.609 | 14.577 |
ISkew | 0.004 | -3.123 | -57.147 | 112.409 | 26.322 |
2. The Fundamental Relationship Between Stock Price and Volatility
The regression results presented in Table 4 show a significant negative correlation between stock price and volatility, indicating that the lower the stock price, the greater the attention to absolute price levels, and the more pronounced the volatility. This finding supports research hypothesis H1. After the relaxation of the price limit restrictions, low-priced stocks on the ChiNext Board exhibit even greater volatility, and the negative correlation between stock price and volatility becomes more pronounced than in the full sample, confirming research hypothesis H2. Furthermore, the effects of turnover rate and bid-ask spread on volatility are more pronounced in the ChiNext sample, suggesting that market liquidity and investor disagreement further amplify volatility. Additionally, the regression model for the ChiNext sample shows higher explanatory power, indicating that after the relaxation of price limits, stock prices have a stronger predictive ability for volatility. This supports the conclusion of Lu Rong et al. (2021) that price limits hinder the full reflection of information in stock prices. These findings collectively validate research hypothesis H3.
Table 4. The relationship between stock price and volatility: full sample
Variable | Full Sample (Including Post-Reform ChiNext Sample) | Post-Reform ChiNext Sample |
Ratio | Ratio | |
(1) | (2) | |
\( {Price_{t-1}} \) | -0.126*** (-4.87) | -0.154*** (-3.92) |
\( {Size_{t-1}} \) | 0.018* (1.69) | 0.029** (2.24) |
\( {Turnover_{t-1}} \) | 0.134*** (3.45) | 0.187*** (4.17) |
\( {Spread_{t-1}} \) | 0.076** (2.37) | 0.105** (2.61) |
\( {BM_{t-1}} \) | -0.033* (-1.65) | -0.046* (-1.78) |
\( {Salesv_{t-1}} \) | 0.061** (2.43) | 0.083*** (2.94) |
\( {Controls_{t-1}} \) | Yes | Yes |
Observations | 15,672 | 4,325 |
\( {R^{2}} \) | 0.328 | 0.369 |
Notes: ***, **, and * indicate significance at the 1%, 5%, and 10% levels, respectively. t-values based on clustered robust standard errors are reported in parentheses.
3. Controlling for the Effect of Size
To effectively distinguish between the endogeneity of stock price effects and size effects, this study conducts a robustness check using a grouped regression approach. Following the research design of Birru and Wang (2016), the sample is divided into ten decile groups based on circulating market capitalization. Separate volatility regression models are then estimated, both including and excluding the stock price factor. The results, shown in Figure 1, indicate that the regression curves including the stock price factor differ significantly from the baseline models across all size groups, with the most pronounced differences observed in the lower-size portfolios (Groups 1–3). This suggests that the influence of stock price on volatility is independent of firm size. Although the two curves gradually converge as size increases, they remain consistently apart, confirming the generality of the stock price effect. This method effectively overcomes the issue of outliers dominating the results in continuous variable regressions and more accurately identifies the independent explanatory power of the stock price factor.
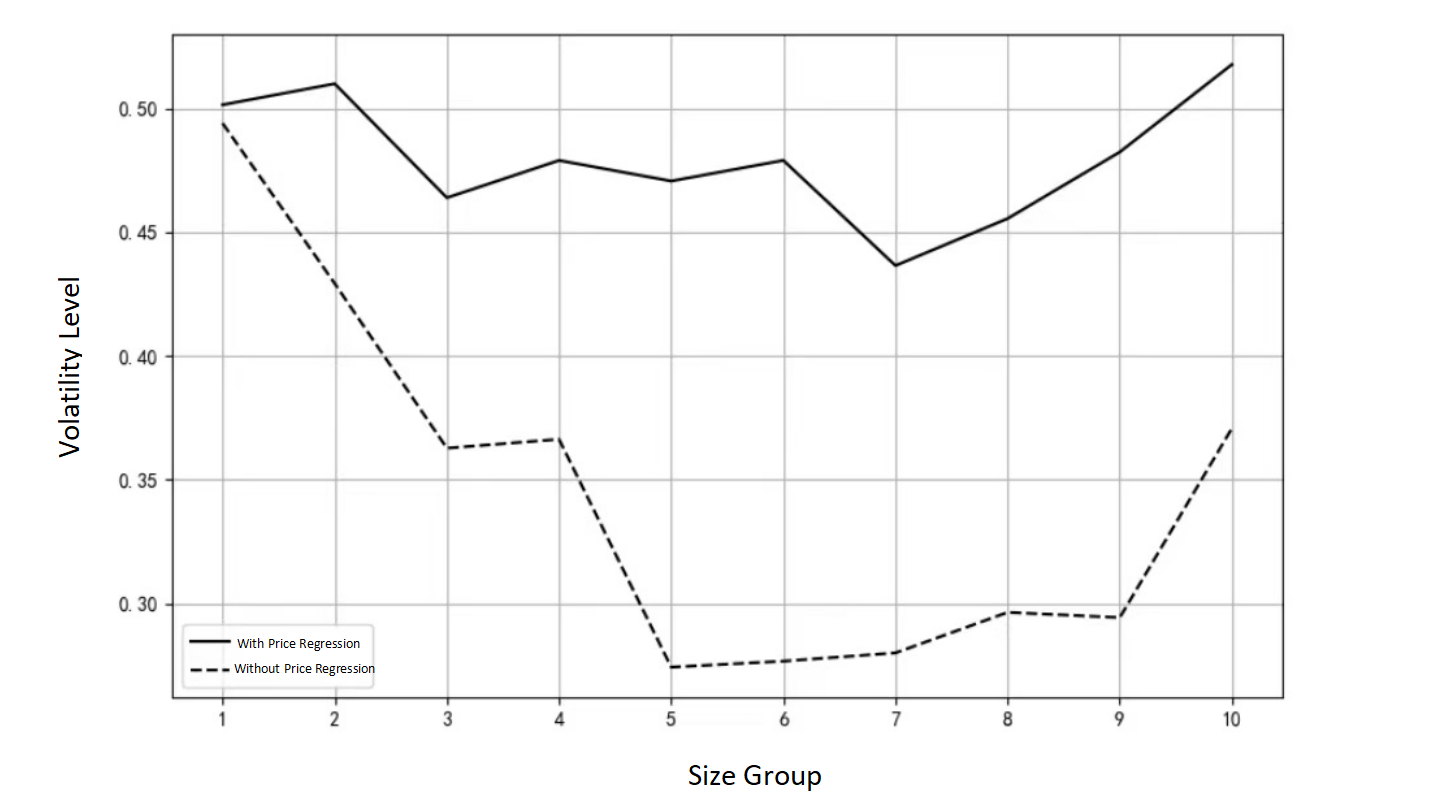
Figure 1. Volatility regression results by size
4. Conclusion
This study focuses on the Chinese A-share market and explores the relationship between investors' attention to the absolute price of stocks and the volatility of low-priced stocks. Through empirical analysis, it reveals a significant association between stock price and volatility and examines how changes in price limit policies affect this relationship. The findings provide new insights into the complex interactions between investor behavior and market volatility in China's A-share market.
The results demonstrate that investors’ focus on absolute stock price significantly influences the volatility of low-priced stocks. Specifically, the lower the stock price, the more pronounced the absolute price concern and the higher the volatility. This phenomenon is particularly evident in the Chinese A-share market and is largely driven by investors’ "nominal price illusion," whereby they mistakenly believe that low-priced stocks have greater upside potential while high-priced stocks appear "expensive." This cognitive bias leads investors to pay disproportionate attention to low-priced stocks and expect higher returns, thereby amplifying their volatility. Further analysis shows that changes in price limit policies significantly moderate the relationship between absolute price concern and low-priced stock volatility. After the relaxation of price limits, low-priced stocks on the ChiNext board exhibited even greater volatility, and the negative correlation between stock price and volatility became more pronounced compared to the full sample. This indicates that policy changes have profound impacts on market microstructure and investor behavior. The relaxation of price limits accelerated information dissemination and heightened trading activity, but also amplified market volatility. Moreover, the phenomenon of higher volatility among low-priced stocks is consistently validated in both the full sample and the post-reform ChiNext sample. Volatility among low-priced stocks is significantly higher than that among high-priced stocks, and this gap becomes even more apparent following the relaxation of price limits.
Based on the significant association revealed between investors’ attention to absolute stock price and low-priced stock volatility, as well as the moderating role of price limit policy changes, the following recommendations are proposed to optimize market mechanisms, enhance investor decision-making quality, and strengthen market stability: At the regulatory level, authorities should fully consider investors' psychological characteristics and the complexity of market microstructure when adjusting price limit policies. Gradual adjustments and dynamic monitoring are recommended to balance market efficiency and stability. In addition, enhancing information disclosure systems to ensure the timeliness and transparency of corporate information can help reduce information asymmetry and provide investors with more comprehensive decision-making support. In terms of investor education, regulators and financial institutions should collaborate to systematically promote financial literacy initiatives. Both online and offline education campaigns should be deployed to raise investors' awareness of the "nominal price illusion," guide them to focus on the intrinsic value of stocks, and encourage rational risk assessment, thus avoiding irrational trading behavior driven by cognitive biases. At the market participant level, securities firms and financial institutions are encouraged to optimize trading strategies, adopt advanced risk assessment models, and enhance their ability to predict and manage market volatility. Additionally, market innovation should be encouraged through the development of volatility-linked financial derivatives, providing investors with diversified risk management tools and improving overall market liquidity and depth. In summary, by optimizing regulatory policies, strengthening investor education, and promoting proactive innovation among market participants, it is possible to mitigate the excessive volatility caused by investors’ undue focus on absolute stock price and to promote the stable development of China’s A-share market.
References
[1]. Zhou, H., Wu, W., & Zhou, Y. (2012). The volatility puzzle and market sentiment in China's A-share market. Shanghai Economic Review, 24(4), 3–13.
[2]. Wang, C., & Wang, Z. (2017). Price limits, margin trading, and stock price volatility: A comparative study based on A–H shares. Economic Research Journal, 52(4), 151–165.
[3]. Xu, J. (2010). Excessive volatility of China's A-share indices. Journal of Financial Research, (8), 94–111.
[4]. Lu, & Yan, Z. (2024). Do investors focus more on stock prices or returns?—A new explanation for stock market overvolatility. Economic Perspectives, (3), 61–76.
[5]. Luo, J., Xiang, Y., & Jin, S. (2017). The low-price stock premium puzzle in China's capital market. Journal of Financial Research, (1), 191–206.
[6]. He, G., Cui, C., & Gao, H. (2021). Nominal price illusion: Empirical evidence based on securities analysts' target price forecasts. Journal of Financial Research, (6), 189–206.
[7]. Fama, E. F. (1970). Efficient Capital Markets: A Review of Theory and Empirical Work. Journal of Finance, 25(2), 383-417.
[8]. Fama, E. F. (1991). Efficient Capital Markets: II. Journal of Finance, 46(5), 1575-1617.
[9]. Shiller, R. J. (1981). Do Stock Prices Move Too Much to Be Justified by Subsequent Changes in Dividends? American Economic Review, 71(3), 421-436.
[10]. Mehra, R., & Prescott, E. C. (1985). The Equity Premium: A Puzzle. Journal of Monetary Economics, 15(2), 145-161.
[11]. Ang, A. (2006). The cross-section of volatility and expected returns. Journal of Finance, 61(1), 259-299.
[12]. Hutton, A. P. (2009). Opaque financial reports, R2, and crash risk. Journal of Financial Economics, 94(1), 67-86.
[13]. Hwang, S., & Lu, C. (2008). Is Share Price Relevant? Working Paper. DOI:10.2139/ssrn.1341790
[14]. Baker, M., Greenwood, R., & Wurgler, J. (2009). Catering Through Nominal Share Prices. Journal of Finance, 64(6), 2559-2590.
[15]. Fritzemeier, L. H. (1936). Relative Price Fluctuations of Industrial Stocks in Different Price Groups. The Journal of Business of the University of Chicago, 9(2), 133-154.
[16]. Heins, A. J., & Allison, S. L. (1966). Some Factors Affecting Stock Price Variability. Journal of Business, 39(1), 19-23.
[17]. Strong, R. A. (1984). Do Share Price and Stock Splits Matter? The Journal of Portfolio Management, 10(1), 58-64.
[18]. Weld, W. C. (2009). The nominal share price puzzle. Journal of Economic Perspectives, 23(2), 121-142.
[19]. Birru, J., & Wang, B. (2016). Nominal price illusion. Journal of Financial Economics, 119(3), 578-598.
[20]. Bourdin, D., & Vetschera, R. (2018). Factors influencing the ratio bias. EURO Journal on Decision Processes, 6(3), 321-342.
Cite this article
Jin,Y. (2025). Absolute price attention and low-priced stock volatility: empirical evidence from China's A-share market. Journal of Applied Economics and Policy Studies,18(4),70-75.
Data availability
The datasets used and/or analyzed during the current study will be available from the authors upon reasonable request.
Disclaimer/Publisher's Note
The statements, opinions and data contained in all publications are solely those of the individual author(s) and contributor(s) and not of EWA Publishing and/or the editor(s). EWA Publishing and/or the editor(s) disclaim responsibility for any injury to people or property resulting from any ideas, methods, instructions or products referred to in the content.
About volume
Journal:Journal of Applied Economics and Policy Studies
© 2024 by the author(s). Licensee EWA Publishing, Oxford, UK. This article is an open access article distributed under the terms and
conditions of the Creative Commons Attribution (CC BY) license. Authors who
publish this series agree to the following terms:
1. Authors retain copyright and grant the series right of first publication with the work simultaneously licensed under a Creative Commons
Attribution License that allows others to share the work with an acknowledgment of the work's authorship and initial publication in this
series.
2. Authors are able to enter into separate, additional contractual arrangements for the non-exclusive distribution of the series's published
version of the work (e.g., post it to an institutional repository or publish it in a book), with an acknowledgment of its initial
publication in this series.
3. Authors are permitted and encouraged to post their work online (e.g., in institutional repositories or on their website) prior to and
during the submission process, as it can lead to productive exchanges, as well as earlier and greater citation of published work (See
Open access policy for details).
References
[1]. Zhou, H., Wu, W., & Zhou, Y. (2012). The volatility puzzle and market sentiment in China's A-share market. Shanghai Economic Review, 24(4), 3–13.
[2]. Wang, C., & Wang, Z. (2017). Price limits, margin trading, and stock price volatility: A comparative study based on A–H shares. Economic Research Journal, 52(4), 151–165.
[3]. Xu, J. (2010). Excessive volatility of China's A-share indices. Journal of Financial Research, (8), 94–111.
[4]. Lu, & Yan, Z. (2024). Do investors focus more on stock prices or returns?—A new explanation for stock market overvolatility. Economic Perspectives, (3), 61–76.
[5]. Luo, J., Xiang, Y., & Jin, S. (2017). The low-price stock premium puzzle in China's capital market. Journal of Financial Research, (1), 191–206.
[6]. He, G., Cui, C., & Gao, H. (2021). Nominal price illusion: Empirical evidence based on securities analysts' target price forecasts. Journal of Financial Research, (6), 189–206.
[7]. Fama, E. F. (1970). Efficient Capital Markets: A Review of Theory and Empirical Work. Journal of Finance, 25(2), 383-417.
[8]. Fama, E. F. (1991). Efficient Capital Markets: II. Journal of Finance, 46(5), 1575-1617.
[9]. Shiller, R. J. (1981). Do Stock Prices Move Too Much to Be Justified by Subsequent Changes in Dividends? American Economic Review, 71(3), 421-436.
[10]. Mehra, R., & Prescott, E. C. (1985). The Equity Premium: A Puzzle. Journal of Monetary Economics, 15(2), 145-161.
[11]. Ang, A. (2006). The cross-section of volatility and expected returns. Journal of Finance, 61(1), 259-299.
[12]. Hutton, A. P. (2009). Opaque financial reports, R2, and crash risk. Journal of Financial Economics, 94(1), 67-86.
[13]. Hwang, S., & Lu, C. (2008). Is Share Price Relevant? Working Paper. DOI:10.2139/ssrn.1341790
[14]. Baker, M., Greenwood, R., & Wurgler, J. (2009). Catering Through Nominal Share Prices. Journal of Finance, 64(6), 2559-2590.
[15]. Fritzemeier, L. H. (1936). Relative Price Fluctuations of Industrial Stocks in Different Price Groups. The Journal of Business of the University of Chicago, 9(2), 133-154.
[16]. Heins, A. J., & Allison, S. L. (1966). Some Factors Affecting Stock Price Variability. Journal of Business, 39(1), 19-23.
[17]. Strong, R. A. (1984). Do Share Price and Stock Splits Matter? The Journal of Portfolio Management, 10(1), 58-64.
[18]. Weld, W. C. (2009). The nominal share price puzzle. Journal of Economic Perspectives, 23(2), 121-142.
[19]. Birru, J., & Wang, B. (2016). Nominal price illusion. Journal of Financial Economics, 119(3), 578-598.
[20]. Bourdin, D., & Vetschera, R. (2018). Factors influencing the ratio bias. EURO Journal on Decision Processes, 6(3), 321-342.