1. Introduction
In the post-pandemic era, global economic turbulence and divergence have led to sluggish recovery, significantly increasing employment pressure and economic downturn risks [1]. To further unleash consumption potential and promote sustained recovery, the State Council and local governments across various provinces and cities have successively introduced a series of laws, regulations, and policies aimed at fostering the development of the street vendor economy. This economic form has not only received official endorsement but has also elicited enthusiastic responses from the general public [2]. As an important measure to stabilize employment, safeguard livelihoods, and spur development, the street vendor economy functions as a form of “social lubricant,” playing a key role in promoting flexible employment [3]. Despite its positive impact on employment promotion and consumption stimulation, issues such as unregulated development and unclear responsibilities urgently call for solutions [4]. The key governance challenge today is how to maintain the vitality of the street vendor economy while achieving its standardization and sustainable development. Additionally, heightened public expectations for public health and urban environmental quality in the post-pandemic context pose new challenges to governance policies for the street vendor economy.
The "street vendor economy" typically encompasses three forms: street retailing, community markets, and flea markets [5]. Domestic scholarly research on governance policies related to the street vendor economy has mainly focused on policy effectiveness, development challenges, and governance models. Under traditional urban governance models, street vending was often perceived negatively due to concerns over public space encroachment, environmental pollution, public safety, and regulatory difficulties—leading many city administrators to adopt a “one-size-fits-all” approach to suppression. However, in response to the unemployment surge triggered by the COVID-19 pandemic, Premier Li Keqiang emphasized the need to create more job opportunities during the 2020 National People's Congress and supported the liberalization of the street vendor economy. This policy shift sparked a nationwide surge in street vending [6]. Nevertheless, it is worth noting that both local governments and street vendors are often reluctant to bear transaction costs, resulting in a governance dilemma for the street vendor economy [5]. At this critical juncture, enhancing urban governance capacity, innovating and professionalizing management models, treating the street vendor economy as a normalized element of urban governance, identifying the root causes of governance challenges, and reforming local government performance evaluation systems may provide viable pathways for development [7]. At present, research evaluating and optimizing governance policies for the street vendor economy in the post-pandemic era remains limited. Most existing studies rely on policy tool analysis and qualitative comparisons, with insufficient exploration from a quantitative perspective.
This study aims to quantitatively evaluate public governance policies for the street vendor economy in the post-pandemic context through the construction of a PMC (Policy Modeling Consistency) Index Model. It seeks to identify existing policy issues and propose optimization strategies, thereby providing theoretical references and practical guidance for the formulation and refinement of the next generation of related policies.
2. Research progress on street vendor economy policies in the post-pandemic context
2.1. Data sources
2.1.1. Scope of policy text retrieval
Considering the availability of policy text data and the historical trajectory of street vendor economy development in China during the post-pandemic era, this study defines the retrieval period as spanning from the outbreak of COVID-19 in 2020 to the end of 2022. Notably, on December 26, 2022, China’s National Health Commission announced that COVID-19 would no longer be classified as a quarantinable infectious disease under the Frontier Health and Quarantine Law of the People's Republic of China. This timeframe captures the key phase during which the street vendor economy transitioned from regulatory loosening to gradual normalization. The policy texts were primarily collected from the following three sources: State Council Policy Documents (http://www.gov.cn/zhengce/zhengcewenjianku/index.htm) – This official repository includes laws, regulations, and normative documents issued by the State Council and its affiliated departments. It serves as the main source for retrieving national-level governance policies related to the street vendor economy. PKULaw Database (Beida Fabao)(www.pkulaw.com/law) – As one of the most mature, advanced, and authoritative legal and regulatory databases in China, PKULaw offers comprehensive collections of both central and local policies and legal documents. It is suitable for retrieving legal regulations and policy texts related to the street vendor economy. China National Knowledge Infrastructure (CNKI) The study also searched relevant academic literature from CNKI to identify and supplement missing or less-accessible policy texts, thereby ensuring comprehensiveness and timeliness in the data collection process.
2.1.2. Policy text retrieval rules
The data retrieval in this study centers around four core concepts: street vendor economy, public governance, policy, and post-pandemic. To ensure a comprehensive collection of relevant policies while accounting for synonyms and related terms, the following retrieval rules were applied: In the State Council Policy Database, an advanced search was conducted using the rule that “street vendor economy,” “employment,” and “pandemic” (or “post-pandemic”) must appear simultaneously in the full text. In the PKULaw Database, full-text searches were performed with the rule that “street vendor economy,” “public governance” (or “governance,” “urban governance,” “social governance”), and “pandemic” (or “post-pandemic”) must appear within the same paragraph. In the CNKI Database, relevant academic literature was retrieved and examined. Policy texts mentioned within these sources were extracted and incorporated to supplement the dataset.
2.1.3. Policy text selection criteria
To ensure that the selected policies closely align with the research objectives of this study, policy texts were filtered based on the following criteria: First, screening by issuing authority. The study prioritizes national-level policies related to the street vendor economy while supplementing them with normative documents issued by selected provincial and municipal governments that are representative and highly relevant. This ensures the authority and representativeness of the selected policy texts. Second, screening by policy type. The focus is on legal and regulatory documents—such as laws, regulations, resolutions, decisions, orders, bulletins, notices, opinions, and announcements—that reflect the government's stance on the public governance of the street vendor economy. Third, consideration of policy timeliness. Policies that have been repealed or abolished were excluded. In cases where policies were amended or revised during implementation, the latest version of the policy was selected for analysis. Finally, relevance filtering was conducted. Each document was manually reviewed in full to eliminate policies with weak relevance to the research topic—for instance, those that only mention the street vendor economy in passing without substantive governance content.
2.1.4. Policy text selection results
The Policy Modeling Consistency (PMC) Index Model is primarily designed for evaluating specialized policy texts [8], and the evaluation can focus on either policy outcomes or policy content [9]. Following the aforementioned retrieval scope, search rules, and selection criteria, this study ultimately identified nine valid policy samples for text mining. This resulted in the construction of a comprehensive and representative policy text database, laying a solid foundation for the subsequent quantitative analysis using the PMC index model. Taking into account the relevance and completeness of the policy samples, the nine selected policies are summarized in Table 1 below.
Table 1. Summary of policy texts related to the street vendor economy in the post-pandemic context
No. | Policy Title | Document No. | Date of Issuance |
P1 | Notice on Employment-Related Work During the Pandemic | MOHRSS Telecom [2020] No. 2 | 2020-02-05 |
P2 | Implementation Opinions on Strengthening Employment Stabilization Measures in Response to COVID-19 | State Council Office Doc. [2020] No. 6 | 2020-03-18 |
P3 | Notice on Promoting Epidemic Prevention Insurance to Support Market Entities, Employment, and Livelihoods | NDRC Office Finance Doc. [2022] No. 598 | 2022-06-30 |
P4 | Notice on Further Strengthening Epidemic Prevention for Institutions Supporting People with Disabilities, Employment, etc. | China Disabled Persons’ Federation Letter [2020] No. 18 | 2020-02-06 |
P5 | Notice on Printing and Distributing Sixteen Measures to Further Stabilize Employment in Response to the Impact of COVID-19 | Hunan Gov. Office Doc. [2020] No. 20 | 2020-04-28 |
P6 | Notice on Several Measures to Further Assist Individual Businesses in Overcoming Difficulties and Promoting Healthy Development | Jilin Gov. Office Telegram [2022] No. 21 | 2022-06-03 |
P7 | Notice on Encouraging the Street Vendor Economy to Stimulate Market Vitality During the Pandemic | Qiqihar Gov. Office Doc. [2020] No. 14 | 2020-06-08 |
P8 | Notice on Measures to Stabilize and Expand Employment in Response to the Impact of COVID-19 | Qinghai Gov. Office [2020] No. 45 | 2020-06-16 |
P9 | Notice on Several Measures to Promote Market Consumption and Respond Positively to the Impact of COVID-19 | Ministry of Commerce Office Doc. [2020] No. 24 | 2020-08-18 |
3. Post-pandemic PMC index model construction for street vendor economy-related policies
3.1. Identification and selection of variables in the PMC index model
The Policy Modeling Consistency (PMC) Index Model is a widely recognized policy evaluation tool in public policy research, initially proposed by Estrada [10]. This study applies the PMC model to evaluate public governance policies related to the street vendor economy in the post-pandemic era. A total of nine representative policies were selected as the research sample. To support the identification and selection of both first-level and second-level variables for the PMC model, this study employed the ROSTCM6.0 text mining software to analyze the content of the selected policy texts.
First, the nine policy texts identified through retrieval and screening were organized and imported into the ROSTCM6.0 database. Through procedures such as word segmentation and word frequency statistics, high-frequency keywords were extracted.
Next, in constructing the word frequency distribution table for the street vendor economy policy texts, raw word frequency data were filtered based on thematic relevance and policy tool orientation. The filtering process followed three main principles: Elimination of abstract or macro-level expressions, such as “expand” or “further,” which lack concrete analytical value. Exclusion of general terms like “office” or “unit” to preserve the policy texts' universality and relevance. Retention of livelihood-oriented terms, such as “employment,” “pandemic,” and “entrepreneurship,” which reflect core areas of policy concern.
As a result, a word frequency distribution table was generated, highlighting the main policy tools (e.g., “protection,” “supervision”) and livelihood-related issues (e.g., “employment,” “subsidies”) in the context of the post-pandemic street vendor economy. This table provides empirical support for subsequent PMC model analysis. The top 60 high-frequency terms are shown in Table 2 below.
Finally, to visualize the internal relationships among the high-frequency keywords and better understand the policy content structure, a co-occurrence social network map was generated using ROSTCM6.0. In the social network graph, each node represents a high-frequency word. The larger the node and the greater its number of connections to other nodes, the higher its degree centrality, indicating a more significant role in the policy discourse [11]. As shown in Figure 1, the terms “employment” and “protection” occupy central positions in the network, and they are connected to several other key terms, illustrating their central role in the post-pandemic governance of the street vendor economy.
Table 2. Word frequency distribution of policy texts related to the post-pandemic street vendor economy
No. | Term | Frequency | No. | Term | Frequency | No. | Term | Frequency |
1 | Employment | 326 | 21 | Subsidy | 50 | 41 | Reform | 34 |
2 | Enterprise | 167 | 22 | Carry out | 48 | 42 | Guidance | 34 |
3 | Pandemic | 125 | 23 | Insurance | 48 | 43 | Rural | 33 |
4 | Responsibility | 104 | 24 | Training | 47 | 44 | Finance Dept. | 33 |
5 | Service | 103 | 25 | Difficulty | 47 | 45 | Migrant worker | 33 |
6 | Protection | 102 | 26 | Measures | 46 | 46 | Duration | 32 |
7 | Division of labor | 102 | 27 | Consumption | 45 | 47 | Conditions | 32 |
8 | Society | 102 | 28 | Position | 44 | 48 | Public | 32 |
9 | Policy | 87 | 29 | Organization | 44 | 49 | Worker | 31 |
10 | Resources | 86 | 30 | Supervision | 43 | 50 | Economy | 31 |
11 | Human Resources | 81 | 31 | Key Points | 42 | 51 | Resumption of Work | 31 |
12 | Unemployment | 79 | 32 | Local Government | 41 | 52 | Management | 30 |
13 | Graduates | 77 | 33 | Occupation | 39 | 53 | Platform | 30 |
14 | Development | 73 | 34 | Encourage | 38 | 54 | Stability | 29 |
15 | Entrepreneurship | 69 | 35 | Funds | 38 | 55 | Loan | 28 |
16 | Universities | 68 | 36 | Provide | 37 | 56 | Poverty | 28 |
17 | Individual | 59 | 37 | Construction | 36 | 57 | Group | 28 |
18 | Businesses | 57 | 38 | Recruitment | 35 | 58 | Health | 27 |
19 | Operation | 53 | 39 | Employee | 35 | 59 | Pneumonia | 27 |
20 | Market | 53 | 40 | Intensity | 34 | 60 | Skill | 26 |
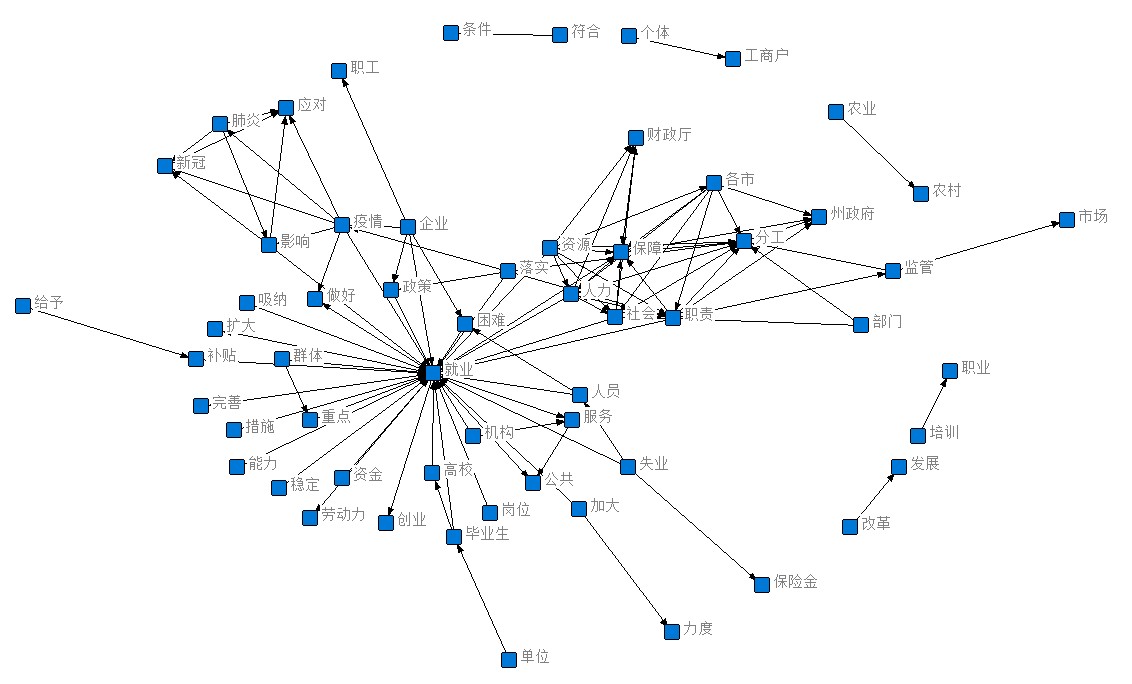
Figure 1. Social semantic network diagram of policies related to the street vendor economy in the post-pandemic context
Based on the results of the text mining, this study constructs a PMC index model evaluation index system for China's public governance policies related to the street vendor economy in the post-pandemic context. Ten primary variables were selected and revised, each containing multiple secondary variables, totaling 42 secondary variables. The specific variable settings are shown in Table 3 below.
Table 3. Variable settings of the PMC evaluation system for street vendor economy policies in the post-pandemic context
Primary Variables | Secondary Variables |
X1 Policy Nature | X1:1 Regulation, X1:2 Encouragement, X1:3 Description, X1:4 Guidance, X1:5 Organization, X1:6 Regulation |
X2 Policy Timeliness | X2:1 Long-term (>5 years), X2:2 Medium-term (3–5 years), X2:3 Short-term (1–3 years), X2:4 Within the year |
X3 Policy Tools | X3:1 Command-based, X3:2 Norm-based, X3:3 Incentive-based, X3:4 Capacity-building, X3:5 System change-oriented, X3:6 Persuasion-based |
X4 Issuing Institutions | X4:1 Legislative bodies, X4:2 Administrative bodies, X4:3 Other institutions |
X5 Policy Content | X5:1 Promote entrepreneurship and employment, X5:2 Stimulate consumption, X5:3 Supervision and regulation, X5:4 Encourage self-employment, X5:5 Loan platforms, X5:6 Social security |
X6 Policy Recipients | X6:1 College graduates, X6:2 Individual businesses, X6:3 Workers, X6:4 Migrant workers |
X7 Incentives and Constraints | X7:1 Financial support, X7:2 Platform service support, X7:3 Policy supervision |
X8 Related Domains | X8:1 Economic, X8:2 Political, X8:3 Social, X8:4 Technological, X8:5 Environmental |
X9 Policy Evaluation | X9:1 Sufficient basis, X9:2 Clear objectives, X9:3 Scientific plan, X9:4 Detailed planning |
X10 Policy Transparency | X10:1 Disclosure status |
Notes:
The design of Policy Nature (X1) and Policy Evaluation (X9) is based on Reference [11] and text mining results.
The design of Policy Timeliness (X2) and Policy Tools (X3) is based on Reference [11].
The design of Issuing Institutions (X4), Policy Content (X5), Policy Recipients (X6), and Incentives and Constraints (X7) is based on text mining results.
The design of Related Domains (X8) is based on References [11] and [16].
The design of Policy Transparency (X10) is based on Reference [16].
3.2. Construction of the multi-input output table
The multi-input output table is essentially a multidimensional quantitative analysis framework for individual variables [12], and there is no limit on the number of secondary variables under each primary variable [13]. Based on the specific circumstances of the street vendor economy governance policies, this study constructs a multi-input output table, as shown in Table 4.
Table 4. Multi-input output table
Primary Variable | X1 | X2 | X3 | X4 | X5 | X6 | X7 | X8 | X9 | X10 |
Secondary Variables | X1:1X1:2X1:3X1:4X1:5X1:6 | X2:1X2:2X2:3X2:4 | X3:1X3:2X3:3X3:4X3:5X3:6 | X4:1X4:2X4:3 | X5:1X5:2X5:3X5:4X5:5X5:6 | X6:1X6:2X6:3X6:4 | X7:1X7:2X7:3 | X8:1X8:2X8:3X8:4X8:5 | X9:1X9:2X9:3X9:4 | X10:1 |
3.3. PMC index calculation and evaluation criteria
The process of quantitatively assessing policies using the PMC (Policy Modeling Consistency) index involves four key stages. First, all observation indicators are integrated into a multi-dimensional input-output analytical framework. Second, text mining techniques are applied to analyze the policy documents, enabling the parameterization of secondary indicators through formulas (1) and (2). Third, a comprehensive evaluation of each dimension's primary indicators is conducted using formula (3). Finally, based on the values of the primary indicators, formula (4) is used to synthesize the PMC index for each policy sample.
\( X∼N[0,1] \) (1)
\( X=\lbrace XR:[0,1]\rbrace \) (2)
\( {X_{t}}(\sum _{j=1}^{n}\frac{{X_{tj}}}{T({X_{tj}})})(t=1,2,3,4,⋯,∞) \) (3)
\( PMC=\lbrace \begin{matrix}{X_{1}}(\sum _{i=1}^{6}\frac{{X_{1i}}}{6})+{X_{2}}(\sum _{j=1}^{4}\frac{{X_{2j}}}{4})+{X_{3}}(\sum _{k=1}^{6}\frac{{X_{3k}}}{6})+ \\ {X_{4}}(\sum _{l=1}^{3}\frac{{X_{4l}}}{3})+{X_{5}}(\sum _{m=1}^{6}\frac{{X_{5m}}}{6})+{X_{6}}(\sum _{n=1}^{4}\frac{{X_{6n}}}{4})+ \\ {X_{7}}(\sum _{p=1}^{3}\frac{{X_{7p}}}{3})+{X_{8}}(\sum _{q=1}^{5}\frac{{X_{8q}}}{5})+{X_{9}}(\sum _{r=1}^{4}\frac{{X_{9r}}}{4})+{X_{10}} \\ \end{matrix}\rbrace \) (4)
Where: t denotes the primary (first-level) variable, and j denotes the secondary (second-level) variable.
Table 5. Policy evaluation criteria
Score Range | 0~4.99 | 5~6.99 | 7~8.99 | 9~10 |
Evaluation | Poor Policy | Good Policy | Excellent Policy | Perfect Policy |
Once the PMC index of a given policy is calculated, its evaluation level can be determined based on the score. This study uses 10 primary variables and refers to the policy quality classification standards proposed by Song Dacheng [14] and Bu Lingtong [15]. According to the criteria in Table 5, the classification is as follows: A score between 9 and 10 indicates a perfect policy; A score between 7 and 8.99 indicates an excellent policy; A score between 5 and 6.99 indicates a good policy; A score between 0 and 4.99 indicates a poor policy.
Based on the above PMC index modeling method and evaluation criteria, and drawing on the multi-input-output table framework, the PMC index of each primary variable for the nine sample policies is calculated according to the actual content of the policy texts. The resulting PMC index, ranking, and evaluation level for each policy are shown below in Table 6.
Table 6. PMC index, ranking, and evaluation level of each policy
Primary Variable | P1 | P2 | P3 | P4 | P5 | P6 | P7 | P8 | P9 | Mean |
X1 Policy Nature | 1.00 | 0.83 | 0.83 | 0.67 | 0.67 | 1.00 | 0.83 | 0.83 | 0.83 | 0.83 |
X2 Policy Timeliness | 0.25 | 0.25 | 0.25 | 0.25 | 0.25 | 0.25 | 0.25 | 0.25 | 0.25 | 0.25 |
X3 Policy Instruments | 1.00 | 1.00 | 0.67 | 0.67 | 0.83 | 1.00 | 1.00 | 1.00 | 1.00 | 0.91 |
X4 Issuing Authority | 0.33 | 0.33 | 0.33 | 0.33 | 0.33 | 0.33 | 0.33 | 0.33 | 0.33 | 0.33 |
X5 Policy Content | 0.67 | 0.83 | 0.33 | 0.50 | 0.83 | 1.00 | 0.50 | 1.00 | 1.00 | 0.74 |
X6 Policy Recipients | 0.75 | 1.00 | 0.00 | 0.00 | 1.00 | 0.75 | 0.25 | 1.00 | 0.50 | 0.58 |
X7 Incentives & Constraints | 1.00 | 1.00 | 0.33 | 0.33 | 1.00 | 1.00 | 1.00 | 1.00 | 1.00 | 0.85 |
X8 Policy Coverage | 0.80 | 1.00 | 0.60 | 0.40 | 1.00 | 1.00 | 0.80 | 1.00 | 1.00 | 0.84 |
X9 Policy Evaluation | 1.00 | 1.00 | 0.75 | 0.75 | 1.00 | 1.00 | 1.00 | 1.00 | 1.00 | 0.94 |
X10 Policy Transparency | 1.00 | 1.00 | 1.00 | 1.00 | 1.00 | 1.00 | 1.00 | 1.00 | 1.00 | 1.00 |
PMC Index | 7.80 | 8.24 | 5.09 | 4.90 | 7.91 | 8.33 | 6.96 | 8.41 | 7.91 | 7.28 |
Ranking | 6 | 3 | 8 | 9 | 4 | 2 | 7 | 1 | 4 | / |
Policy Evaluation | Excellent | Excellent | Good | Poor | Excellent | Excellent | Good | Excellent | Excellent | Excellent |
4. Empirical results analysis
To more intuitively compare the strengths and weaknesses of various street economy-related policies, this study selects the policies with the highest (P8) and lowest (P4) PMC indices to draw radar charts of their scores across the 10 primary variables (see Figures 2 and 3). By evaluating the degree of concavity and concavity index—where a smaller concavity index indicates a more complete policy—the differences between these two policies and a “perfect” policy are analyzed [16]. This comparison, combined with practical needs, helps identify potential paths for policy improvement and refinement.
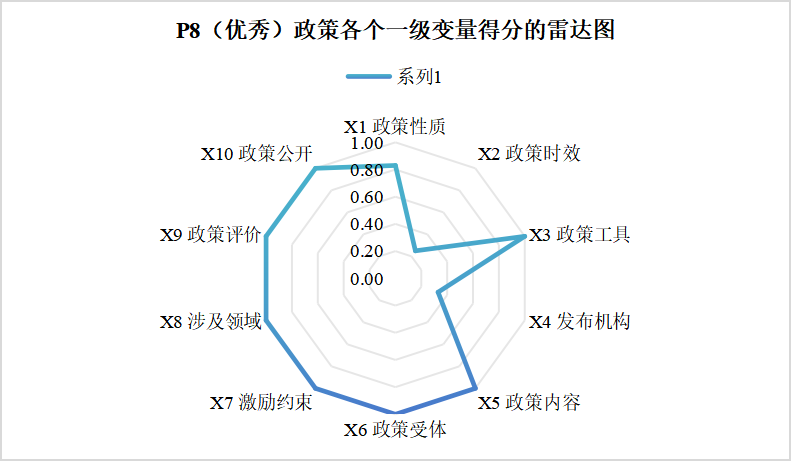
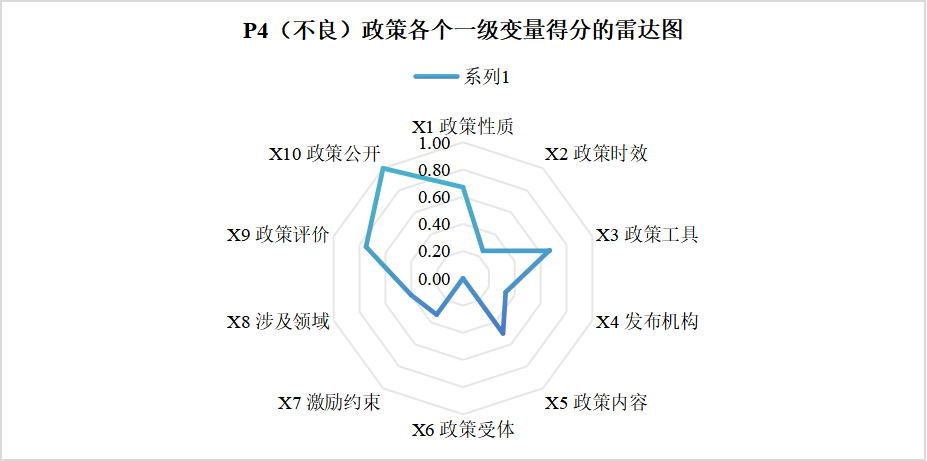
Figure 2. Radar charts of primary variable scores for policies P8 and P4
4.1. Overall policy evaluation results
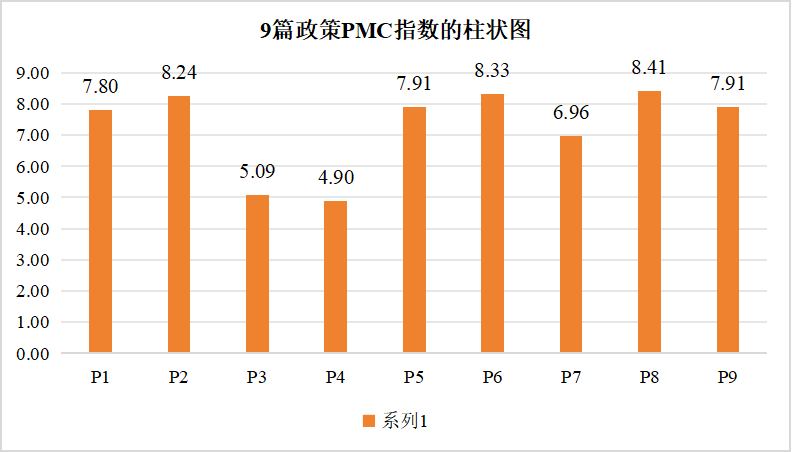
Figure 3. Bar chart of PMC indices for the nine policies
As shown in Table 6 and Figure 5, the average PMC index of the nine public governance policies related to the street economy is 8.10, indicating an overall rating of excellent. This suggests that the general design of street economy-related policies demonstrates a high degree of scientific rigor and rationality. The PMC indices of the nine policy texts, ranked from highest to lowest, are as follows: P8 (8.41) > P6 (8.33) > P2 (8.24) > P5 (7.91) = P9 (7.91) > P1 (7.80) > P7 (6.96) > P3 (5.09) > P4 (4.90). Specifically: Six policies (P8, P6, P2, P5, P9, and P1) scored above 7, thus falling into the category of excellent policies; Two policies (P7 and P3) scored between 5 and 6.99, categorized as good policies; One policy (P4) scored between 0 and 4.99, classified as a poor policy.
4.2. Evaluation results of different policy types
4.2.1. Excellent policies
There are a total of six excellent policies, among which the highest-ranked is the Notice on Issuing Measures to Stabilize and Expand Employment in Response to the Impact of the COVID-19 Pandemic (P8, score: 8.41). This policy, issued by the General Office of the Qinghai Provincial Government, encompasses a range of measures including employment promotion, livelihood protection, and market regulation. It covers a wide array of fields (X8 score: 1.00), and received full scores in policy tools (X3), policy evaluation (X9), and incentive and constraint mechanisms (X7), demonstrating its systematic design and strong operability. Next are the Notice on Further Supporting Individual Businesses to Overcome Difficulties and Promote Healthy Development (P6, score: 8.33) and the Implementation Opinions on Strengthening Employment Stabilization Measures in Response to the Impact of the COVID-19 Pandemic (P2, score: 8.24). These focus on individual business relief and employment stabilization, respectively. Both scored highly in policy content (X5) and incentives and constraints (X7), and were issued by the State Council or provincial governments, lending them a high degree of authority. Notably, most of the excellent policies were issued by national or provincial-level administrative bodies (e.g., the General Office of the State Council, provincial governments). Their content generally spans economic, social, and technological domains, with diverse incentive and constraint measures such as financial support, platform service assistance, and regulatory oversight.
4.2.2. Good policies
There are two good policies: the Notice on Encouraging Street Vendor Economy During the Pandemic to Stimulate Market Vitality (P7, score: 6.96) and the Notice on Promoting Epidemic Prevention Insurance to Help Safeguard Market Entities, Employment, and Livelihood (P3, score: 5.09). Compared to the excellent policies, these show limitations in two key areas: Narrow policy content – For example, P3 focuses solely on "epidemic prevention insurance," resulting in a low score for policy content (X5: 0.33) and lacking a comprehensive design for other aspects of the street economy. Weak incentive and constraint mechanisms – Although P7 proposes to encourage street vending, its incentive and constraint score (X7) is only 0.25, lacking clear financial support or regulatory measures. Limited target groups – P3 scored 0 for policy recipients (X6), as it fails to offer differentiated measures for specific groups such as self-employed individuals or migrant workers. Nevertheless, these policies still play a complementary role in specific areas. For instance, P7, as a temporary policy, stimulated the street economy and helped mitigate the short-term impact of the pandemic on market vitality.
4.2.3. Poor policy
Only one policy falls into the poor category: the Notice on Further Improving Epidemic Prevention Work in Institutions Providing Care and Employment for People with Disabilities (P4, score: 4.90). The main reasons for its low score are as follows: Misalignment with core topic – The policy primarily focuses on epidemic prevention in disability institutions, with weak relevance to street economy governance. As a result, its policy content score (X5) is only 0.50. Lack of clear target recipients – It does not explicitly address stakeholders related to the street economy (e.g., vendors, consumers), leading to a score of 0 in policy recipients (X6). No incentive or constraint mechanisms – The policy fails to propose any support or regulatory measures related to the street economy, scoring only 0.33 for incentives and constraints (X7).
4.3. Overall analysis of primary policy variables
To gain an in-depth understanding of the overall effectiveness of street vendor economy policies, clarify the strengths and weaknesses across different dimensions, and explore differences in effectiveness between central and local policies, this study conducted a comprehensive analysis of the primary policy variables. The results are shown below.
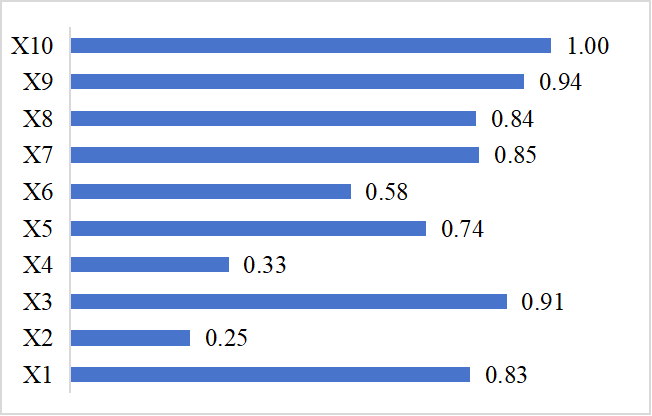
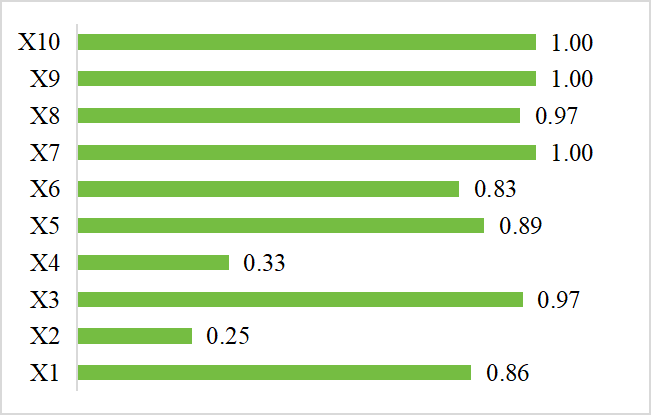
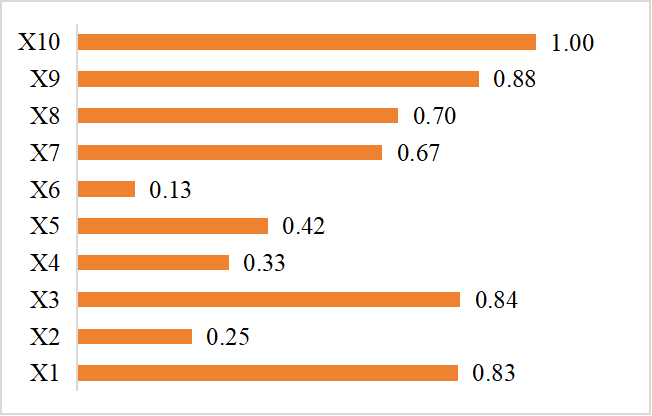
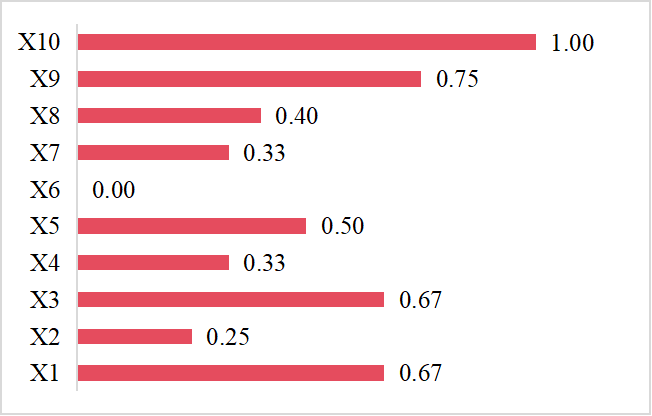
Figure 4. Bar chart of average scores for each primary policy variable
4.3.1. Policy strength dimensions
First, the two highest-scoring dimensions are policy transparency (X10) and policy evaluation (X9). The average score for policy evaluation is 0.94. For example, Policy P7 sets a quantifiable goal of "15% increase in new employment within three months," accompanied by a dynamic monitoring mechanism. The policy transparency dimension scored a full 1.00 across all samples, with all policies publicly disclosed via the State Council's official website or local government platforms and open for public comment, demonstrating a high level of transparency in the policy-making process.
Next, the policy tools (X3) and incentives and constraints (X7) dimensions also scored relatively high. The average score for policy tools was 0.91, with six policies scoring above the average. According to the word frequency analysis in Table 2, terms such as “protection” (mentioned 102 times), “subsidy” (50 times), and “encouragement” (38 times) indicate a composite policy tool strategy characterized by incentive-driven and regulation-assisted approaches. As for incentive and constraint mechanisms, the average score was 0.85, with six policies scoring full marks, reflecting a certain level of depth in policy innovation.
4.3.2. Policy weakness dimensions
First, the policy timeliness (X2) and issuing agency (X4) dimensions scored the lowest. For policy timeliness, the average score was 0.25, and all policies exhibited homogeneity: eight of them set short-term durations (1–3 years). This correlates with the word "long-term mechanism" appearing only nine times in Table 2, reflecting a lack of sustainable planning in policy design. In terms of issuing agencies, the average score was 0.33. About 78% of policies were issued by a single department, with only P2 and P3 jointly released by multiple departments, revealing a structural deficiency in cross-departmental collaborative governance mechanisms.
Second, the policy recipients (X6) dimension also scored relatively low in some policies. Specifically, in the policy recipient dimension, good policies (P3 and P7) had an average score of just 0.13, while the poor policy (P4) scored 0.00, indicating limited coverage of target populations.
4.3.3. Differences in effectiveness between central and local policies


Figure 5. Bar chart of average scores for primary variables in central vs. provincial-level policies
As shown in Figure 7 above, provincial-level policies (P5–P9) scored higher than central policies (P1–P4) in six dimensions: policy tools (X3), policy content (X5), policy recipients (X6), incentives and constraints (X7), coverage of policy areas (X8), and policy evaluation (X9). The score differences were 0.13, 0.29, 0.26, 0.33, 0.26, and 0.12, respectively. The provincial policies outperformed central ones by margins ranging from 14% to 49%, with the most significant disparity in the incentives and constraints dimension. These findings suggest that, in the formulation of street vendor economy policies, local governments demonstrate stronger governance innovation and adaptability compared to the central government. This differentiated pattern reflects both the flexible and innovative nature of local governance and the need for improvements in top-level design, particularly in terms of integrating emerging technologies.
5. Conclusion and recommendations
5.1. Conclusion
This study focuses on nine street vendor economy policies issued by national and local governments between 2020 and 2022 in the post-pandemic context. Using text mining methods and the PMC-Index Model, a policy evaluation framework consisting of 10 primary variables and 42 secondary variables was constructed to quantitatively evaluate these representative policies. Through tools such as social semantic network mapping, PMC index calculation, and PMC surface plots, this paper presents a visual and empirical analysis of each policy's strengths and weaknesses. The main conclusions are as follows:
First, the overall design of street vendor economy policies is scientifically sound, but structural shortcomings remain. The average PMC index score for the nine policies is 7.28, with six classified as "excellent policies," indicating strong performance in dimensions such as policy tool combination, incentives and constraints, and transparency. For instance, excellent policies (e.g., P8, P6) commonly adopt a composite approach of “incentive-led and regulation-assisted,” utilizing funding support and platform services to enhance policy implementation. However, notable deficiencies persist in some policies: Lack of policy sustainability — eight policies are limited to short-term durations (1–3 years), lacking long-term mechanisms; Absence of cross-departmental coordination — 78% of policies were issued by a single department, undermining collaborative governance; Insufficient coverage of target groups — certain policies (e.g., P3, P4) fail to explicitly address key groups such as street vendors and migrant workers, resulting in limited precision in policy targeting.
Second, local governments demonstrate significantly greater policy innovation than the central government. Provincial-level policies (P5–P9) scored 14%–49% higher than central-level policies (P1–P4) in dimensions such as incentives and constraints, policy content, and coverage of relevant areas. Notably, local policies show greater flexibility in offering support measures (e.g., subsidies, tax relief) and in targeting diverse recipients (e.g., self-employed individuals, migrant workers). This indicates that local governments are more attuned to grassroots needs and can respond more swiftly to market changes. Conversely, it also highlights a gap in central-level top-down design regarding technology integration and long-term sustainability.
Third, policy tools are well aligned with public livelihood demands, but sustainability needs to be strengthened. High-frequency word analysis reveals that livelihood-oriented terms such as “employment,” “protection,” and “subsidy” appear most frequently (a total of 478 times), underscoring the policy focus on job stabilization and social welfare. However, within the policy evaluation dimension, the indicator for “detailed planning” scored relatively low (average of 0.74). Some policies (e.g., P7) lack dynamic monitoring mechanisms, making it difficult to meet the evolving demands of public health and urban environmental governance in the post-pandemic era.
5.2. Recommendations
As a means of safeguarding employment and stabilizing livelihoods, the street vendor economy plays a significant role in urban and national economic development [17]. Based on the above conclusions and in light of existing research, current employment pressures, and the practical needs of street vendor development, this paper proposes optimization strategies from three perspectives: policy design, implementation mechanisms, and collaborative governance. These aim to promote the standardization and sustainable development of the street vendor economy.
5.2.1. Strengthen top-level design and build a long-term governance framework
First, extend the policy duration and clarify phased goals.To counter the current trend of short-term policy planning, the central government should take the lead in formulating a Medium- and Long-Term Development Plan for the Street Vendor Economy (2023–2035), integrating street vendor development into the normalized urban governance system. Specifically, a “three-step” strategy can be adopted: Short term (1–3 years): focus on relief and hardship alleviation; Mid-term (3–5 years): promote standardized operations; Long term (5+ years): achieve deep integration with urban public services.
Second, optimize the policy tool mix to enhance sustainability. On the basis of current “incentive-based” tools, it is recommended to incorporate “capacity-building” and “systemic transformation” tools. For instance, a digital platform (e.g., Smart Management System for the Street Vendor Economy) could facilitate full-process online management of vendor registration, sanitation supervision, and consumer complaints, thus reducing administrative costs. Meanwhile, a special fund could be established to support vendor skills training and improve compliance capacity. In addition, law enforcement agencies should adopt a “combination of education and penalties” approach, emphasizing flexible enforcement. For first-time or occasional violations, priority should be given to education and persuasion over punishment [18].
5.2.2. Improve execution mechanisms to enhance policy precision
First, refine the classification of policy recipients and implement differentiated support. Support measures should be tailored according to vendor categories (e.g., unemployed individuals, migrant workers, university entrepreneurs), and modernized management and support services should be matched accordingly [19]. For example: Provide one-time entrepreneurial subsidies for the unemployed; Offer low-interest loans and incubation resources for university entrepreneurs; Enhance social protection for migrant workers, including full coverage of work-related injury insurance.
Second, establish dynamic monitoring and feedback mechanisms. Local governments should leverage big data technology to build a Policy Effectiveness Monitoring Platform for the Street Vendor Economy, which can track key indicators in real time, such as employment impact, sanitation compliance rates, and consumer satisfaction. Policy content should be dynamically adjusted based on feedback. For example, in regions with prominent sanitation issues, third-party evaluation agencies could be engaged to conduct special assessments and implement corrective mechanisms for identified problems.
5.2.3. Promote cross-departmental collaboration to form synergistic governance
First, establish a governance network featuring “vertical coordination + horizontal collaboration.” Vertically, the central government should define clear responsibilities for departments such as the Ministry of Commerce, Ministry of Human Resources and Social Security, and the National Health Commission to avoid policy fragmentation. Horizontally, local governments are encouraged to set up Joint Offices for Street Vendor Economy, integrating resources from urban management, market regulation, and environmental protection departments to enable one-stop approval and supervision.
Second, encourage societal participation in co-governance. Through government procurement of services and tax incentives, industry associations and nonprofit organizations can be guided to participate in policy formulation and implementation. For example, an industry association could be entrusted with drafting Sanitation Management Standards for the Street Vendor Economy, and community volunteers could assist with oversight, thus forming a multi-stakeholder governance model involving “government leadership, societal collaboration, and public participation.”
5.2.4. Strengthen central–local policy coordination and stimulate innovation
First, at the central level, cities with active street vendor economies (e.g., Chengdu, Changsha) can be selected as pilot sites to explore flexible governance models (e.g., Vendor Self-Governance Committees), with successful experiences incorporated into national policy frameworks. Central policy design should adopt a three-phase structure: Pre-policy phase: rational planning; Mid-policy phase: service enhancement and regulatory optimization; Post-policy phase: clear accountability and proportionate penalties [20].
Second, it is necessary to reform local government performance evaluation standards by incorporating the effectiveness of street vendor economy governance—such as employment contribution rates and public satisfaction—into assessment indicators. Additionally, a “tolerance list” should be established, allowing for non-principal errors during pilot innovations, so as to avoid blanket accountability that may dampen reform enthusiasm.
References
[1]. Gu, W., & Liu, Z. (2024). Study on urban street vendor economy governance policies in the post-pandemic period: A case study of Shanghai. Shanghai Commerce,(02), 25–27.
[2]. Li, Y. (2022). Analysis of development pathways for the street vendor economy in the post-pandemic era. Old Brand Marketing,(23), 47–49.
[3]. Zhang, Q., & Wang, W. (2021). Sustainable development strategies for the street vendor economy from the perspective of policy tools: A quantitative analysis based on policy texts from 26 provinces and cities. Journal of Kunming University of Science and Technology (Social Sciences Edition), 21(04), 68–76.
[4]. Han, Y., & Wang, J. (2024). Problems and solutions faced by the street vendor economy in the post-pandemic era. Northern Economy and Trade, (07), 44–47.
[5]. Zhou, Z., Zhang, J., & Wang, Z. (2022). "Street vendor economy" and street good governance: Lessons from management strategies in the Asia-Pacific region. International Urban Planning, 37(02), 74–81.
[6]. Yang, F. (2021). Differentiated policies for the street vendor economy in large, medium, and small cities in the post-pandemic era: A case study of Shandong Province. China Business Review, (14), 18–21.
[7]. Meng, Y., & Yao, M. (2021). The theoretical logic of the "street vendor economy" and China’s path choice. Journal of Central China Normal University (Humanities and Social Sciences Edition), 60(01), 45–52.
[8]. Hu, F., Qi, X., & Wang, X. (2020). Quantitative evaluation of robot industry policies based on the PMC index model: A case study of eight robot industry policy documents. Journal of Intelligence, 39(01), 121–129+161.
[9]. Song, Y. (2021). Quantitative evaluation and optimization of first-class undergraduate education policies based on the PMC index model. Educational Development Research, 41(9), 12–20, 36.
[10]. Ruiz Estrada, M. A. (2011). Policy modeling: Definition, classification and evaluation. Journal of Policy Modeling, 33(4), 523–536.
[11]. Zhang, Z., & Xiang, C. (2023). Quantitative evaluation of China's medical insurance fund supervision policies based on the PMC index model. Social Security Research, (04), 57–70.
[12]. Zhang, Y., & Zhou, Y. (2017). Mining and quantitative evaluation of new energy vehicle subsidy policy tools. China Population, Resources and Environment, 27(10), 188–197.
[13]. Wang, J., Yang, Q., & Zhang, Y. (2019). Quantitative evaluation of military-civil integration policies based on the PMC-AE index model. Journal of Intelligence, 38(4), 66–73.
[14]. Song, D., Jiao, F., & Fan, S. (2021). Quantitative evaluation of China's scientific data open sharing policies based on the PMC index model. Journal of Intelligence, 40(08), 119–126.
[15]. Bu, L., Xu, Y., Zhang, J., et al. (2021). Quantitative evaluation of China’s maker space policies from 2015 to 2020. China Science and Technology Forum, (07), 46–56.
[16]. Zhang, H., Liu, N., & Li, H. (2025). Text mining and quantitative evaluation of ecological protection policies in the Yangtze River Economic Belt based on the TOPSIS-PMC index model. Resources and Industry, 1–20.
[17]. Li, Y., Yuan, R., & Zhu, F. (2024). Research on sustainable development strategies for the new street vendor economy in the post-pandemic era. Industry and Technology Forum, 23(04), 26–28.
[18]. Guo, Z., Kong, L., & Zhang, J. (2024). Strategies for managing mobile street vendors and revitalizing the street vendor economy under the context of urban high-quality development: A case study of Pingdi Subdistrict, Longgang District, Shenzhen. Special Economic Zone Economy, (06), 50–53.
[19]. Yang, S., & Yin, J. (2020). Reflections on promoting the sustainable and healthy development of the street vendor economy in the new era. China Development, 20(04), 36–40.
[20]. Chen, Y., & Wang, Y. (2020). On the administrative supervision path for embedding the "street vendor economy" into the modern governance system: A sample study of regulatory policies in 15 cities. Hunan Social Sciences, (06), 93–103.
Cite this article
Gao,X. (2025). Evaluation and Optimization of Public Governance Policies for Street Vendor Economy in the Post-Pandemic Era: A Quantitative Analysis Based on the PMC Index Model. Journal of Applied Economics and Policy Studies,18(5),1-11.
Data availability
The datasets used and/or analyzed during the current study will be available from the authors upon reasonable request.
Disclaimer/Publisher's Note
The statements, opinions and data contained in all publications are solely those of the individual author(s) and contributor(s) and not of EWA Publishing and/or the editor(s). EWA Publishing and/or the editor(s) disclaim responsibility for any injury to people or property resulting from any ideas, methods, instructions or products referred to in the content.
About volume
Journal:Journal of Applied Economics and Policy Studies
© 2024 by the author(s). Licensee EWA Publishing, Oxford, UK. This article is an open access article distributed under the terms and
conditions of the Creative Commons Attribution (CC BY) license. Authors who
publish this series agree to the following terms:
1. Authors retain copyright and grant the series right of first publication with the work simultaneously licensed under a Creative Commons
Attribution License that allows others to share the work with an acknowledgment of the work's authorship and initial publication in this
series.
2. Authors are able to enter into separate, additional contractual arrangements for the non-exclusive distribution of the series's published
version of the work (e.g., post it to an institutional repository or publish it in a book), with an acknowledgment of its initial
publication in this series.
3. Authors are permitted and encouraged to post their work online (e.g., in institutional repositories or on their website) prior to and
during the submission process, as it can lead to productive exchanges, as well as earlier and greater citation of published work (See
Open access policy for details).
References
[1]. Gu, W., & Liu, Z. (2024). Study on urban street vendor economy governance policies in the post-pandemic period: A case study of Shanghai. Shanghai Commerce,(02), 25–27.
[2]. Li, Y. (2022). Analysis of development pathways for the street vendor economy in the post-pandemic era. Old Brand Marketing,(23), 47–49.
[3]. Zhang, Q., & Wang, W. (2021). Sustainable development strategies for the street vendor economy from the perspective of policy tools: A quantitative analysis based on policy texts from 26 provinces and cities. Journal of Kunming University of Science and Technology (Social Sciences Edition), 21(04), 68–76.
[4]. Han, Y., & Wang, J. (2024). Problems and solutions faced by the street vendor economy in the post-pandemic era. Northern Economy and Trade, (07), 44–47.
[5]. Zhou, Z., Zhang, J., & Wang, Z. (2022). "Street vendor economy" and street good governance: Lessons from management strategies in the Asia-Pacific region. International Urban Planning, 37(02), 74–81.
[6]. Yang, F. (2021). Differentiated policies for the street vendor economy in large, medium, and small cities in the post-pandemic era: A case study of Shandong Province. China Business Review, (14), 18–21.
[7]. Meng, Y., & Yao, M. (2021). The theoretical logic of the "street vendor economy" and China’s path choice. Journal of Central China Normal University (Humanities and Social Sciences Edition), 60(01), 45–52.
[8]. Hu, F., Qi, X., & Wang, X. (2020). Quantitative evaluation of robot industry policies based on the PMC index model: A case study of eight robot industry policy documents. Journal of Intelligence, 39(01), 121–129+161.
[9]. Song, Y. (2021). Quantitative evaluation and optimization of first-class undergraduate education policies based on the PMC index model. Educational Development Research, 41(9), 12–20, 36.
[10]. Ruiz Estrada, M. A. (2011). Policy modeling: Definition, classification and evaluation. Journal of Policy Modeling, 33(4), 523–536.
[11]. Zhang, Z., & Xiang, C. (2023). Quantitative evaluation of China's medical insurance fund supervision policies based on the PMC index model. Social Security Research, (04), 57–70.
[12]. Zhang, Y., & Zhou, Y. (2017). Mining and quantitative evaluation of new energy vehicle subsidy policy tools. China Population, Resources and Environment, 27(10), 188–197.
[13]. Wang, J., Yang, Q., & Zhang, Y. (2019). Quantitative evaluation of military-civil integration policies based on the PMC-AE index model. Journal of Intelligence, 38(4), 66–73.
[14]. Song, D., Jiao, F., & Fan, S. (2021). Quantitative evaluation of China's scientific data open sharing policies based on the PMC index model. Journal of Intelligence, 40(08), 119–126.
[15]. Bu, L., Xu, Y., Zhang, J., et al. (2021). Quantitative evaluation of China’s maker space policies from 2015 to 2020. China Science and Technology Forum, (07), 46–56.
[16]. Zhang, H., Liu, N., & Li, H. (2025). Text mining and quantitative evaluation of ecological protection policies in the Yangtze River Economic Belt based on the TOPSIS-PMC index model. Resources and Industry, 1–20.
[17]. Li, Y., Yuan, R., & Zhu, F. (2024). Research on sustainable development strategies for the new street vendor economy in the post-pandemic era. Industry and Technology Forum, 23(04), 26–28.
[18]. Guo, Z., Kong, L., & Zhang, J. (2024). Strategies for managing mobile street vendors and revitalizing the street vendor economy under the context of urban high-quality development: A case study of Pingdi Subdistrict, Longgang District, Shenzhen. Special Economic Zone Economy, (06), 50–53.
[19]. Yang, S., & Yin, J. (2020). Reflections on promoting the sustainable and healthy development of the street vendor economy in the new era. China Development, 20(04), 36–40.
[20]. Chen, Y., & Wang, Y. (2020). On the administrative supervision path for embedding the "street vendor economy" into the modern governance system: A sample study of regulatory policies in 15 cities. Hunan Social Sciences, (06), 93–103.


