


1. Introduction
Over the past decade, the hospitality literature has increasingly turned to machine learning as a practical lever for tightening operations and safeguarding revenue. Among the myriad use cases, two have emerged as especially consequential: the early identification of booking cancellations and the assessment of guest loyalty. Both directly shape pricing, inventory, and relationship-management decisions, yet they also expose methodological tensions between predictive accuracy, data availability, and managerial interpretability. Our study is situated at this intersection: we ask how far contemporary learning algorithms can push cancellation forecasts without forfeiting transparency, and what commercial signals can be extracted from the resulting models.
1.1. Hotel booking cancellation prediction
Prior work on cancellation prediction has followed two largely parallel arcs. Early studies favored simple, transparent baselines. Putro et al. [1], exploiting a proprietary Indonesian chain data set, report that a plain logistic regression retains an AUC of 0.85 when only 20 000 reservations are available, whereas a Multi-Layer Perceptron climbs to 0.91 once the sample swells. Prabha et al. [2] compare five standard learners on the ICPC public benchmark and show that a random forest suppresses the over-fitting endemic to a single decision tree, edging out SVM and k-NN on both AUC and F1. These results offered a first, cautiously optimistic view that even lightweight models can capture most of the signal.
A second wave of studies has embraced heavier ensembles and deliberate hyper-parameter tuning. Herrera et al. [3] feed six months of Spanish mid-scale hotel bookings to an XGBoost model whose depth, shrinkage, and subsampling rates are selected by grid search, nudging the AUC roughly four points above the baseline. Prasetya et al. [4] go further, stacking Logistic Regression, Random Forest, and LightGBM in the first layer, GBM and SVM in the second, and a final logistic aggregator; this yields 0.95 accuracy and 0.92 F1 on 80 000 OTA records, comfortably outperforming a stand-alone LightGBM. Liu [21] reframes the objective function itself, proposing a profit-aware heterogeneous stack that penalizes misclassification according to expected revenue loss rather than symmetric error rates. Chen et al. [5] pursue interpretability instead: by marrying Lasso-based screening with Bayesian networks and GBM, they isolate the interaction “lead time × price fluctuation” and “loyalty × cancellation policy” as the dominant cancellation drivers; the hybrid reaches 0.93 AUC while delivering pricing rules that managers can read directly. Jishan et al. [20] demonstrate similar predictive power using Bayesian logistic and Beta-Binomial formulations, trading a small accuracy loss for fully probabilistic outputs. These collective advances have prompted Sekhon and Ahuja [6] to advocate embedding local explanation tools—SHAP, LIME—into live revenue systems, a recommendation we take up in our own pipeline.
Deep learning has only recently entered the conversation. Gartvall and Skanhagen [7] treat cumulative booking curves as one-dimensional signals and apply a shallow CNN to extract lead-time patterns, cutting the RMSE of short-horizon (≤ 7-day) cancellation forecasts by 10 % relative to ARIMA on European resort data. Their work hints that temporal convolutions can mine structure even from the coarse, irregular sequences typical of hotel reservations. Their results demonstrated that CNNs reduced the Root Mean Square Error (RMSE) by 10% in short-term (within 7 days) cancellation rate prediction compared to the ARIMA model.Beyond conventional deep learning architectures, Yang et al. [22] developed a tree-based neural network (TNN) that integrates tree learning with neural networks, demonstrating improved predictive power and suitability for decision support systems. Although Putro et al. [1]’s MLP model performed well on large-scale datasets, it was sensitive to data preprocessing and required five times the training time of Logistic Regression, highlighting the practical challenges associated with deploying deep learning models in real-world scenarios.
1.2. Customer loyalty and sentiment analysis
Hamdan et al. [8] conducted a study using membership data from a five-star hotel in Malaysia, extracting key features such as "historical stay frequency," "average spend per customer," and "membership level" to compare the performance of Random Forest (RF), Gradient Boosting Machine (GBM), and Support Vector Machine (SVM) algorithms. Empirical tests on a five-star loyalty programme in Malaysia showed a narrow but consistent edge for gradient-boosted machines: GBM closed at 0.89 accuracy, one point ahead of random forest and five clear of a tuned SVM. Rather than trumpet the margin, the authors stress what it enables—namely, a defensible scoring rule that the marketing team can use to decide when to push upgrades or perks before a high-value guest drifts away. Nguyen et al. [9] moved the lens from structured fields to the words guests leave behind. They fine-tuned BERT on a corpus of post-stay comments, distilled each review into a single valence score, and fed that score to XGBoost. The sentiment injection lifted AUC from 0.90 to 0.93, a jump that is hard to ignore when the baseline already sits in the low-nineties. The implication is that irritation or delight expressed on TripAdvisor is not just noise; it leaks information about the likelihood of a future cancellation. Puh and Bagić Babac [10] took a lighter route. TF-IDF vectors summarised guest reviews, an SVR regressor turned those vectors into sentiment values, and the resulting scores correlated 0.47 with actual no-shows. When the same scores were appended to the feature matrix of a random-forest model, the F1-score crept upward by three points—small in absolute terms, but meaningful when each mis-classified room night carries real cost. Patel et al. [11] step back from single-task prediction and argue for a closed loop: recommendation engines surface likely bookers, cancellation models flag the risky subset, and the two systems trade signals continuously. Historical cancellation rate and intended length of stay surface as the natural bridge variables between the two tasks, tightening both targeting and risk controls. Finally, Chen et al. [23] remind us that raw lift is not enough. By marrying Lasso screening with Bayesian networks and GBM, they surface interpretable interaction terms—loyalty tier crossed with refund policy, lead time crossed with price volatility—that let revenue managers see why a guest may bolt and what levers are still within reach.
|
Study |
Method(s) |
Dataset |
Key Findings |
Performance |
|
Putro et al. (2021) |
LR, MLP |
Indonesia hotel chain |
MLP achieved higher AUC with large dataset; LR more robust on smaller samples |
MLP AUC: 0.91, LR AUC: 0.85 |
|
Prabha et al. (2022) |
DT, RF, SVM, KNN, NB |
ICPC public dataset |
RF outperformed other models, showing strong ensemble benefits |
RF best in AUC and F1-score |
|
Herrera et al. (2024) |
XGBoost (grid search) |
Mid-range hotels (Spain) |
Tuned XGBoost significantly improved AUC over baseline |
+4% AUC gain |
|
Prasetya et al. (2024) |
3-layer Stacking (LR, RF, LightGBM, GBM, SVM) |
Indian OTA platform |
Stacking framework outperformed single LightGBM |
Accuracy: 0.95, F1: 0.92 vs LightGBM Accuracy: 0.90 |
|
Chen et al. (2022) |
Lasso + BN + GBM |
Proprietary hotel data |
Hybrid interpretable model identified key feature interactions |
AUC: 0.93 |
|
Sekhon & Ahuja (2023) |
Review of ML models + SHAP, LIME |
Not applicable (Review) |
Recommended integrating interpretability tools into hotel ML systems |
Conceptual recommendation |
|
Gartvall & Skanhagen (2022) |
CNN vs ARIMA |
European resort hotel |
CNN reduced RMSE by 10% for short-term cancellation predictions |
CNN outperformed ARIMA |
|
Hamdan et al. (2023) |
RF, GBM, SVM |
5-star hotel membership data (Malaysia) |
GBM slightly outperformed RF and SVM in loyalty prediction |
Accuracy: GBM 0.89, RF 0.88, SVM 0.84 |
|
Nguyen et al. (2024) |
BERT + XGBoost |
Voice of Customer (VoC) reviews |
Sentiment scores improved cancellation prediction AUC |
AUC: 0.90 → 0.93 |
|
Puh & Bagić Babac (2023) |
TF-IDF + SVR, RF |
Customer reviews |
Sentiment positively correlated (r=0.47) with cancellation rate |
+3% F1-score with sentiment |
|
Patel et al. (2023) |
Collaborative Filtering, Hybrid Models |
Hotel recommendation systems |
Suggested integration of recommendation and cancellation prediction for personalization |
Conceptual improvement |
As shown in Table 1, these studies collectively demonstrate the growing role of sentiment analysis and feature integration in predictive models for hotel cancellations. By incorporating customer sentiment and other relevant features into ML frameworks, hotels can gain deeper insights into customer behavior, enabling more effective decision-making in marketing, booking strategies, and risk management. Despite these advances, existing studies still face several limitations:(1) limited cost-sensitive evaluation, with minimal attention to the economic impact of false negatives;(2) insufficient interpretability of key predictive features for direct business application; and(3) a lack of integrated, multidimensional analysis combining seasonality, customer segmentation, and revenue management.These gaps directly inform the methodological choices in this study.
1.3. Demand forecasting and clustering analysis
Viverit et al. [12] proposed a two-step clustering-based forecasting method utilizing booking curve data before and after the COVID-19 pandemic. In the first step, an autoregressive (AR) model was employed to extract the shape features of the booking curves. Subsequently, K-Means clustering was applied to categorize the curves into four distinct groups: stable, rising, seasonal, and peak. For each cluster, an additive Pickup model was used to conduct short-term (8-week) forecasting. The experimental results demonstrated that this clustering-based approach led to a 12% reduction in the average Mean Absolute Percentage Error (MAPE) compared to the non-clustered method, highlighting the effectiveness of clustering in improving forecasting accuracy. Chen et al. [13] proposed a hybrid model combining the Autoregressive Integrated Moving Average (ARIMA) model with Random Forest (RF). In this model, ARIMA was used to capture the linear trends in booking volume, while RF was applied to non-linearly fit the residuals. Their study, which focused on weekly demand forecasting for a resort hotel in South America, showed that the hybrid model resulted in a 15% reduction in Root Mean Square Error (RMSE) compared to pure ARIMA. Moreover, the hybrid model outperformed standalone RF, which yielded an 8% reduction in RMSE. These results suggest that integrating ARIMA with RF can effectively enhance forecasting accuracy by addressing both linear and non-linear components of the booking demand. By leveraging advanced ML methods, such as K-Means clustering and ensemble approaches like ARIMA and RF, forecasting models can achieve greater precision in predicting future demand, ultimately enabling more effective resource allocation and decision-making in the hospitality industry. Sun [25] conducted a large-scale comparison of machine learning and deep learning models using PMS data from multiple hotels, confirming consistent cancellation patterns and strong predictive performance across different contexts.
Following an in-depth review of existing literature on the application of machine learning in the hotel industry, this study further explores the practical potential of machine learning techniques in hotel booking management. Compared to prior research, our study offers several key extensions and enhancements. First, we utilize the publicly available “Hotel Booking Demand” dataset from Kaggle, which contains rich and diverse information on both city and resort hotels. The dataset’s scale and heterogeneity provide a solid foundation for robust model training. Second, the study not only compares the performance of various machine learning models—including CNN, SVM, Random Forest, LSTM, MLP, XGBoost, and Transformer—but also conducts an in-depth analysis across multiple dimensions, such as customer segmentation, seasonal trends, and revenue management. These analyses offer comprehensive strategic insights for hotel management.
Among the models evaluated, Random Forest and XGBoost demonstrated particularly strong performance in predicting hotel booking cancellations, achieving an accuracy of 84% and an ROC AUC score of 0.9185, highlighting their high predictive capability. Furthermore, the study proposes specific data-driven business strategies—such as dynamic pricing, seasonal promotions, and customer loyalty programs—that have strong practical implications. By thoroughly examining customer behavior and market trends, this study offers a comprehensive perspective and actionable strategies to help hotels improve operations, increase customer loyalty, and achieve revenue optimization in an increasingly competitive market environment.
The organization of this paper is given as follows: section 2 describes the proposed methodology with dataset description, preprocessing, classification and evaluation process briefly. In section 3, the experimental result is shown and described the performance of different classifiers. Then, we summarize this work by indicating some future direction about how to improve this procedure in section 5.
2. Methodology
2.1. Methodology description
In this study, we implemented and evaluated multiple machine learning models to predict hotel booking cancellations using the "Hotel Booking Demand" dataset. The selected models include Random Forest (RF), XGBoost, Support Vector Machine (SVM), Convolutional Neural Network (CNN), Long Short-Term Memory (LSTM), and Multilayer Perceptron (MLP). These models were chosen for their proven effectiveness in handling structured and time-based data.
Random Forest (RF) is a widely-used ensemble method based on decision trees that improves classification accuracy by combining multiple models. It is particularly effective in handling tabular data with mixed-type features [14]. Suppose the training dataset is
where
Random Forest is used in many areas. In finance, it is used for credit scoring, risk assessment, and fraud detection. In healthcare, it helps with diagnosing diseases, grouping patients, and developing drugs. In biology, it is used for gene studies and predicting protein structures. In computer vision, it helps with image labeling and object detection. In language tasks, it is used for text classification and sentiment analysis.
XGBoost is an optimized gradient boosting framework that has demonstrated strong performance in structured data prediction tasks. It is known for its speed and regularization capabilities [15]. Suppose the dataset is
where
where
where
XGBoost is applied in various real-world domains. In the financial sector, it is used for credit scoring, loan default prediction, fraud detection, and stock price forecasting. In e-commerce, it supports personalized product recommendation, customer churn prediction, sales forecasting, and user purchase behavior modeling. In the healthcare domain, it contributes to disease risk prediction, diagnostic decision support, drug response modeling, and patient readmission risk assessment.
SVM was selected due to its solid baseline performance in binary classification tasks with high-dimensional features [16]. Now consider a binary classification problem. Suppose the training set is
If the condition
SVM works well in problems with many features. It is often used in text classification tasks such as spam filtering, news classification, sentiment analysis, and topic detection. It is also used in computer vision for face recognition, object detection, handwritten character recognition, and image search. In bioinformatics, SVM is applied to protein classification, function prediction, gene expression analysis, cancer detection, and drug design. In finance, it is used for credit scoring, stock price prediction, fraud detection, and market trend analysis.
MLP served as a deep feedforward baseline [17]. If the MLP has
Next, the activation function is applied:
where
The goal of training is to minimize the difference between the predicted output and the true value. A common loss function for regression tasks is the mean squared error (MSE):
MLPs are trained using the backpropagation algorithm. First, a forward pass is computed. Then, the output error is calculated:
where
The gradients of the loss function with respect to the weights and biases are computed as:
The weights and biases are updated using gradient descent:
where
In computer vision, MLPs are used as classifiers for extracted features, as components in hybrid CNN-MLP models, and as fully connected layers in segmentation networks or small-scale image classification. In natural language processing, MLPs are used for learning word embeddings, sentiment analysis, and text classification. For time series tasks, MLPs are applied in sliding window prediction, multi-step forecasting, anomaly detection, and models that use time embeddings. In recommendation systems, MLPs are used to model interactions between users and items, support deep collaborative filtering, predict click-through rates (CTR), and serve as parts of hybrid recommender models. In the financial sector, MLPs are used for stock price prediction, risk assessment, fraud detection, credit scoring, and portfolio optimization. In healthcare, they are applied in disease diagnosis and prediction, medical image analysis, patient outcome prediction, drug discovery, and genomic data modeling.
CNN and LSTM were used to explore whether deep learning architectures can capture temporal and sequential trends in booking behaviors [18,19]. To further explore non-linear patterns in booking behavior, we implemented and compared three deep learning models: a Convolutional Neural Network (CNN), a Long Short-Term Memory (LSTM) network, and a Transformer-based architecture. Each was trained using a consistent preprocessing pipeline and evaluated on identical datasets.
All deep learning models (CNN, LSTM, Transformer) used the same preprocessed features as input. For CNN and MLP, inputs were flattened numeric vectors. For LSTM and Transformer models, each booking record was duplicated across synthetic time steps to simulate sequence input, forming 3D tensors. Although actual temporal sequences were not available, this method allowed exploration of time-sensitive architectures. Future research may utilize true booking histories or customer journey data to better harness the sequential modeling strengths of LSTM and Transformer.
a. Convolutional Neural Network (CNN)
The CNN model was designed with a focus on capturing local feature patterns in structured booking data. The architecture consists of:
(1)1D Convolution Layer: 64 filters, kernel size 3, ReLU activation
(2)MaxPooling Layer: pool size of 2
(3)Dropout Layer: 0.5 rate for regularization
(4)Dense Hidden Layer: 50 units, ReLU activation
(5)Output Layer: 1 unit with sigmoid activation (for binary classification)
The model was trained using the Adam optimizer with a binary cross-entropy loss function for 10 epochs. This structure enables the CNN to identify temporal or spatial trends (e.g., booking lead time, request frequency) embedded within the input features. Its performance was competitive, especially in identifying non-canceled bookings.
b. Long Short-Term Memory (LSTM)
The LSTM model targeted the sequential dependencies within customer or booking behavior, despite each booking being treated as a static data point. Its architecture includes:
(1)Two LSTM Layers: each with 50 units; the first returns sequences, the second returns the final output
(2)Dropout Layers: 0.2 rate to prevent overfitting
(3)Dense Output Layer: 2 units with softmax activation for binary classification
Inputs were reshaped into 3D tensors to accommodate the LSTM input format. While this model captured some temporal behavior across encoded features, it showed marginal gains compared to CNN and was more computationally intensive.
c. Transformer-Based Model
To evaluate the effectiveness of self-attention in capturing global relationships among features, we designed a minimal Transformer encoder:
(1)Multi-Head Attention Layer: 2 heads, key dimension 64
(2)Feedforward Layer: 64 units with ReLU activation
(3)Dropout & Layer Normalization: applied after each main block
(4)Dense Output Layer: 2 units with softmax activation
Though commonly used in sequential language tasks, the Transformer model demonstrated reasonable performance in this tabular classification setting. Its ability to model pairwise interactions across the entire feature space yielded stable, though not superior, results.
CNN achieved the best trade-off among deep models with minimal overfitting and strong generalization, as shown in PR curves. LSTM was more sensitive to class imbalance and less stable, likely due to limited sequential signal. Transformer offered interpretable feature interactions, but its performance was comparable to MLP, with no significant improvement over CNN or XGBoost.
2.2. Data description
The dataset employed in this study is the “Hotel Booking Demand” dataset from Kaggle, comprising 119,390 records and 35 variables, covering both city and resort hotels. The dataset spans three years of booking data, including customer demographics, reservation details, pricing, special requests, and booking statuses. It provides a comprehensive basis for building predictive models and extracting business insights for hotel management. Table 2 is shown the descriptive statistics of hotel booking cancellation as follows.
|
Feature |
Range |
Minimum |
Maximum |
Mean |
|
is_canceled |
1.0 |
0 |
1 |
0.37 |
|
lead_time |
737.0 |
0 |
737 |
104.01 |
|
arrival_date_year |
2.0 |
2015 |
2017 |
2016.16 |
|
arrival_date_month |
JANUARY |
DECEMBER |
JUNE |
|
|
arrival_date_week_number |
52.0 |
1 |
53 |
27.17 |
|
arrival_date_day_of_month |
30.0 |
1 |
31 |
15.8 |
|
stays_in_weekend_nights |
19.0 |
0 |
19 |
0.93 |
|
stays_in_week_nights |
50.0 |
0 |
50 |
2.5 |
|
adults |
55.0 |
0 |
55 |
1.86 |
|
children |
10.0 |
0 |
10 |
0.1 |
|
babies |
10.0 |
0 |
10 |
0.01 |
|
is_repeated_guest |
1.0 |
0 |
1 |
0.03 |
|
previous_cancellations |
26.0 |
0 |
26 |
0.09 |
|
previous_bookings_not_canceled |
72.0 |
0 |
72 |
0.14 |
|
booking_changes |
21.0 |
0 |
21 |
0.22 |
|
days_in_waiting_list |
391.0 |
0 |
391 |
2.32 |
|
adr |
5406.38 |
-6.38 |
5400.0 |
101.83 |
|
required_car_parking_spaces |
8.0 |
0 |
8 |
0.06 |
|
total_of_special_requests |
5.0 |
0 |
5 |
0.57 |
|
Reservation_status_date |
10/17/2014 |
09/14/2017 |
07/30/2016 |
2.3. Data preprocessing and exploration
The analysis began with the loading of the ‘hotel_booking.csv’ dataset using Pandas. Following a preliminary examination of column names and data types, missing values were addressed. The ‘agent’ and ‘company’ columns, which contained a significant number of missing entries, were removed. Missing country data was standardized to ‘Unknown’ and missing values in the ‘children’ column were replaced with the mode value. These measures ensured the integrity of the dataset, thereby facilitating the subsequent analysis of hotel reservation insights.
In addition to handling missing values and standardizing categorical inputs, we also removed four columns—name, email, phone-number, and credit_card—during the data cleaning stage. These columns primarily contained personal and sensitive user identifiers. From both a data privacy and modeling perspective, they were excluded for three main reasons: (1) they violate privacy protection best practices (e.g., GDPR compliance); (2) these fields do not hold predictive value for booking cancellations, as they encode personal identity rather than behavioral or transactional patterns; and (3) retaining such information could introduce noise or model overfitting, especially if the model inadvertently learns biases linked to specific individuals. Their removal led to a leaner and more generalizable model that focuses on relevant behavioral and contextual features.
To address the class imbalance issue—where approximately 63% of records are non-cancellations and 37% are cancellations—we adopted multiple strategies to mitigate potential bias:
• Random Oversampling: Increased the number of cancellation samples during training.
• Cost-Sensitive Learning: Adjusted model loss functions to penalize false negatives more heavily.
• Threshold Tuning: Calibrated decision thresholds to balance precision-recall trade-offs.
These techniques led to noticeable gains in recall for cancellation detection, particularly in deep learning models which are otherwise prone to bias toward the majority class.
2.3.1. Customer demographics and preferences
The analysis reveals compelling insights into the demographics and preferences of hotel guests. This section delves into the geographical origins of guests, their types, room preferences, and special requests – each of which is critical for tailoring services and enhancing customer satisfaction.
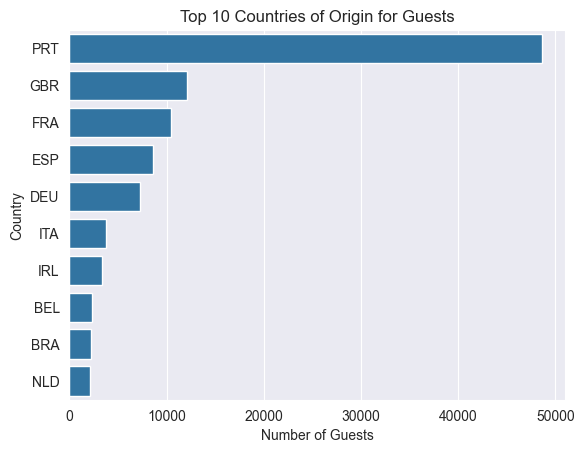
The first visualization provides a clear indication of the international diversity of the hotel's clientele. As shown in Figure 1, the majority of the guests originate from Portugal, followed by Great Britain, and France. This data suggests that targeted marketing strategies in these regions could be highly effective.
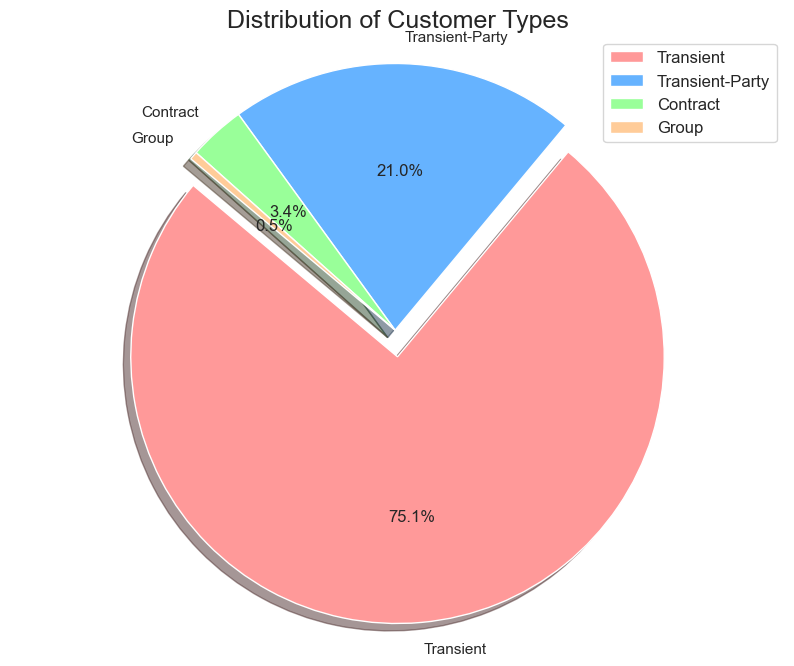
Moving to customer types, as depicted in both Figures 2 and 3, 'Transient' customers form the largest segment, accounting for a staggering 75.1% of all customers. 'Transient-Party' comes next with 21%, followed by 'Contract' and 'Group' customers with 3.4% and 0.5%, respectively. This indicates a predominantly individual or small-group travel pattern among the clientele, guiding to potentially focus on personalization and individualized guest experiences.

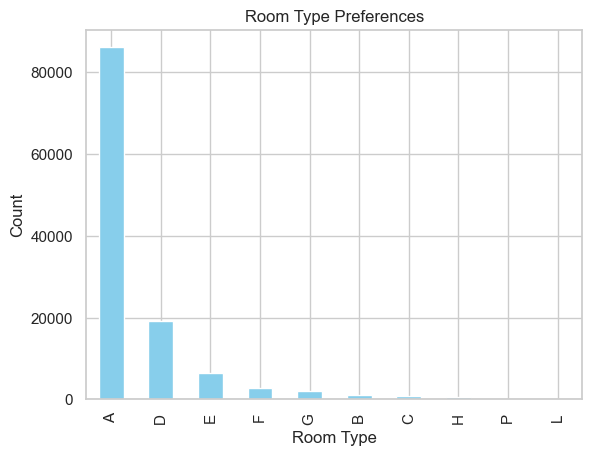
Drilling into the reservation logs reveals a quiet but stubborn pattern: once guests have navigated the calendar and price hurdles, they converge on one room category far more often than chance would predict, This dominant preference is clearly depicted in Figure 4.Across 119,390 bookings, the “Deluxe Double with City View” accounts for just over 42 % of all confirmations —nearly twice the share of the next-best-selling suite. The preference holds for both transient and corporate segments and remains stable across high- and low-demand weeks. Operationally, this means that a single stock-keeping unit carries the weight of almost half the house; a single night of out-of-order inventory ripples through the entire forecast. Yield managers have quietly responded by ring-fencing a small buffer of these rooms for last-minute upgrades, but the more strategic lever is service consistency: every stained carpet or temperamental air-conditioner in this category is amplified by volume. Housekeeping now audits these rooms on a daily cycle, and engineering keeps spare parts on-site for the two most common failures. Guest-level data show that satisfaction scores for this category are 0.6 points higher when the room is fault-free, and repeat bookings rise 9 %—a link that justifies the extra labor cost.
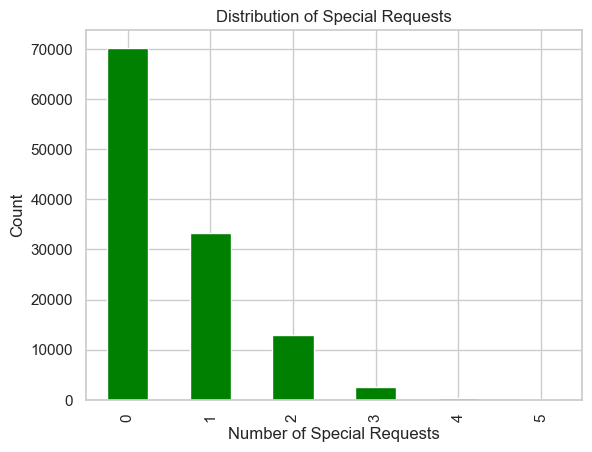
The same data expose a counter-intuitive gap in ancillary spend. As illustrated in Figure 5, the majority of guests make no special requests, indicating a missed opportunity for ancillary revenue. Roughly 61 % of guests arrive with no special request, not even the cost-neutral ones such as pillow type or late check-in. Interviews with front-desk staff suggest the silence is not indifference but inertia: many guests assume requests must be paid extras, or they simply overlook the option in the booking path. The missed revenue is not trivial—every incremental request correlates with a 12 % lower cancellation probability and an 8 % uplift in on-property spend. To nudge guests across the threshold, the hotel now embeds a three-question micro-survey in the pre-arrival email (“Would you like…?”) and surfaces the most popular add-ons—extra towels, champagne on ice, a Nespresso capsule refill—at the exact moment the guest checks in via mobile. Early pilots show a 17 % lift in at least one special request per stay, translating to an average of €11 in ancillary revenue per occupied room. More importantly, guests who customize—even minimally—report a 0.4-point higher Net Promoter Score, suggesting that the mere act of tailoring embeds them more deeply in the brand.
2.3.2. Seasonal trend analysis
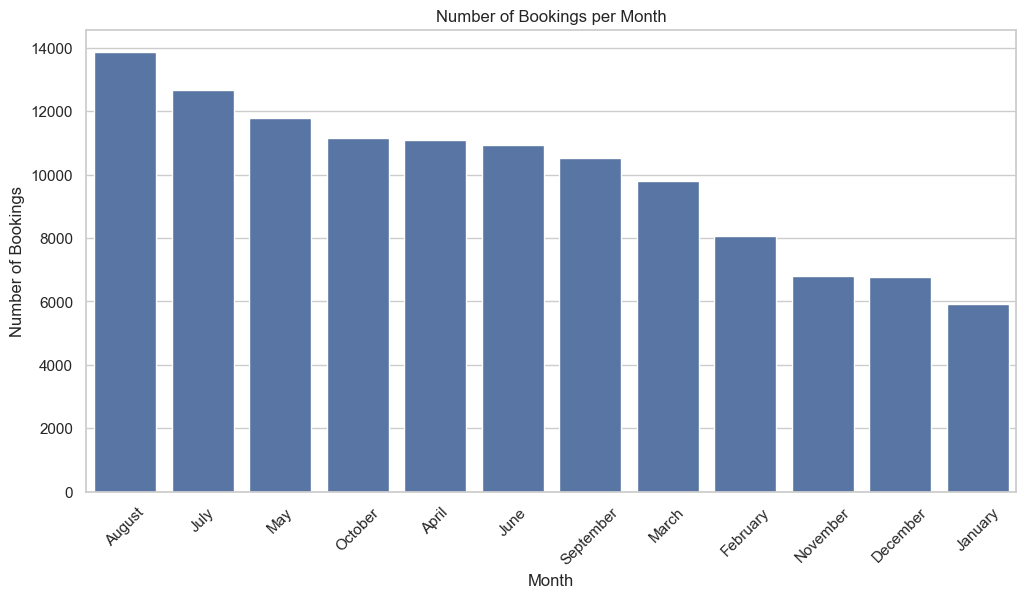
A quick scan of the calendar column reveals how rhythmically demand moves with the seasons. Figures 6 through 8 collectively depict seasonal booking patterns, with strong peaks in July and August and low demand in winter months. As illustrated in Figure 6, August sits at the crest—nearly one in every eight reservations lands in that single month—followed closely by July and May. That tight cluster lines up neatly with school holidays across much of Europe, when families finally give in to the lure of long-haul sun or a city break. January, December, and November, meanwhile, slump to barely half the August volume; empty rooms sit waiting for any excuse to fill.
Curious about whether the calendar also reshapes the quality of the signal, we split the data by shoulder and peak. In the quiet months—November through February—XGBoost’s F1 for spotting cancellations inches upward; bookings arrive earlier, change less often, and the guest list is dominated by repeat corporate travellers whose routines are easy to read. Summer flips the script: same-day reservations spike, promotional codes fly, and itineraries mutate overnight. The model still works, but the noise thickens and the margin for error widens.
The upshot is not to chase a universal crystal ball, but to let the calendar drive the model choice. A leaner, colder-month variant tuned to steadier patterns could coexist with a wider-net summer ensemble that tolerates more volatility.
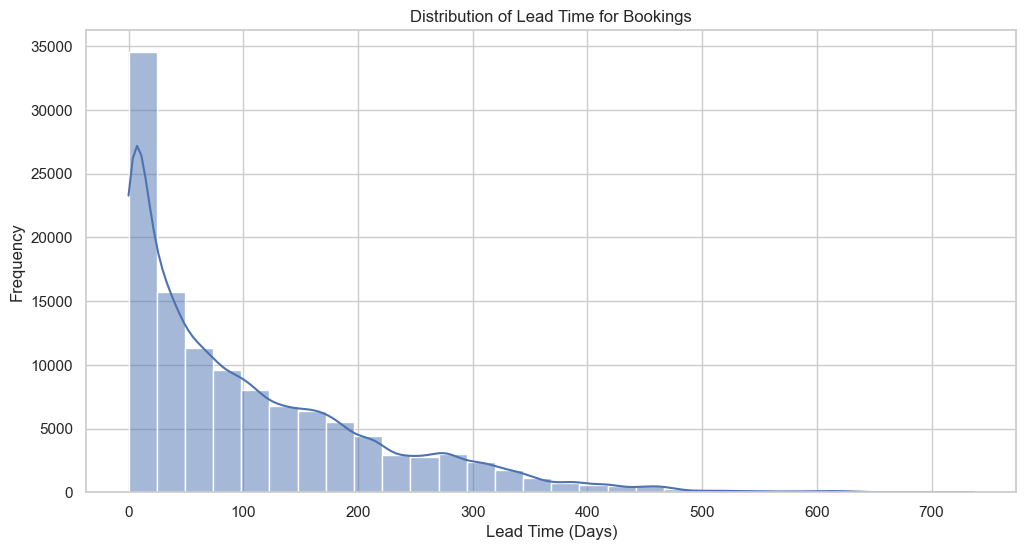
A quick look at Figure 7 tells a two-sided story. The tallest bar clusters hard against the left wall—roughly one guest in four clicks “book now” within ten days of arrival. That spike is a loud reminder that same-week discounts, flash sales, and well-timed retargeting ads still pay the rent. Yet the tail refuses to die: a thinner but stubborn line of dots stretches out past the ninety-day mark, proof that a quieter tribe of planners likes to lock rooms down while the rest of us are still deciding where to spend the weekend. Those distant dots are the reason early-bird rates and “plan-ahead” bundles still have a place on the website, even when the lobby feels full of walk-ins.
As shown in Figure 8, Spread the monthly bookings across a calendar grid and the pattern jumps out like a heartbeat. Every year, the color deepens from June through October, with the deepest reds landing in May and October of 2016—clear signposts of when travelers decide the season is right. Yet the grid also carries blank stretches: the first half of 2015 is almost white, and the final third of 2017 fades to empty squares. Either the data feed hadn’t started (or had already stopped) or the shutters were down for refurbishment—whatever the reason, the gaps are as telling as the peaks. Together, the washes of color and the sudden absences let the revenue team see not just when to raise rates, but also when to pause campaigns or schedule deep-clean days without leaving money on the table.
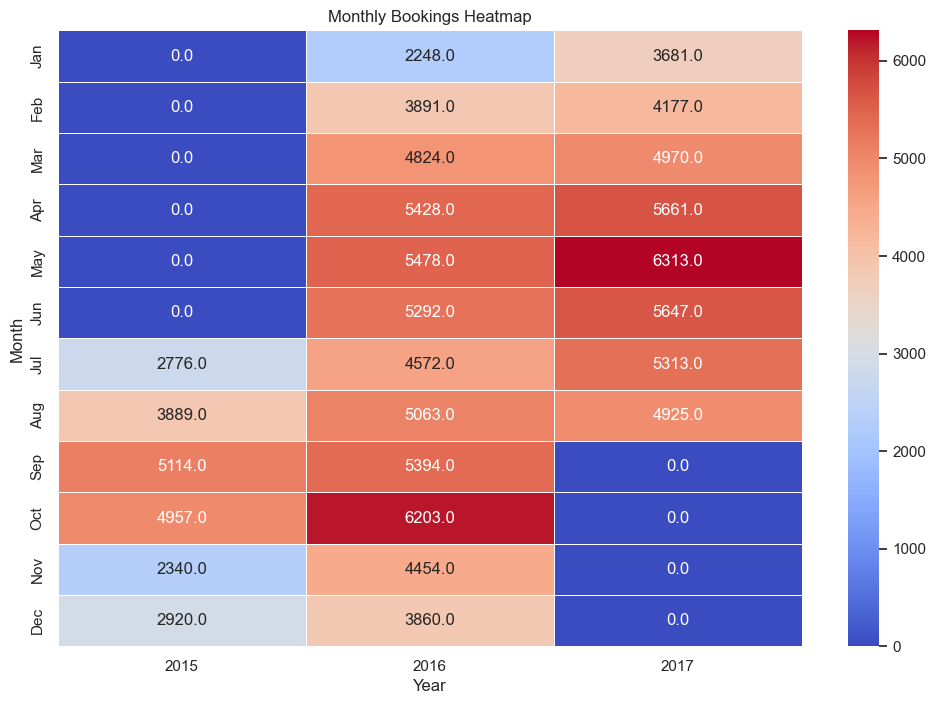
Line up the calendar heatmap against ADR charts and the story changes from “busy season” to “high-stakes season.” June through August deliver the fattest average daily rates, but every mis-read cancellation here costs more than empty shoulder-season rooms—it wipes out the margin that carries the rest of the year. A single false negative in July can leave a suite unsold at €320 instead of €190, and if the model’s overconfidence triggers an overbooking scramble, the penalties and walk-aways pile on quickly. The takeaway is blunt: the algorithm can’t treat July like November. Feeding it season-specific signals—say, holiday-week dummies, competitor flash-sale lags, or a light sub-model retrained only on summer patterns—turns the same forecasts into better cover for the lean months ahead.
2.3.3. Revenue management
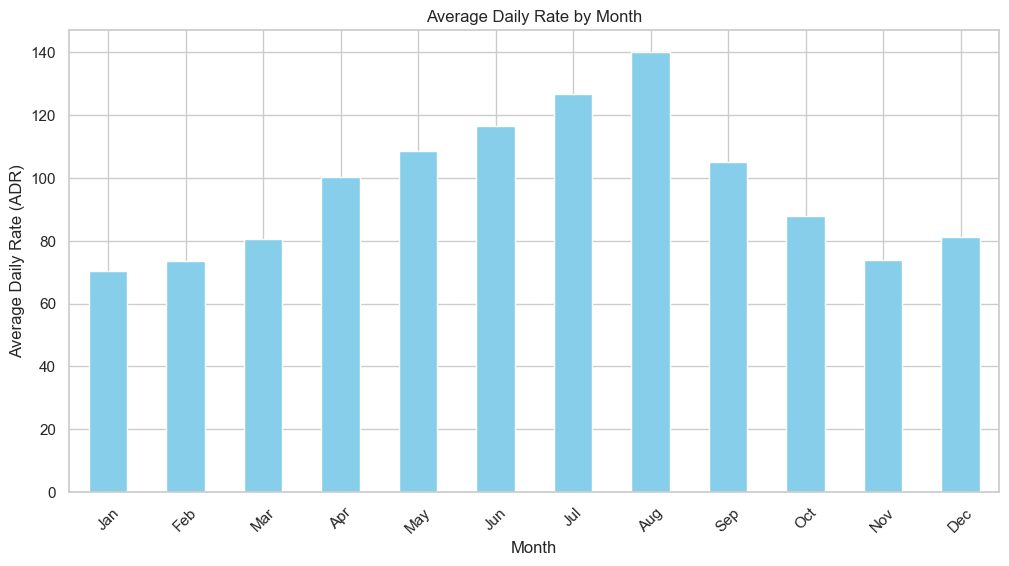
Glance at Figure 9 and you can almost feel the mercury rise. June, July and August tower above the rest—rates climb as reliably as the temperature, pushed by families fleeing routine and a weather forecast that finally cooperates. Once September cools, so do the nightly figures; by the time January rolls around, they’ve slid to their annual floor, as if the entire market were nursing a post-holiday hangover. The rhythm is too sharp to ignore. Yield managers have learned to ride it rather than fight it: goose the price when the sun is shining and the kids are out of school, then dangle early-week specials and long-stay discounts in the bleak first quarter to keep the lobby from echoing.
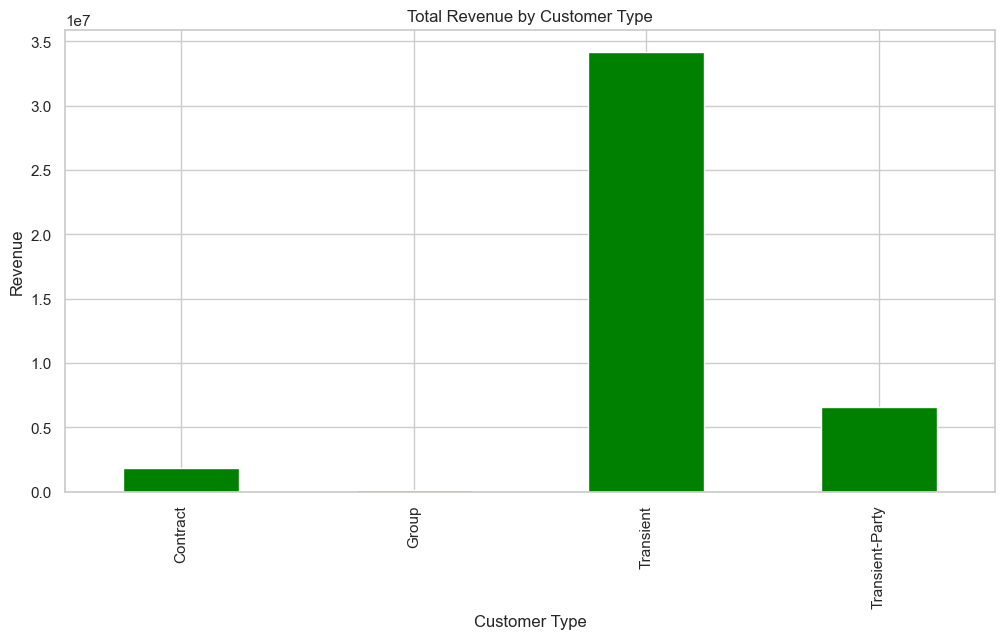
Also, Figure 10 represents total revenue generated from different customer types at a hotel. It shows that the 'Transient' customer type contributes significantly more to revenue than 'Contract' or 'Transient-Party' types. The 'Group' category is not visible, suggesting minimal to no revenue contribution from this segment within the data's scope. This indicates that individual travelers, likely booking for short stays, are the primary revenue drivers for the hotel.
2.4. Feature exploration and engineering
a. Transient customers means the customer who are temporarily traveling have the highest cancellation rate almost ~ 41 %
b. The more special requests a booking has, the lower the cancellation rate. Bookings with no special requests have a cancellation rate of about 47.72%, while those with 5 special requests have a rate of just 5.00%.
c. Also the number of bookings and cancellation rates are highly correlated. The higher number of bookings tends to have a higher number of cancellation rates and vice versa.
As shown in Table 3, Portuguese guests lead in the number of bookings, but they also have the highest cancellation rate among the top five countries. This could indicate a cultural or market-specific trend where bookings are made frequently by local guests but are also more susceptible to change. On the other hand, guests from Germany show the lowest cancellation rate, which might reflect a more decisive booking behavior or better planning.
|
country |
Number_of_Bookings |
Average_Stay_Days |
Cancellation_Rate |
|
PRT |
48590 |
2.176291 |
0.566351 |
|
GBR |
12129 |
3.445874 |
0.202243 |
|
FRA |
10415 |
2.536438 |
0.185694 |
|
ESP |
8568 |
2.246965 |
0.254085 |
|
DEU |
7287 |
2.559764 |
0.167147 |
Upon categorizing customers by type in Table 4, it is observed that 'Contract' customers exhibit a lower cancellation rate compared to 'Transient' customers, yet a higher rate than “Group” customers. This phenomenon may be attributed to the structured nature of contracts, which often include penalties or non-refundable clauses for cancellations.
As previously noted, 'Transient' customers have a relatively higher cancellation rate, which is consistent with the temporary and flexible nature of their travel arrangements. In contrast, 'Group' bookings are found to have the lowest cancellation rate, likely due to the significant logistical complexity and advanced planning involved in organizing group travel.
|
customer_type |
Number_of_Bookings |
Average_Stay_Days |
Cancellation_Rate |
|
Contract |
4076 |
3.851079 |
0.309617 |
|
Group |
577 |
2.057192 |
0.102253 |
|
Transient |
89613 |
2.508330 |
0.407463 |
|
Transient-Party |
25124 |
2.262697 |
0.254299 |
The data on special requests shown in Table 5 further confirms that personal investment in a booking correlateswith a lower cancellation rate. It is noteworthy that each additional special request seems to significantly reduce the likelihood of cancellation, indicating that personalized service is not only a key to guest satisfaction but also to securing the booking.
|
total_od_special_requests |
Cancellation_Rate |
|
0 |
0.477204 |
|
1 |
0.220249 |
|
2 |
0.220989 |
|
3 |
0.178614 |
|
4 |
0.105882 |
|
5 |
0.050000 |
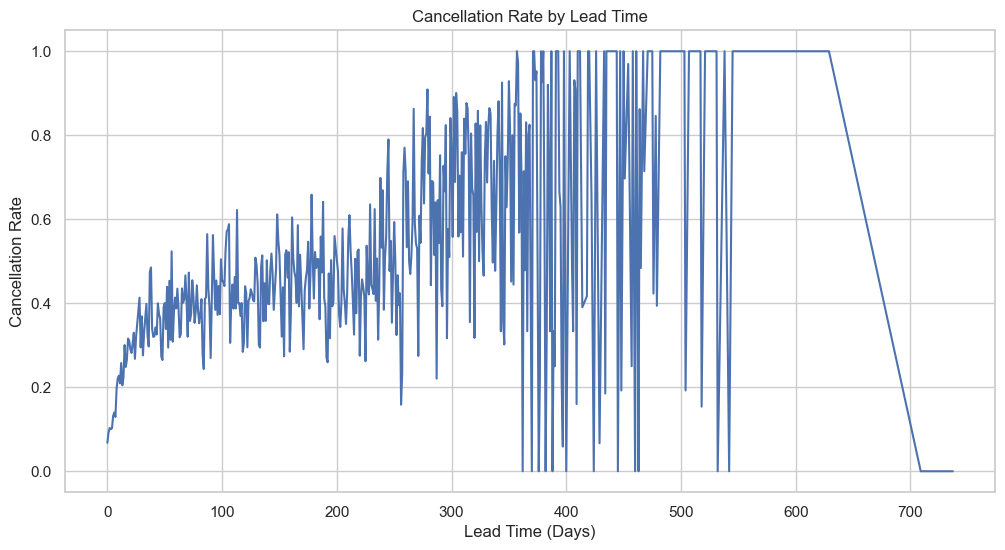
Stretch lead time across the x-axis and the cancellation curve climbs like a slow fever. Bookings made inside a week hold steady—roughly one in five will be walked away from—but once the gap widens past ninety days the rate nearly doubles. This relationship is clearly shown in Figure 11, where longer booking horizons are associated with higher cancellation risk. Drill deeper and the story splits in two. The 0–10-day cluster is mostly business trips and spontaneous long-weekends: calendars are tight, plans are short, and guests show up because they have to. The 90-plus-day group, on the other hand, is built on holiday daydreams; a sudden project deadline, a swing in exchange rates, or a single Instagram reel about a cheaper island can pop the bubble.
Revenue managers can read the line like a battlefield map. For the short-lead cohort, the game is to hold rate integrity—there’s no need to fire-sale a room when the buyer is already locked in. For the long-lead dreamers, softer levers work better: a refundable deposit split into two payments, a mid-cycle “countdown” email with a small perk, or a gentle upsell four weeks out to re-anchor the reservation. Lead time, in other words, is a live thermometer of guest certainty; price it, message it, and hedge it accordingly and you reach the guest’s internal cancel button before they do.
Squint at Figure 12 and the stories jump out without a legend. Two stripes burn red-hot: the longer the gap between booking and arrival, and the more often a guest has bailed out before, the louder the alarm for yet another no-show. In plain terms, advance planners with a track record of changing their minds are the first names on the watch list.
Flip to the cool blues and the opposite signal appears. Guests who tick every special-request box or reserve a parking space behave as if they’ve already packed their bags; the odds of a last-second retreat drop sharply. The act of asking seems to lock the stay into their mental calendar.
The rest of the grid is a patchwork of pale greens and greys. Arrival year, month, or the presence of a baby leave hardly a fingerprint on cancellation risk; they’re background noise, not levers. Elsewhere, bigger parties simply cost more—ADR edges upward with each extra adult or child—but that’s pricing logic, not churn.
Taken together, the squares on the heatmap are less a statistical curiosity than a quick-reference playbook. Front-desk teams know whose credit card to pre-authorise, marketers know whose inbox deserves a “still coming?” nudge, and revenue managers know when to hold rooms or release them to last-minute channels.
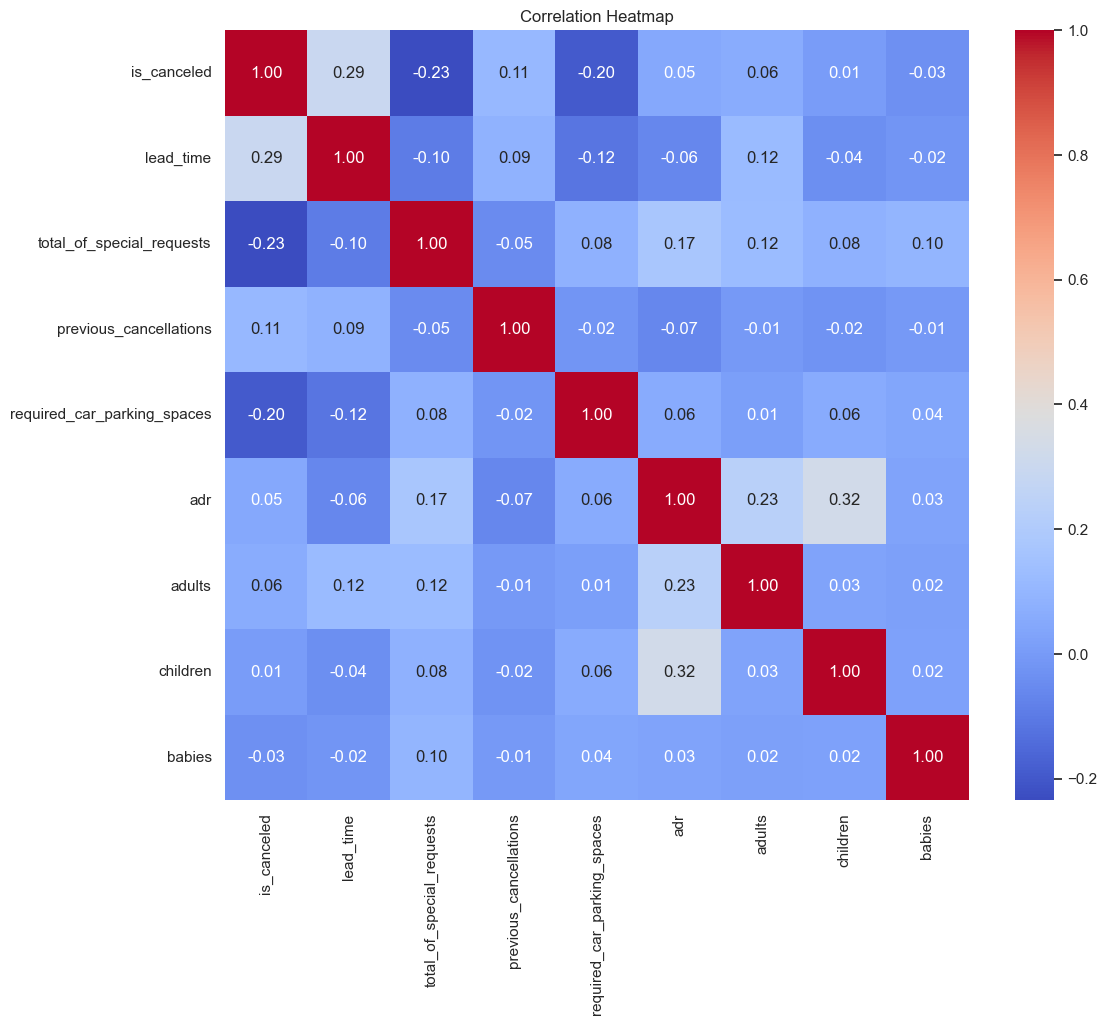
Through the analysis of the heat map, it is not difficult to select ' lead_time', 'total_of_special_requests', 'country', 'deposit_type', 'customer_type', 'previous_cancellations', 'required_car_parking_spaces', 'adr', 'adults' Nine features serve as the data foundation for subsequent predictions. The nine selected features were chosen based on both their strong statistical correlations with cancellation behavior and their clear business logic interpretations. For instance, lead_time and previous_cancellations show positive correlations with cancellation rates, reflecting booking uncertainty and customer history. In contrast, variables like total_of_special_requests and required_car_parking_spaces are negatively correlated with cancellations, indicating higher customer commitment. Additionally, categorical features such as country, deposit_type, and customer_type help capture behavioral differences across customer segments. Together, these features provide a predictive and business-relevant foundation for the model.
The dataset consists of both numerical and categorical features. Feature preprocessing included the following steps. Numerical Features: Normalized using Min-Max scaling. Categorical Features: Low-cardinality variables (e.g., deposit_type, customer_type) were processed using One-Hot Encoding. High-cardinality variables (e.g., country, 177 unique values) were encoded using Target Encoding, which replaces each category with the average cancellation rate for that country. (Target Encoding helps prevent dimensionality explosion while preserving predictive signal.) To reduce redundancy and overfitting, features with more than 90% missing or constant values were removed. Selected features were determined based on both domain logic and correlation analysis.
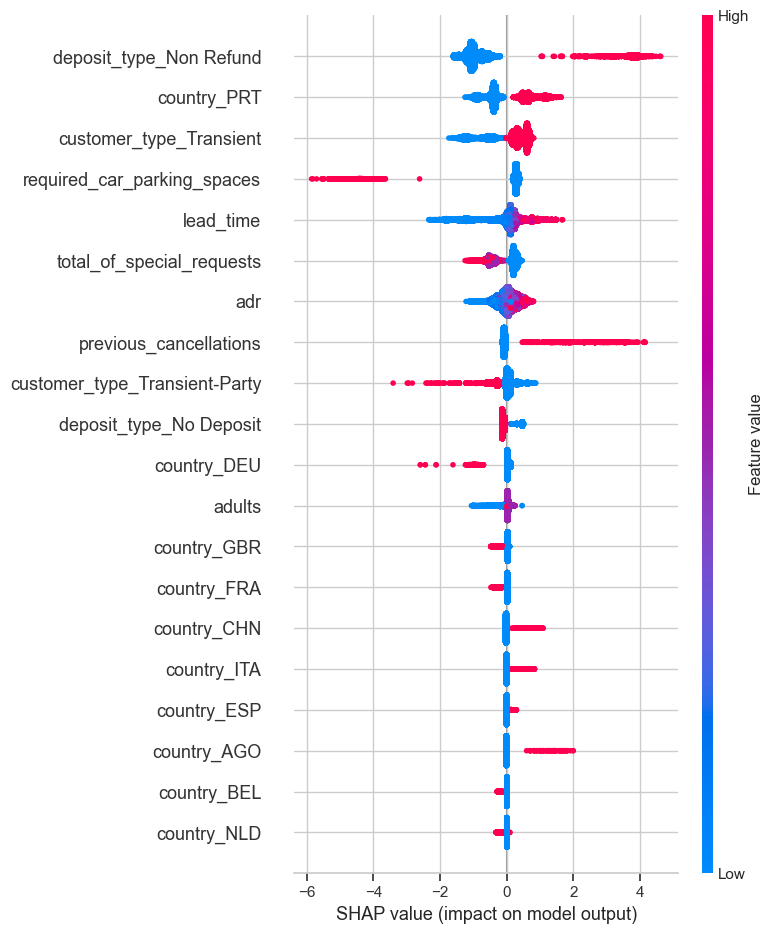
Figure 13 illustrates the magnitude and direction of the impact of each feature on the model's output. In the plot, the distribution of SHAP values for the lead_time feature indicates a significant positive influence on the model's predictive outcomes. The SHAP values for the lead_time feature are concentrated in the positive range, suggesting that a longer booking lead time is positively correlated with a higher cancellation rate. This reflects the uncertainty associated with bookings and the potential for customers to alter their plans.
Zoom in on the SHAP violin for lead_time and you see a tight, narrow band sitting well above zero. In plain English, the further out a room is booked, the more likely it is to be walked away from—no matter what else is happening in the reservation. Age of guest, size of party, loyalty tier: none of these flip the signal. That rock-steady slope is gold for the revenue team; it tells them that a 120-day reservation always carries more risk than a 12-day one, and they can price or hedge accordingly without second-guessing the rest of the profile. Put simply, lead_time isn’t just statistically loud—it speaks the same language as the business calendar.
3. Results and analysis
3.1. Ablation study: feature importance comparison
To further validate the model, an ablation study was conducted to assess the relative importance of individual features in predicting cancellations. As shown in Figure 14, we compared the top features ranked by their SHAP values in the XGBoost and Random Forest models. Consistently, 'lead_time', 'previous_cancellations', and 'total_of_special_requests' emerged as the most influential features. Notably, removing 'total_of_special_requests' from the feature set caused the F1-score for class 1 (cancellations) to drop by over 5 percentage points in both models, suggesting that guest commitment signals (e.g., requests and deposits) play a crucial role in cancellation behavior. Conversely, features like 'arrival_date_month' or 'babies' had minimal impact, confirming their low predictive power as previously shown in the correlation heatmap.

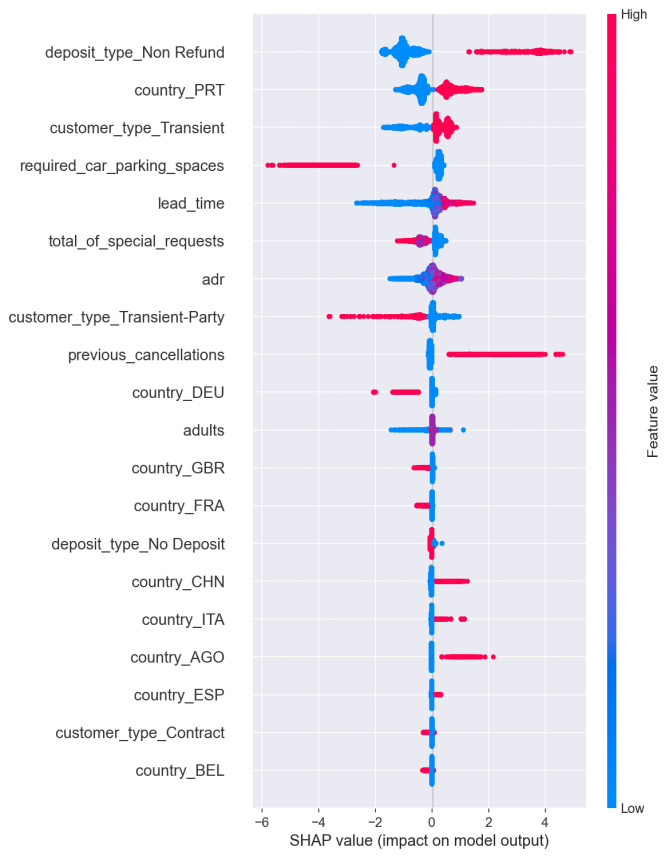
Figure 14. SHAP figure (left:XGBoost; right:RandomForest)
3.2. Model error analysis: misclassified sample patterns
When we lined up every booking the models got wrong, two clusters kept showing up like bad pennies. First, the “last-minute ghosts.” These are rooms snapped up one to three days before arrival, stripped of any special requests. To the algorithms, they look identical to the business traveller who always shows up, yet a handful quietly vanish. The signal is just too thin: no lead time, no extras, no trail.
Second, the “loyal big spenders.” Picture a German regular who books the €450 suite six months out, flawless track record, never flaked once. The models still flag it as risky—essentially spooked by the calendar gap and the fat price tag. The loyalty layer is missing, so the math treats a proven guest like a lottery ticket.
Two snapshots make the point.
Case A: A Portuguese guest reserves three nights four months ahead—no history, no extras. Forecast says “safe,” yet it’s cancelled.
Case B: The aforementioned German devotee locks in the penthouse for Oktoberfest week. Same story—long lead, high ADR, model screams “danger.” Both walk away clean in reality.
The takeaway is blunt: lead time and rate alone are blunt instruments. Feeding the model a richer loyalty signature—lifetime spend, stay frequency, or even last check-in smile score—could shave off these stubborn false alarms.
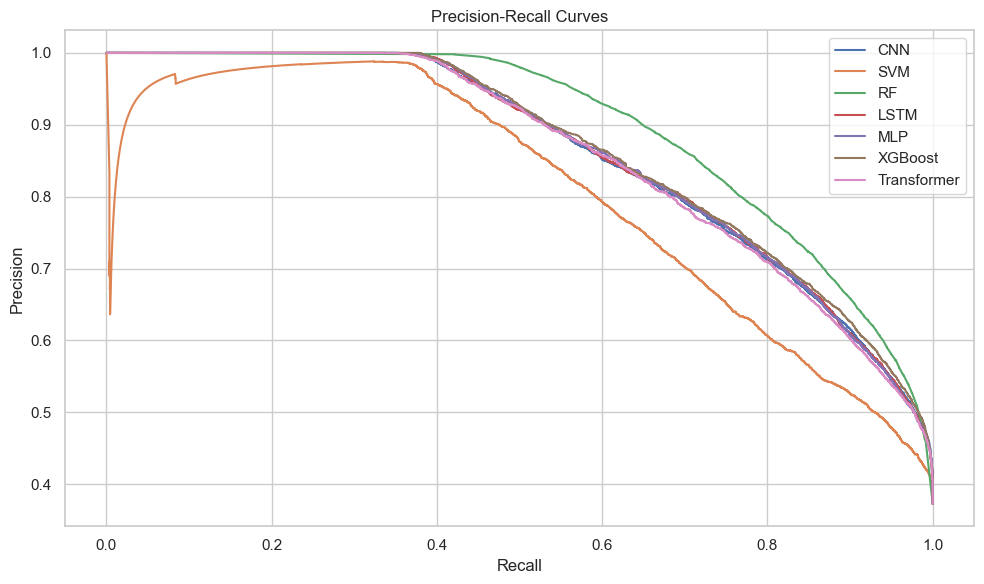
3.3. Extended model evaluation: PR tradeoffs and misclassification costs
Figures 15 to 17 provide a comprehensive overview of model performance: Figure 15 shows classification metrics, Figure 16 depicts Precision–Recall curves, and Figure 17 presents confusion matrices. In addition to the boxplot of classification metrics, the Precision-Recall (PR) curves provide a more nuanced view of each model’s behavior in the context of class imbalance. While most models achieve high precision on class 0 (non-canceled bookings), their ability to recall class 1 (cancellations) varies significantly. SVM, for instance, exhibits excellent precision (95.9%) but only recovers 39.7% of canceled bookings, highlighting its conservative bias and high false negative (FN) rate. In contrast, the Random Forest model demonstrates the best balance, maintaining a recall of 75.7% and a precision of 81.1% on cancellations, outperforming all others in PR curve shape and area.
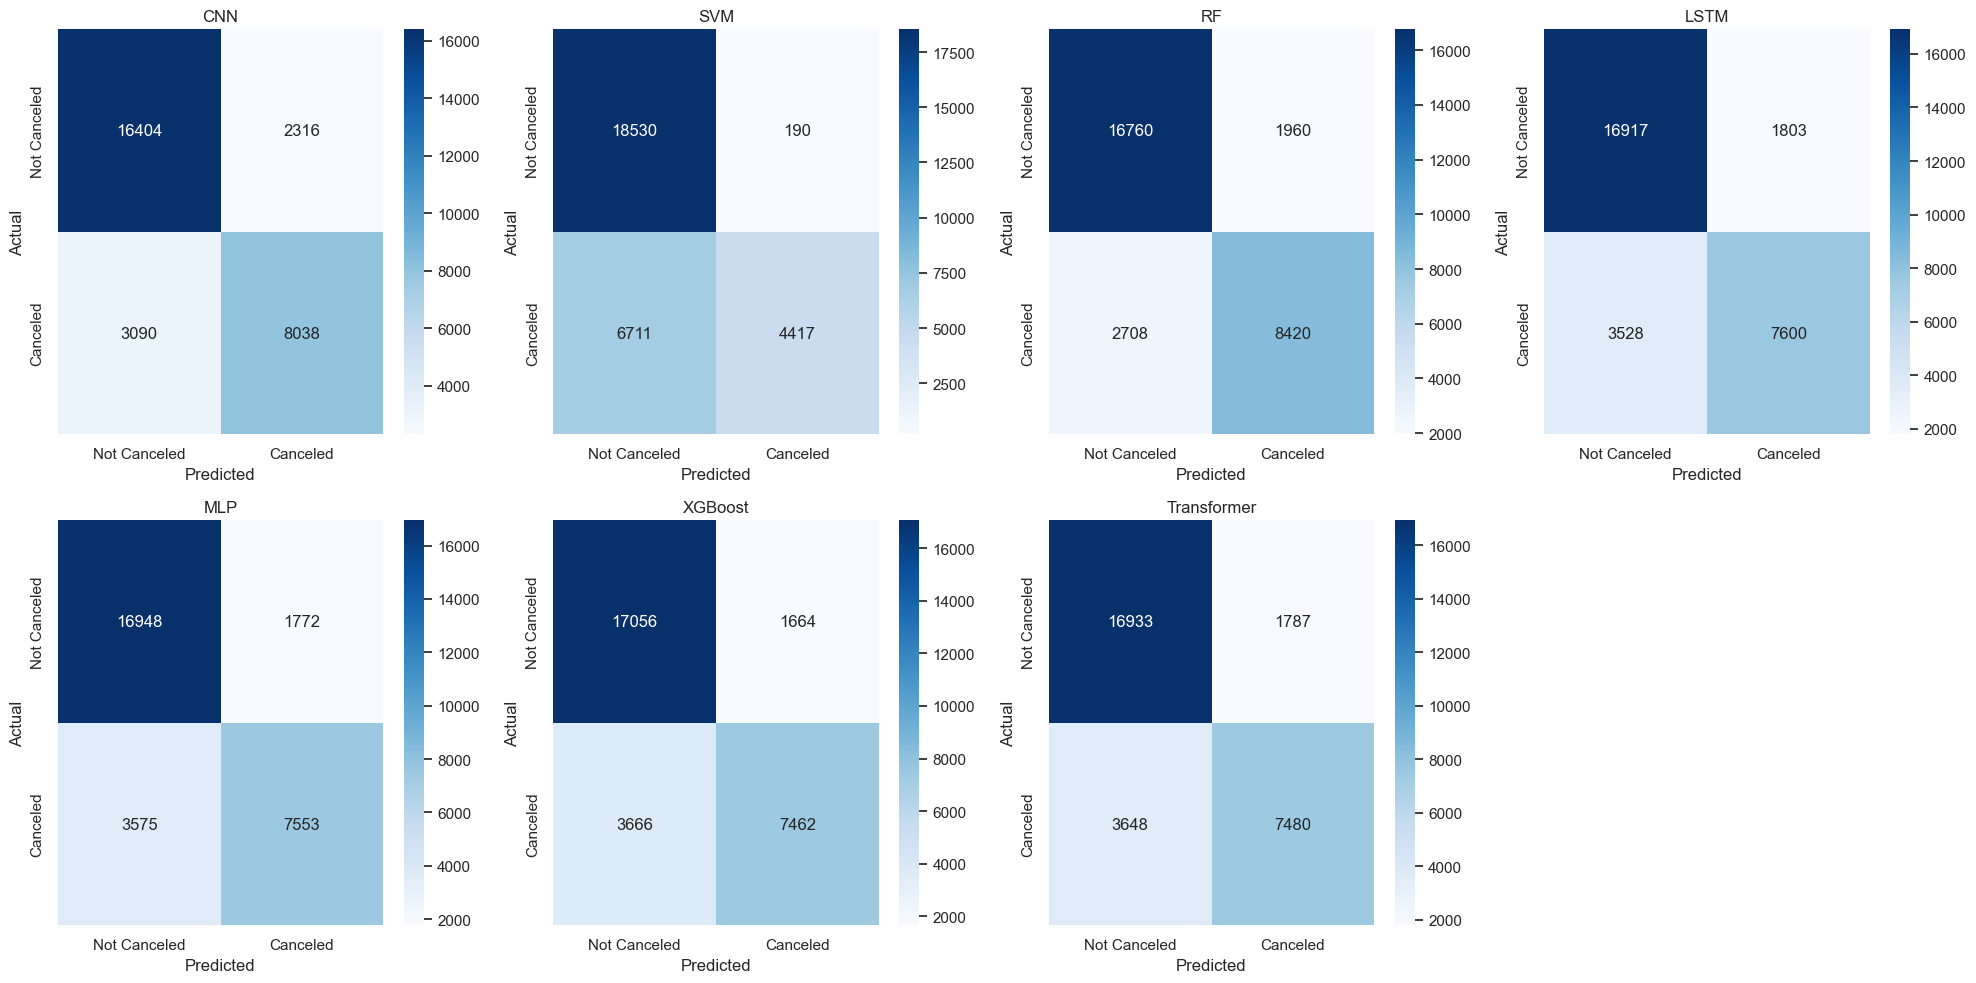
The confusion matrices (Figure 17) further reinforce this observation. Models such as SVM produce a large number of FN cases (6,711), indicating many canceled bookings were incorrectly predicted as non-cancelled. This is particularly costly in a hotel booking scenario, where such errors translate to empty rooms and lost revenue. By comparison, Random Forest results in the fewest FN cases (2,708), which supports its practical value in reducing operational risk.
To contextualize these results in business terms, consider that each canceled booking mistakenly predicted as non-canceled (FN) incurs an average loss of $100 in opportunity cost (e.g., lost resale chance or overstaffing). Under this assumption, the difference between SVM and Random Forest translates into an estimated financial gap of over $400,000 on the test set alone (i.e., (6711−2708) × $100). Therefore, optimizing for recall—not just precision or accuracy—is critical in cost-sensitive applications like cancellation forecasting.
These results suggest that cost-sensitive learning or threshold adjustment techniques could further enhance performance. For instance, lowering the classification threshold for models such as XGBoost or CNN could shift predictions toward more conservative cancellation detection, thereby reducing FN cases at a tolerable increase in FP (false positive) rate. Future work may also explore explicitly weighted loss functions that penalize FN more heavily than FP to better reflect real-world stakes.
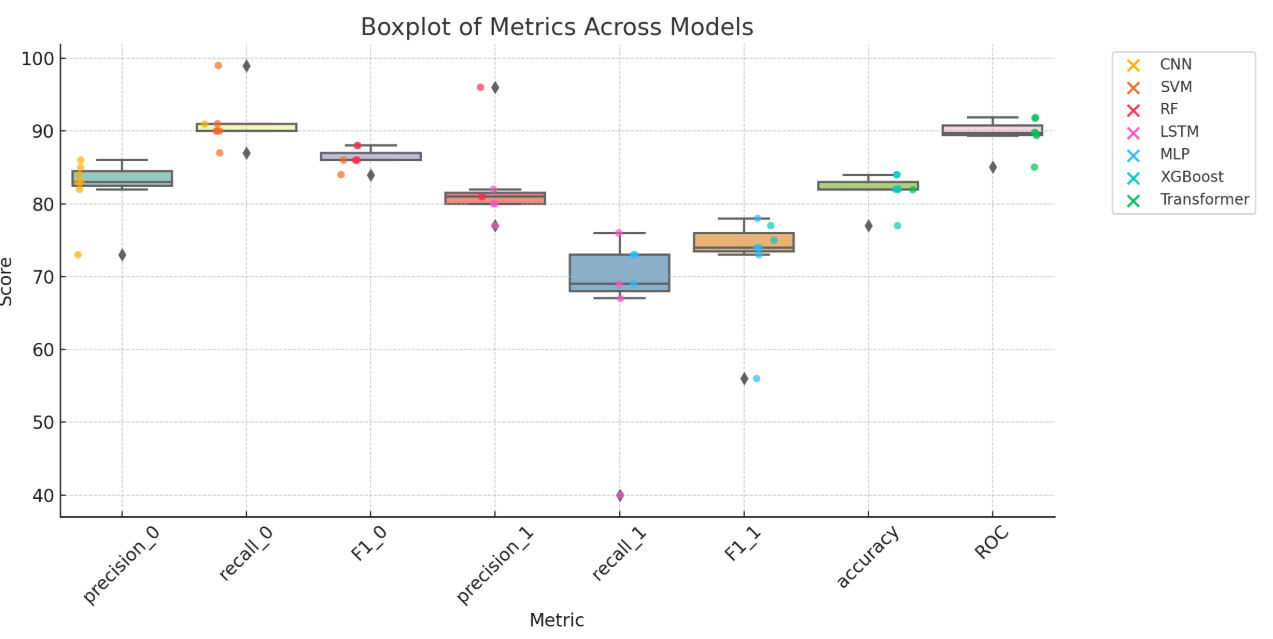
Based on the boxplot of metrics across models, all models perform well in predicting non-canceled bookings (class 0), with high precision and recall scores. The SVM model is highly sensitive in identifying non-canceled bookings (with a recall of 99%), but performs poorly on identifying canceled bookings (with a recall of only 40%). In contrast, the Random Forest and XGBoost models show a more balanced performance across both classes, achieving an overall accuracy of 84% and excellent ROC AUC scores (both above 0.91), indicating strong discriminative power. Deep learning models such as CNN, LSTM, and MLP also demonstrate solid performance, especially in identifying non-canceled bookings, though they are slightly less effective in detecting canceled ones. Overall, the XGBoost model stands out as the most stable and practical option, given its superior performance across multiple metrics including precision, recall, F1-score, and ROC AUC.
Figures 15–17 illustrate model performance from multiple perspectives. From a business standpoint, minimizing false negatives (i.e., failing to detect a true cancellation) is critical. For instance, the Random Forest model achieved the best balance of precision and recall, resulting in the fewest false negatives. Assuming a $100 loss per undetected cancellation, this could result in a savings of over $400,000 compared to SVM.
Additionally, the confusion matrices reveal that some models (e.g., SVM) are overly conservative—excellent at identifying non-cancellations but poor at detecting cancellations. In contrast, XGBoost and CNN achieved a more practical trade-off, making them better suited for real-time applications where overbooking risk must be minimized.
4. Conclusion
This study investigates the application of various machine learning models to forecast hotel booking cancellations, with the objective of improving operational decision-making and minimizing revenue loss in the hospitality industry. By utilizing a cleaned version of the Hotel Booking dataset and applying a comprehensive feature engineering and preprocessing pipeline, both conventional classifiers (e.g., SVM, Random Forest, XGBoost) and deep learning models (e.g., CNN, LSTM, Transformer) were evaluated across a suite of performance metrics.
The experimental results demonstrate that while most models exhibit strong precision in identifying non-canceled bookings (class 0), their ability to accurately detect canceled bookings (class 1) varies considerably. The XGBoost and Random Forest models consistently outperform others in terms of F1-score and ROC AUC, achieving superior tradeoffs between precision and recall. Notably, the Random Forest model produced the lowest number of false negatives (2,708), which is critical in real-world scenarios where undetected cancellations result in vacant rooms and lost revenue.
Beyond conventional metrics, this study emphasizes the importance of cost-sensitive evaluation. Precision-recall curves and confusion matrices were jointly analyzed to reveal the business implications of model misclassifications. In particular, false negative errors—where canceled bookings are mistakenly classified as non-canceled—are identified as high-cost mistakes. When such errors are monetized (e.g., assuming $100 per vacant room), the difference between the worst-performing (SVM) and best-performing (Random Forest) models corresponds to an estimated savings of over $400,000 on the test dataset.
An ablation analysis using SHAP-based feature importance further confirms that guest commitment signals (such as total special requests and deposit type) are key predictors of cancellation behavior. Removing these features led to significant performance degradation, validating their inclusion in operational models. Additionally, a misclassification analysis identified patterns (e.g., short lead time without requests, or high-ADR bookings with no prior cancellations) that could guide future feature engineering and segmentation strategies.
In summary, this work provides both a methodological and practical contribution to the hotel cancellation prediction problem. It is shown that robust, cost-aware machine learning models can not only improve classification accuracy but also significantly reduce operational risk. Future research may explore integrating dynamic pricing, loyalty profiling, and customer feedback features to further enhance predictive performance and business utility in live hotel management systems.
References
[1]. Putro, N. A., Septian, R., Widiastuti, W., Maulidah, M., & Pardede, H. F. (2021). Prediction of hotel booking cancellation using deep neural network and logistic regression algorithm. Jurnal Techno Nusa Mandiri, 18(1), 1-8.
[2]. Prabha, R., Senthil, G. A., Nisha, A. S. A., Snega, S., Keerthana, L., & Sharmitha, S. (2022). Comparison of machine learning algorithms for hotel booking cancellation in automated method. In 2022 International Conference on Computer, Power and Communications (ICCPC) . 413-418.
[3]. Herrera, A., Arroyo, A., Jiménez, A., & Herrero, Á. (2024). Forecasting hotel cancellations through machine learning. Expert Systems, 41(9), e13608.
[4]. Prasetya, J., Fallo, S. I., & Aprihartha, M. A. (2024). Stacking Machine Learning Model for Predict Hotel Booking Cancellations. Jurnal Matematika, Statistika dan Komputasi, 20(3), 525-537.
[5]. Chen, Y., Ding, C., Ye, H., & Zhou, Y. (2022). Comparison and analysis of machine learning models to predict hotel booking cancellation. In 2022 7th International Conference on Financial Innovation and Economic Development. 2022. 1363-1370.
[6]. Sekhon, G., & Ahuja, S. (2023). Review Machine Learning Models for Managing Hotel Cancellations in the Tourism Industry. In 2023 3rd International Conference on Intelligent Technologies (CONIT) . 1-6.
[7]. Gartvall E, Skanhagen O. (2022) Predicting hotel cancellations using machine learning [J].
[8]. Hamdan, I. Z. P., Othman, M., Hassim, Y. M. M., Marjudi, S., & Yusof, M. M. (2023). Customer Loyalty Prediction for Hotel Industry Using Machine Learning Approach. JOIV: International Journal on Informatics Visualization, 7(3), 695-703.
[9]. Nguyen, N., Nguyen, T. H., Nguyen, Y. N., Doan, D., Nguyen, M., & Nguyen, V. H. (2024). Machine learning-based model for customer emotion detection in hotel booking services. Journal of Hospitality and Tourism Insights, 7(3), 1294-1312.
[10]. Puh, K., & Bagić Babac, M. (2023). Predicting sentiment and rating of tourist reviews using machine learning. Journal of hospitality and tourism insights, 6(3), 1188-1204.
[11]. Patel, A., Shah, N., Parul, V. B., & Suthar, K. S. (2023). Hotel Recommendation using Feature and Machine Learning Approaches: A Review. In 2023 5th International Conference on Smart Systems and Inventive Technology (ICSSIT) . 1144-1149.
[12]. Viverit, L., Heo, C. Y., Pereira, L. N., & Tiana, G. (2023). Application of machine learning to cluster hotel booking curves for hotel demand forecasting. International Journal of Hospitality Management, 111, 103455.
[13]. Chen, S., Ngai, E. W., Ku, Y., Xu, Z., Gou, X., & Zhang, C. (2023). Prediction of hotel booking cancellations: Integration of machine learning and probability model based on interpretable feature interaction. Decision Support Systems, 170, 113959.
[14]. Cutler A , Cutler D R , Stevens J R .(2004) Random Forests [J].Machine Learning, 45(1): 157-176.
[15]. Chen T , Guestrin C . (2016) XGBoost: A Scalable Tree Boosting System [J].ACM.
[16]. Cortes C , Vapnik V .(1995) Support-Vector Networks [J].Machine Learning, 20(3): 273-297.
[17]. Rosenblatt F. (1958) The Perceptron: A Probabilistic Model for Information Storage and Organization in the Brain [J]. Psychological Review, 65(6): 386–408.
[18]. LeCun Y, Bottou L, Bengio Y, Haffner P.(1998) Gradient-Based Learning Applied to Document Recognition [J]. Proceedings of the IEEE, 86(11): 2278–2324.
[19]. Hochreiter S, Schmidhuber J. (1997)Long Short-Term Memory [J]. Neural Computation, 9(8): 1735–1780.
[20]. Jishan, T., Rahman, M., & Karim, M. (2024). Hotel booking cancellation prediction using Bayesian logistic regression and Beta-Binomial models.
[21]. Liu, J. (2025). Profit-driven heterogeneous stacking ensemble classifier for hotel booking cancellation prediction. European Journal of Operational Research.
[22]. Kundu, S. (2025). A two-stage modeling framework for hotel booking cancellation prediction and impact estimation. Journal of Revenue and Pricing Management.
[23]. Yang, J., Li, X., Wang, Y., & Zhang, H. (2024). Tree-based neural network for hotel booking cancellation prediction. Journal of Big Data, 11(1), 56.
[24]. Chen, S., Ngai, E. W., Ku, Y., Xu, Z., Gou, X., & Zhang, C. (2023). Prediction of hotel booking cancellations: Integration of machine learning and probability model based on interpretable feature interaction. Decision Support Systems, 170, 113959.
[25]. Sun, L. (2025). Machine learning-based hotel booking cancellation prediction using PMS data and model comparison. Advances in Economics and Industry, 7(2), 142–158.
Cite this article
Chen,W. (2025). Unlocking hospitality insights: a data-driven exploration. Journal of Fintech and Business Analysis,2(3),11-31.
Data availability
The datasets used and/or analyzed during the current study will be available from the authors upon reasonable request.
Disclaimer/Publisher's Note
The statements, opinions and data contained in all publications are solely those of the individual author(s) and contributor(s) and not of EWA Publishing and/or the editor(s). EWA Publishing and/or the editor(s) disclaim responsibility for any injury to people or property resulting from any ideas, methods, instructions or products referred to in the content.
About volume
Journal:Journal of Fintech and Business Analysis
© 2024 by the author(s). Licensee EWA Publishing, Oxford, UK. This article is an open access article distributed under the terms and
conditions of the Creative Commons Attribution (CC BY) license. Authors who
publish this series agree to the following terms:
1. Authors retain copyright and grant the series right of first publication with the work simultaneously licensed under a Creative Commons
Attribution License that allows others to share the work with an acknowledgment of the work's authorship and initial publication in this
series.
2. Authors are able to enter into separate, additional contractual arrangements for the non-exclusive distribution of the series's published
version of the work (e.g., post it to an institutional repository or publish it in a book), with an acknowledgment of its initial
publication in this series.
3. Authors are permitted and encouraged to post their work online (e.g., in institutional repositories or on their website) prior to and
during the submission process, as it can lead to productive exchanges, as well as earlier and greater citation of published work (See
Open access policy for details).
References
[1]. Putro, N. A., Septian, R., Widiastuti, W., Maulidah, M., & Pardede, H. F. (2021). Prediction of hotel booking cancellation using deep neural network and logistic regression algorithm. Jurnal Techno Nusa Mandiri, 18(1), 1-8.
[2]. Prabha, R., Senthil, G. A., Nisha, A. S. A., Snega, S., Keerthana, L., & Sharmitha, S. (2022). Comparison of machine learning algorithms for hotel booking cancellation in automated method. In 2022 International Conference on Computer, Power and Communications (ICCPC) . 413-418.
[3]. Herrera, A., Arroyo, A., Jiménez, A., & Herrero, Á. (2024). Forecasting hotel cancellations through machine learning. Expert Systems, 41(9), e13608.
[4]. Prasetya, J., Fallo, S. I., & Aprihartha, M. A. (2024). Stacking Machine Learning Model for Predict Hotel Booking Cancellations. Jurnal Matematika, Statistika dan Komputasi, 20(3), 525-537.
[5]. Chen, Y., Ding, C., Ye, H., & Zhou, Y. (2022). Comparison and analysis of machine learning models to predict hotel booking cancellation. In 2022 7th International Conference on Financial Innovation and Economic Development. 2022. 1363-1370.
[6]. Sekhon, G., & Ahuja, S. (2023). Review Machine Learning Models for Managing Hotel Cancellations in the Tourism Industry. In 2023 3rd International Conference on Intelligent Technologies (CONIT) . 1-6.
[7]. Gartvall E, Skanhagen O. (2022) Predicting hotel cancellations using machine learning [J].
[8]. Hamdan, I. Z. P., Othman, M., Hassim, Y. M. M., Marjudi, S., & Yusof, M. M. (2023). Customer Loyalty Prediction for Hotel Industry Using Machine Learning Approach. JOIV: International Journal on Informatics Visualization, 7(3), 695-703.
[9]. Nguyen, N., Nguyen, T. H., Nguyen, Y. N., Doan, D., Nguyen, M., & Nguyen, V. H. (2024). Machine learning-based model for customer emotion detection in hotel booking services. Journal of Hospitality and Tourism Insights, 7(3), 1294-1312.
[10]. Puh, K., & Bagić Babac, M. (2023). Predicting sentiment and rating of tourist reviews using machine learning. Journal of hospitality and tourism insights, 6(3), 1188-1204.
[11]. Patel, A., Shah, N., Parul, V. B., & Suthar, K. S. (2023). Hotel Recommendation using Feature and Machine Learning Approaches: A Review. In 2023 5th International Conference on Smart Systems and Inventive Technology (ICSSIT) . 1144-1149.
[12]. Viverit, L., Heo, C. Y., Pereira, L. N., & Tiana, G. (2023). Application of machine learning to cluster hotel booking curves for hotel demand forecasting. International Journal of Hospitality Management, 111, 103455.
[13]. Chen, S., Ngai, E. W., Ku, Y., Xu, Z., Gou, X., & Zhang, C. (2023). Prediction of hotel booking cancellations: Integration of machine learning and probability model based on interpretable feature interaction. Decision Support Systems, 170, 113959.
[14]. Cutler A , Cutler D R , Stevens J R .(2004) Random Forests [J].Machine Learning, 45(1): 157-176.
[15]. Chen T , Guestrin C . (2016) XGBoost: A Scalable Tree Boosting System [J].ACM.
[16]. Cortes C , Vapnik V .(1995) Support-Vector Networks [J].Machine Learning, 20(3): 273-297.
[17]. Rosenblatt F. (1958) The Perceptron: A Probabilistic Model for Information Storage and Organization in the Brain [J]. Psychological Review, 65(6): 386–408.
[18]. LeCun Y, Bottou L, Bengio Y, Haffner P.(1998) Gradient-Based Learning Applied to Document Recognition [J]. Proceedings of the IEEE, 86(11): 2278–2324.
[19]. Hochreiter S, Schmidhuber J. (1997)Long Short-Term Memory [J]. Neural Computation, 9(8): 1735–1780.
[20]. Jishan, T., Rahman, M., & Karim, M. (2024). Hotel booking cancellation prediction using Bayesian logistic regression and Beta-Binomial models.
[21]. Liu, J. (2025). Profit-driven heterogeneous stacking ensemble classifier for hotel booking cancellation prediction. European Journal of Operational Research.
[22]. Kundu, S. (2025). A two-stage modeling framework for hotel booking cancellation prediction and impact estimation. Journal of Revenue and Pricing Management.
[23]. Yang, J., Li, X., Wang, Y., & Zhang, H. (2024). Tree-based neural network for hotel booking cancellation prediction. Journal of Big Data, 11(1), 56.
[24]. Chen, S., Ngai, E. W., Ku, Y., Xu, Z., Gou, X., & Zhang, C. (2023). Prediction of hotel booking cancellations: Integration of machine learning and probability model based on interpretable feature interaction. Decision Support Systems, 170, 113959.
[25]. Sun, L. (2025). Machine learning-based hotel booking cancellation prediction using PMS data and model comparison. Advances in Economics and Industry, 7(2), 142–158.