


1. Introduction
Per capita disposable income refers to the income that residents can freely use, which represents their purchasing power and serves as a key indicator reflecting their income level. It is an important measure for assessing the economic conditions and living standards of a country or region, and holds significant relevance in policymaking, economic development evaluation, and the enhancement of quality of life. Per capita disposable income reflects the economic capacity of residents and the level of income they can control.
The objective of this study is to assess the past per capita disposable income trends among inhabitants of Hubei Province. This will be achieved through the utilization of three distinct time
series prediction techniques: Exponential Smoothing (Holt-Winter), Autoregressive Moving Average (ARMA), and Autoregressive Integrated Moving Average (ARIMA). The primary focus is to elucidate historical patterns of variation and potential future trajectories. Subsequently, the optimal predictive model will be identified based on the outcome of these predictions. Ultimately, this investigation will delve into prospective shifts in per capita disposable income within Hubei Province for the forthcoming years.
By employing time series algorithmic predictions on per capita disposable income, this research can reduce the need for manual statistical analysis, aid relevant departments in formulating more reasonable economic policies, provide clearer employment planning guidance to governmental bodies, and offer support in economic decision-making, social development planning, resource allocation optimization, investment decisions, and data analysis research. In conclusion, forecasting per capita disposable income holds significant importance for the government, society, individuals, and the market, as it can promote economic and social stability and development [1-3].
2. Literature Review
By consulting the data published by the National Bureau of Statistics, we can gain a clear understanding of the historical changes and current status of per capita disposable income for residents in Hubei Province:
(1) Over the past decade, the per capita disposable income of residents in Hubei Province has shown steady growth. However, it has also been impacted by certain unexpected events, such as the
2020 floods.
(2) The per capita disposable income in Hubei Province is lower than the national average, indicating that the province still possesses considerable potential and space for economic development.
Given the significance of the per capita disposable income indicator in economic life, numerous scholars have undertaken research on predicting this indicator. Dang Xinxin utilized grey forecasting combined with a semi-parametric model to predict the disposable income of urban residents in Henan Province [4]. Zhang Wenyang et al. addressed issues of randomness and low forecasting accuracy in single predictions and proposed four special parameter combination models based on the least square criterion of errors, along with the GIOWA operator, to perform combined forecasting for per capita disposable income of urban residents in Anhui Province [5]. Lei Zhi utilized semi-parametric regression theory to establish a semi-parametric regression forecasting model for the relationship between urban GDP, population, and disposable income in Changsha City [6]. Wang Caixia used an ARIMA-Prophet combination model to separately predict the per capita disposable income of urban and rural residents in Haikou City [7].
3. Experimental Design and Methodology
This article aims to use historical per capita disposable income data from Hubei Province to perform model predictions and explore the patterns of change and future trends.
3.1 Data Source
The data for this study is obtained from the official website of the National Bureau of Statistics, ensuring its authority. Within the website, regional data was selected, followed by choosing annual data for provinces. Hubei Province was selected, and under the economic indicators, the data for per capita disposable income for all residents was chosen. The selected time interval spans nearly two
decades, providing a sample of data from Hubei Province over the past 20 years. The data was organized after downloading from the official website. Due to the lack of specific per capita disposable income data for the years 2003 and 2004, the data range was set from 2005 to 2022. The data table is presented as Table 1.
Table 1: Per Capita Disposable Income for All Residents in Hubei Province from 2005 to 2022 [8].
|
|
|
|
|
|
|
|
|
|
|
|
|
|
|
|
|
|
|
|
|
|
|
|
|
|
|
|
|
|
|
|
|
|
|
|
|
|
According to data from the National Bureau of Statistics, Hubei residents' per capita disposable income in 2022 showed steady growth, increasing by 6.8% compared to the previous year. Over the past decade, from 2013 to 2022, the per capita disposable income of Hubei residents rose from 16,472 CNY to 32,914 CNY, achieving a cumulative increase of 16,442 CNY and a nominal growth rate close to 99.8%, nearly doubling its value.
3.2 Related Theories
3.2.1 Model Algorithms
a) Holt Winter:
The concept of Exponential Smoothing (Holt-Winter) was introduced by Robert G. Brown, who posited that time series patterns showcase consistent patterns and regularity, thereby permitting the reasonable extension of trends within a time series. This methodology prognosticates future trends by computing exponential smoothing factors coupled with a specific time series forecasting model. The underlying principle revolves around the notion that the exponential smoothing factor at any given period is aweighted average of the present observed value and the prior exponential smoothing factor. This approach leverages a relatively modest dataset and yields requisite predictive outcomes. Nonetheless, it ascribes relatively diminished importance to forthcoming periods in contrast to more recent periods, rendering it suitable primarily for short-term prognostications.
The basic formula for exponential smoothing is:
st = ayt + (1 − a)st−1 ,
where:
st - Smoothing value at time t, yt - Actual value at time t,
st−1 - Actual value at time t -1,
a - Smoothing constant, with a range of [0, 1].
Exponential smoothing is suitable for univariate time series with trends and seasonal components. The forecast for the next time step is a linear function with exponential weighting of the previous observations, taking into account both trends and seasonality.
b) ARMA:
Autoregressive Moving Average (ARMA) constitutes a significant approach within time series analysis, renowned for its extensive utility and minimal predictive discrepancies. It stands as the prevalent choice for modeling stationary series. The ARMA framework finds its relevance chiefly in contexts necessitating concise predictive windows. However, it's imperative that the dataset adheres to the prerequisite of being a stationary sequence.
The ARMA model is composed of the combination of an autoregressive model (AR(p)) and a moving average model (MA(q)), hence the ARMA(p,q) model is also referred to as a mixed model. The algebraic expression for the model is:
xt = C + α1xt−1 + α2xt−2 + L + αpxt−p + ut + β1ut−1 + β2ut−2 + L + βqut−q(t = 1,2, L, T),
where p and q are the orders of the AR(p) model and MA(q) model, respectively.
The equation presented above underscores the interrelation among AR(p) and MA(q) models as specific instances within the broader ARMA(p,q) model framework. In situations where p assumes a value of 0,the ARMA(0,q) configuration simplifies into an MA(q) model. Conversely, when q equals 0, the ARMA(p,0) arrangement reduces to an AR(p) model. Notably, the stationarity of the ARMA(p,q) model hinges upon the AR(p) component. This stems from the scrutiny of the MA(q) model, which unveils the intrinsic stationarity of the stochastic process underlying the moving average.
c) ARIMA:
When differencing operations are combined with ARMA models, the non-seasonal Autoregressive Integrated Moving Average (ARIMA) model is formed. This model is applicable for modeling time
series that have been differenced to achieve stationarity. The model is simple, relying only on endogenous variables without the need for external variables. However, the ARIMA model requires the time series data to be stationary or to be made stationary through differencing. Additionally, the model essentially captures linear relationships and cannot capture non-linear relationships.
The ARIMA(p,d,q) model is represented as follows:
yt′ = μ + φ1yt′ −1 + ⋯ + φpyt′ −p + θ1 εt−1 + ⋯ + θq εt−q + εt
where y is the differenced sequence, and d represents the order of differencing.
Seasonal ARIMA models extend the ARIMA model by introducing seasonal terms to model seasonal data, as shown in Figure 1.
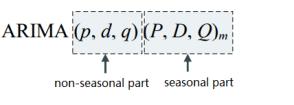
Figure 1: Components of the Seasonal ARIMA Model.
3.2.2 Evaluation Metrics
For the sake of ensuring result validity, diverse precision measures can be applied, encompassing Mean Absolute Error (MAE), Root Mean Square Error (RMSE), and Mean Absolute Percentage Error (MAPE) [9]. Each of these metrics caters to distinct evaluation facets. MAE is grounded in absolute errors and serves as a visual representation of the average gap between anticipated and actual values. RMSE excels at pinpointing significant discrepancies, scrutinizing the model's performance concerning variability. Notably, this measure heavily penalizes considerable errors by geometrically magnifying them. MAPE expresses precision in percentage terms and mitigates the sway of isolated anomalies on absolute errors. In all three metrics, diminished values correspond to enhanced model efficacy. In this research, a composite of these metrics is embraced. MAE predominantly embodies distinctions within absolute errors, RMSE is primarily deployed to identify pronounced disparities, and MAPE principally serves to juxtapose precision variances across distinct models.
The specific formulas for these metrics are as follows:
3.3 Experimental Process


RMSE, MAE, and MAPE were harnessed to appraise the projection outcomes spanning 2018-2022 (with 5 data points allocated as the test set and 13 data points from 2005 to 2017 designated as training data), as delineated in Table 2. To thwart potential data compromise, the dataset was bifurcated into a training set and a test set, with evaluation exclusively undertaken on the latter. This approach precludes the risk of overfitting that could arise if the model were trained using the complete dataset, leading to potential memorization of idiosyncrasies and augmented performance on the training sample. Thus, it is judicious to confine model training to the training set while leveraging the test set to gauge model robustness.
Table 2: Evaluation Results for Three Algorithm Models from 2013 to 2022.
|
|
|
|
|
|
|
|
|
|
|
|
|
|
|
|
Analyzing the evaluation results, ARIMA achieved the lowest MAPE, reducing it by 0.4% compared to Holt Winter and by 0.8% compared to ARMA. For RMSE and MAE evaluation metrics, ARIMA outperformed the other models. Specifically, compared to Holt Winter, ARIMA reduced RMSE by 12.6% and MAE by 6.3%, while compared to ARMA, ARIMA reduced RMSE by 27.4% and MAE by 18.5%. Based on the comprehensive evaluation results of the three metrics on the same test set, ARIMA obtained the best forecasting performance.
Finally, to visually display the forecasting results, this paper presents the forecasting effect graph shown in Figure 2.
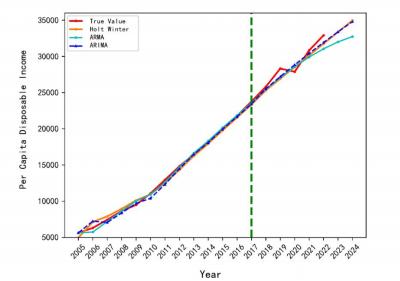
Note: Dotted lines indicate the forecasted part.
Figure 2: Forecasted Results of Per Capita Disposable Income in Hubei Province from 2005 to
2022.
From the analysis of Figure 2, it can be observed that the per capita disposable income level shows an overall upward trend, except for the year 2020. All three models had significant errors in fitting the real data from 2005 to 2008, but they performed well in fitting the data from 2008 to 2017. However, in the test set (per capita disposable income data from 2018 to 2022), the ARIMA forecast results were closer to the true values, while Holt Winter gradually deviated from the true values. Additionally, for the forecast of per capita disposable income in 2023 and 2024, from the graph, it can be seen that the ARIMA and Holt Winter forecast curves from 2013 to 2024 were closer to each other, while ARMA deviated significantly. This can also demonstrate that ARIMA has a better forecasting performance for per capita disposable income.
Therefore, using the ARIMA method with the best forecasting performance, the per capita disposable income for all residents in Hubei Province was forecasted for 2023 to be 33,389.57 CNY and for 2024 to be 34,795.39 CNY.
4. Discussion
Within this inquiry, three distinct algorithms—Holt Winter, ARMA, and ARIMA—were employed to assess the economic landscape encompassing the per capita disposable income of Hubei Province's residents. Evidently, the ARIMA algorithm demonstrated heightened predictive efficacy. Through its application, forecasts for Hubei Province's per capita disposable income were drawn for the upcoming years, 2023 and 2024. Notably, this study harbors a limitation in its data scope, constraining the integration of machine learning and deep learning models. The incorporation of supplementary variables impacting per capita disposable income—such as nationwide GDP metrics, Hubei Province- specific GDP data, and sectoral growth figures—could pave the way for deploying deep learning models like LSTM (Long Short-Term Memory) and machine learning models like XGBoost. Alternatively, a hybridized approach, amalgamating statistical techniques with machine learning paradigms, could be contemplated for advancing per capita disposable income prognostications.
From the years 2005 to 2019, per capita disposable income showed an overall upward trend. The decrease in per capita disposable income in 2020 can be attributed to major unexpected events, such as flooding disasters, which caused the income to drop, followed by a recovery and continuation of the upward trend.
5. Conclusion
This study employed statistical techniques for time series forecasting, focusing on Hubei Province as a case study. Three specific algorithms—Holt Winter, ARMA, and ARIMA—were employed to anticipate per capita disposable income patterns. Through empirical investigations, it was ascertained that the ARIMA approach exhibited superior predictive accuracy, as evidenced by its proximity to actual values. Consequently, the ARIMA technique, recognized for its exemplary forecasting prowess, was leveraged to predict Hubei Province's per capita disposable income trajectory for the years 2023 and 2024. The prognostic outcomes indicate a discernible and sustained upward trajectory in per capita disposable income throughout the aforementioned years.
The per capita disposable income forecasting model used in this study can effectively predict future income trends and provides some reference value for government decision-making. However, due to the limited samples available and the reliance on a single dimension of time series for forecasting, further efforts are needed to strengthen data collection and accumulation. Future research can build upon this work by introducing variables related to economic forecasting, obtaining more detailed data sources, and further improving the accuracy of per capita disposable income predictions.
References
[1]. Winters, P. R. (1960). Forecasting Sales by Exponentially Weighted Moving Averages. Management Science, 6(3), 324-342. DOI: 10.1287/mnsc.6.3.324.
[2]. Box, G. E. P., & Jenkins, G. M. (1970). Time series analysis: Forecasting and control. Holden-Day, San Francisco.
[3]. Box, G. E. P., Jenkins, G. M., & Reinsel, G. C. (1976). Time series analysis forecasting and control - Rev. ed. Journal of Time, 31(2), 238-242. DOI: 10.1111/j.1467-9892.2009.00643.x.
[4]. Dang, X. X. (2022). A Study on the Influencing Factors of Per Capita Disposable Income of Urban Residents Based on Semi-Parametric Model [Doctoral dissertation, Guangxi University of Science and Technology]. DOI: 10.27759/d.cnki.ggxgx.2022.000328.
[5]. Zhang, W. Y., Wang, K., & Yuan, H. J. (2022). Composite Forecast of Per Capita Disposable Income of Urban Residents in Anhui Province. Journal of Chongqing Technology and Business University (Natural Science Edition), 39(05), 93-104. DOI: 10.16055/j.issn.1672-058X.2022.0005.013.
[6]. Lei, Z. T. (2012). Analysis and Forecasting of Per Capita Disposable Income in Changsha City [Master's thesis, Central South University].
[7]. Wang, C. X. (2022). Forecasting and Influencing Factors Analysis of Per Capita Disposable Income of Urban and Rural Residents in Haikou City [Doctoral dissertation, Hainan Normal University]. DOI: 10.27719/d.cnki.ghnsf.2022.000133.
[8]. National Bureau of Statistics of China. (n.d.). China Statistics Database. Retrieved from https://data.stats.gov.cn/easyquery.htm?cn=E0103
[9]. Wei, S. Y. (2022). Prediction of China's GDP Based on Time Series Model [Doctoral dissertation, Shandong University]. DOI: 10.27272/d.cnki.gshdu.2022.003785.
Cite this article
Teng,L. (2023). Analysis and Prognostication of Residents' Per Capita Disposable Income in Hubei Province using Time Series Prediction Methods. Advances in Social Behavior Research,2,46-53.
Data availability
The datasets used and/or analyzed during the current study will be available from the authors upon reasonable request.
Disclaimer/Publisher's Note
The statements, opinions and data contained in all publications are solely those of the individual author(s) and contributor(s) and not of EWA Publishing and/or the editor(s). EWA Publishing and/or the editor(s) disclaim responsibility for any injury to people or property resulting from any ideas, methods, instructions or products referred to in the content.
About volume
Journal:Advances in Social Behavior Research
© 2024 by the author(s). Licensee EWA Publishing, Oxford, UK. This article is an open access article distributed under the terms and
conditions of the Creative Commons Attribution (CC BY) license. Authors who
publish this series agree to the following terms:
1. Authors retain copyright and grant the series right of first publication with the work simultaneously licensed under a Creative Commons
Attribution License that allows others to share the work with an acknowledgment of the work's authorship and initial publication in this
series.
2. Authors are able to enter into separate, additional contractual arrangements for the non-exclusive distribution of the series's published
version of the work (e.g., post it to an institutional repository or publish it in a book), with an acknowledgment of its initial
publication in this series.
3. Authors are permitted and encouraged to post their work online (e.g., in institutional repositories or on their website) prior to and
during the submission process, as it can lead to productive exchanges, as well as earlier and greater citation of published work (See
Open access policy for details).
References
[1]. Winters, P. R. (1960). Forecasting Sales by Exponentially Weighted Moving Averages. Management Science, 6(3), 324-342. DOI: 10.1287/mnsc.6.3.324.
[2]. Box, G. E. P., & Jenkins, G. M. (1970). Time series analysis: Forecasting and control. Holden-Day, San Francisco.
[3]. Box, G. E. P., Jenkins, G. M., & Reinsel, G. C. (1976). Time series analysis forecasting and control - Rev. ed. Journal of Time, 31(2), 238-242. DOI: 10.1111/j.1467-9892.2009.00643.x.
[4]. Dang, X. X. (2022). A Study on the Influencing Factors of Per Capita Disposable Income of Urban Residents Based on Semi-Parametric Model [Doctoral dissertation, Guangxi University of Science and Technology]. DOI: 10.27759/d.cnki.ggxgx.2022.000328.
[5]. Zhang, W. Y., Wang, K., & Yuan, H. J. (2022). Composite Forecast of Per Capita Disposable Income of Urban Residents in Anhui Province. Journal of Chongqing Technology and Business University (Natural Science Edition), 39(05), 93-104. DOI: 10.16055/j.issn.1672-058X.2022.0005.013.
[6]. Lei, Z. T. (2012). Analysis and Forecasting of Per Capita Disposable Income in Changsha City [Master's thesis, Central South University].
[7]. Wang, C. X. (2022). Forecasting and Influencing Factors Analysis of Per Capita Disposable Income of Urban and Rural Residents in Haikou City [Doctoral dissertation, Hainan Normal University]. DOI: 10.27719/d.cnki.ghnsf.2022.000133.
[8]. National Bureau of Statistics of China. (n.d.). China Statistics Database. Retrieved from https://data.stats.gov.cn/easyquery.htm?cn=E0103
[9]. Wei, S. Y. (2022). Prediction of China's GDP Based on Time Series Model [Doctoral dissertation, Shandong University]. DOI: 10.27272/d.cnki.gshdu.2022.003785.