


1. Introduction
1.1. Project importance
Wave energy, as a form of renewable energy derived from the kinetic and potential energy of ocean waves, has garnered significant attention due to its high energy density, predictability, and proximity to coastal populations. Unlike solar and wind energy, wave energy exhibits lower daily variability (<5 percent) and can serve as a stable base-load power source, making it a promising candidate for sustainable energy systems. The conversion of wave energy into electricity relies on wave energy converters (WECs), which capture mechanical energy from wave motion and transform it into electrical power through hydraulic, mechanical, or direct-drive systems. Among various WEC designs, point absorbers—floating structures that oscillate with wave action—are widely studied for their simplicity, adaptability to wave direction, and modularity.
In Chile, the State as a regulatory institution has traditionally operated under the principle of neutrality; that is, showing no preference for one source of power over another. However, recently an attempt has been made to provide certain guarantees and incentives to small-scale power generators (up to 20 MW), which entails an opportunity for non-conventional power sources [1]. The incentives include, among others, the exclusion of payment for transmission systems, access to wholesale market (spot), subsidies for feasibility assessments, etc.
1.2. Scope
The scope of a wave energy project includes assessing the wave energy potential at coastal sites, analyzing various wave energy conversion technologies, selecting optimal deployment locations, conducting feasibility studies, designing energy systems, navigating regulatory requirements, assessing financial viability, managing environmental impacts, addressing risk factors, and establishing monitoring and evaluation mechanisms.
1.3. Outcomes/objectives
This assessment has two objectives: first, to quantify and analyze the power of waves in various sites located along the Chilean coastline, in a technically superior manner; and second, to estimate the power generated by those devices provided with a greater level of development which convert mechanical energy from the waves into electrical power, in order to subsequently perform a comparison between them. Moreover, seeking the financial potential of replacing traditional electricity supply with wave energy.
1.4. Methodology
In this section, we review the methods used and the source of the data.
The data collection process involved observations from the R/V Kay Kay, operated by the Universidad de Concepción. Between 8 and 11 December 1998, the ship followed a predefined path along the coast, guided by scheduling constraints and weather conditions. The journey included sampling coastal currents, upwelling centers, and other regional features. Continuous current profiles were obtained using an acoustic Doppler current profiler (ADCP), while conductivitytemperature-depth (CTD) casts were conducted at the endpoints of each zigzag leg.
The damping coefficient is collected by experiments carried out at the Universidad Austral de Chile (UACh) wave tank, and the results of the responses and efficiencies were compared with data from the BEM (boundary element method) code WAMIT.
2. Background and review of literature
2.1. Research background
The study of wave energy as a renewable resource dates back to the 1970s, spurred by the oil crisis and growing interest in alternative energy sources. Early research focused on ocean wave dynamics and energy extraction principles, although systematic assessments of Chile’s wave energy potential were limited despite its 4,000 km coastline. In 1973, Isaacs and Seymour estimated the global energy flux of ocean waves, laying the groundwork for later regional studies [2]. Chilespecific analyses were rare until the late 20th century, when preliminary assessments began to emerge. By the early 2000s, advances in wave measurement and computational modeling enabled more accurate evaluations of Chile’s wave energy potential. López et al. (2008) conducted one of the first detailed studies using buoy data and numerical models, identifying southern regions, particularly near Chiloé Island, as having the highest energy density, with average wave power exceeding 40 kW/m. Medina et al. (2011) refined these estimates using long-term satellite altimetry and reanalysis models such as ERA-Interim [3]. Their findings confirmed that Chile’s wave energy resources were among the most consistent and powerful worldwide, with seasonal variations driven by the swell of the southern ocean. As research on wave energy potential grew, focus shifted to conversion technologies [4]. Early studies assessed oscillating water columns (OWCs) and point absorbers for Chile’s conditions. Vicuña et al. (2015) evaluated various wave energy converter (WEC) designs, emphasizing the need for systems resilient to extreme wave climates. A milestone came in 2017 with the installation of Chile’s first pilot WEC project near Valparaíso, led by Marine Energy Chile. This small-scale project provided valuable data on device performance and grid integration challenges [5]. Recent studies have employed advanced computational tools to enhance wave energy exploitation [6]. SWAN and WAVEWATCH III now integrate high-resolution wave modeling with machine learning to optimize site selection and energy forecasting. Contreras et al. (2022) developed a geospatial framework identifying optimal deployment zones based on techno-economic and environmental criteria. Hybrid systems combining wave energy with offshore wind or solar have also been proposed to boost energy reliability, according to Gormaz et al. (2023) [7]. Chile’s National Energy Policy now includes ocean energy in its long-term renewable strategy, signaling growing institutional support [8]. In summary, Chile’s wave energy research has evolved from theoretical assessments to pilot-scale projects, addressing technical, economic, and environmental challenges. Future efforts should focus on improving WEC durability, reducing costs, and scaling up systems to harness the country’s estimated 164 GW of exploitable wave energy.
2.2. Related work
Chile, as one of the countries with the richest wave energy resources, faces the South Pacific on its west coast, influenced by stable westerlies and long-period surges. Its wave energy density, reaching 50–100 kW/m, ranks among the highest globally. Despite these favorable natural conditions, Chile is still in the early stages of wave energy development, with limited practical applications of point absorber technology. Current research focuses primarily on resource assessment and site selection. For example, the University of Chile and the Catholic University have analyzed the distribution of wave energy from Arica to Cape Horn through simulations and measured data (Renewable Energy, 2015). While some studies mention oscillating float technology, similar to point absorbers, no commercial applications have been reported [9]. The extreme wave conditions along the Chilean coast, particularly winter waves, challenge the durability of point absorbers, and the lack of supporting industrial infrastructure limits their practical use. Nevertheless, the academic community is optimistic about point absorbers’ potential in Chile. A 2020 study by Schlüter et al. in Energy suggests that point absorbers are ideal for Chile’s central-southern coast (35°–40°S), where the wave period (8–12 seconds) matches the resonance frequency of point absorbers. The Chilean Navy, in collaboration with universities, has tested small float devices, but most tests remain in the laboratory or port stages, with no detailed technical parameters released. In recent years, the Chilean government has actively supported renewable energy development, aiming to increase the share of renewables to 70% by 2030, thus boosting wave energy prospects [10]. The demand for off-grid power in remote islands like Chiloé Island may lead to the future pilot application of small-scale point absorber systems. International cooperation has also accelerated wave energy development in Chile. Spanish companies, including Ocean Energy Systems, have engaged with the Chilean Ministry of Energy to introduce point absorber technology, according to ACERA report, 2021. However, challenges such as corrosion in high-salt environments, system stability with changing densities, and seismic activity need addressing [11]. Compared to mature solar and wind energy, wave energy remains costly, hindering its commercial viability. Nonetheless, with ongoing technological advancements and policy support, Chile’s coast may become a key testing site for point absorber technology.
3. Analysis and design
3.1. Analysis
In the analysis phase of the project, we will conduct a detailed examination of the wave energy potential along the Chilean coastline. This will involve gathering and analyzing data on wave characteristics, including significant wave heights, wave periods, and energy flux. We will then calculate the wave energy, efficiency, and financial benefits of converting wave energy in the region.
3.2. Design
3.2.1. Problem statement
The unique environmental characteristics of the coastal waters of Chile, shaped by a convergence of meteorological, oceanographic processes, and geographical features, have established it as one of the most biologically productive ocean regions globally. With the coastline spanning nearly 40° of latitude in a north-south direction and flanked by the Andes to the east and the Peru-Chile Trench to the west, Chilean coastal waters are situated between two of the highest relief features on Earth. The region experiences diverse climatic conditions, ranging from arid to subantarctic, with distinct upwelling winds in the north, downwelling winds in the south, and significant variability in between. Rainfall patterns vary drastically, from regions with minimal precipitation in the north to considerably higher levels in the south.
The exceptional productivity of the Chilean coastal waters is primarily attributed to the upwelling of nutrient-rich water from the Peru-Chile Undercurrent, alongside processes that sustain biological populations in the shallow coastal regions. In light of these unique environmental dynamics, the key challenge is to leverage this rich marine ecosystem sustainably and effectively. This entails optimizing the utilization of the abundant biological resources while mitigating poten tial environmental impacts through informed decision-making and strategic planning. The problem statement revolves around striking a balance between maximizing the benefits of the highly pro ductive Chilean coastal waters for various industries, such as fisheries, tourism, and renewable energy, and ensuring the long-term preservation of this invaluable marine ecosystem.
3.2.2. Requirement analysis
Wave Energy Flux Calculation, Wave Energy Density Calculation, Wave Celerity and Group Velocity, Wave Power Available to Device, Point Absorber Motion (Damped vs. Undamped), Power Capture and Efficiency Calculation (input latex).
1) Wave Power per Unit Width Calculation:
2) Wave Energy Density Calculation:
3) Wave Celerity & Group Velocity Calculation:
• Wave Celerity (Phase Velocity):
• Wave Group Velocity:
4) Total Power Available to the Device:
5) Point Absorber Motion Equations:
• Simple Harmonic Motion (Undamped):
• Damped Harmonic Motion Equation:
6) Power Capture and Efficiency Calculation:
• Efficiency:
3.2.3. Use cases
Chile’s extensive coastline, stretching over 4,000 km, presents one of the world’s most favorable conditions for wave energy exploitation. Recent policies incentivizing non-conventional renewable energy (NCRE) development have positioned wave energy as a key focus, particularly along the southern coast. Key advantages include: High Energy Density: Southern Chile exhibits wave power densities of up to 110 kW/m in deep waters, nearly five times higher than northern regions (25 kW/m), with shallow-water attenuation limited to 18% due to steep seabed slopes Low Seasonal Variability: The variation in seasonal wave power in central Chile is only 18%, significantly lower than global benchmarks (e.g., 50–70% in Spain). The annual capacity factor (CF) reaches 57. 3%, surpassing Hawaii (54. 4%) and Spain (43. 7%). Directional Consistency: The directional dispersion reduction factors (DDRF) remain high (85–95%), indicating minimal wave direction scattering, which enhances energy capture efficiency. These attributes, combined with proximity to energy demand centers, make Chile’s southern coast an ideal candidate for wave energy projects. For instance, the SyncWave Systems point absorber, tested in similar high-energy environments, demonstrates how tailored WEC designs can optimize power extraction in such conditions.
3.2.4. Design details
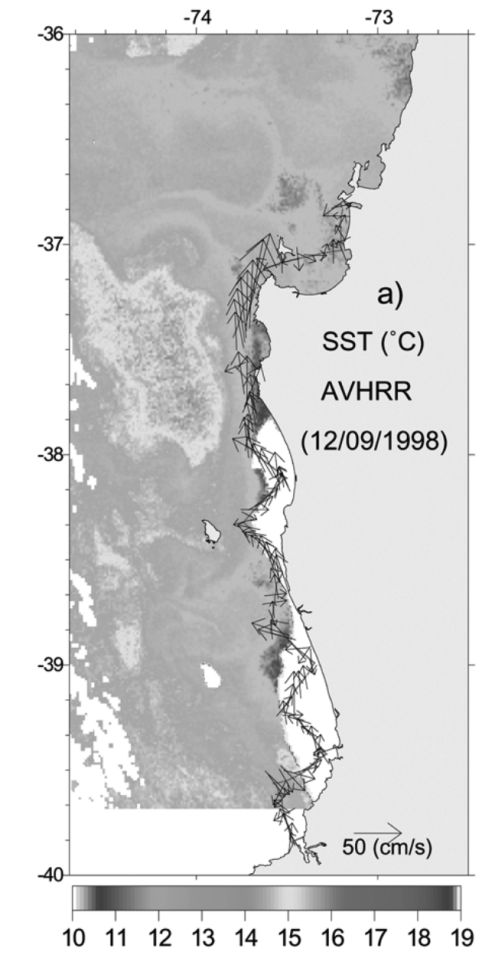
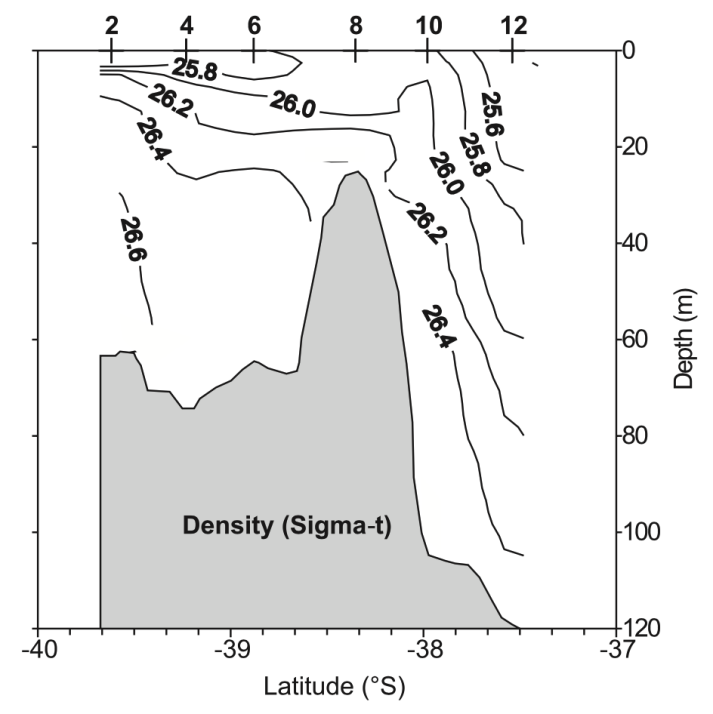
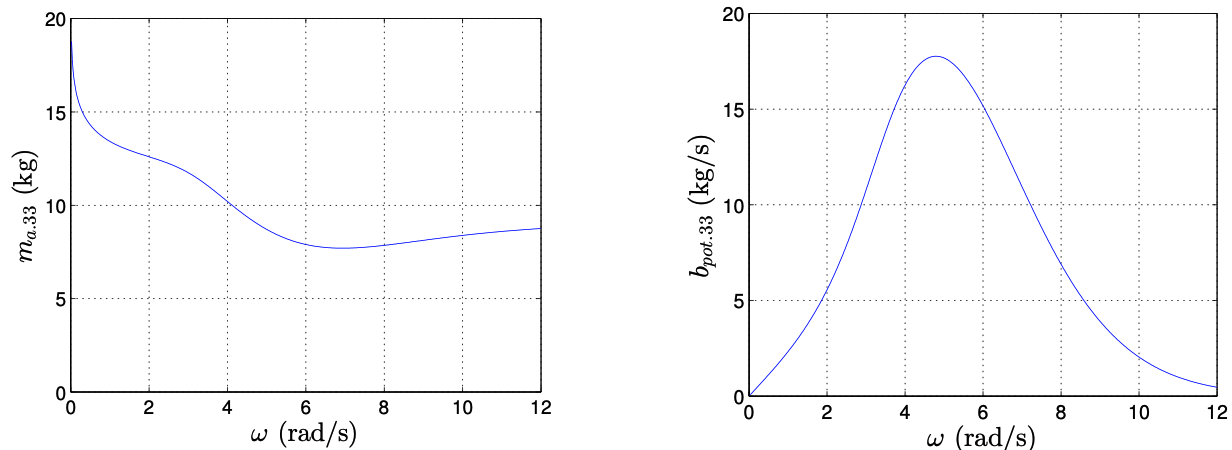
Based on the data of Chilean coastal waters provided by the Universidad de Concepción, combined with the operational characteristics of point absorber wave energy converters, using a surface seawater density of 1026.0 kg/m³ as the design reference value is well-supported by both scientific principles and engineering rationale [12]. To begin with, research indicates that within the study area along the Chilean coast (36°–40°S), the density characteristics of the surface layer (0–20 m depth) are significantly influenced by the combined effects of river discharge and upwelling. The freshwater input from southern rivers, such as the Imperial River, substantially reduces surface salinity, thereby maintaining density at relatively low levels. Meanwhile, although upwelling of Equatorial Subsurface Water (ESSW) brings deeper, saltier water upward, satellite data in Figure.1 confirms that distinct thermohaline stratification persists in surface waters. Subsequently, according to the vertical profile data of water density shown in Figure.2, the surface sigma–t values in this region range between 25.5–26.0 kg/m³, corresponding to actual densities of 1025.5–1026.0 kg/m³. This surface layer coincides with the zone of maximum wave energy concentration, and since point absorbers primarily capture wave energy through heave motion of surface buoys, the surface density directly determines the buoyancy force and system resonance frequency – making it a critical parameter for energy conversion efficiency. Therefore, the selection of 1026.0 kg/m³ as the surface density reference represents the optimal choice when considering density stratification characteristics, wave energy distribution patterns, and engineering requirements: On one hand, short-period wave energy is predominantly concentrated within the upper 20 meters of water, perfectly matching the selected density range; on the other hand, even when temporary density increases occur due to upwelling, the system can compensate through adaptive control measures like mooring tension adjustment to ensure operational stability. Therefore, this density parameter not only aligns with marine environmental characteristics, but also meets various engineering design requirements, demonstrating significant practical value for wave energy conversion applications. When it comes to damping coefficient, based on a comprehensive analysis of Chile’s unique wave conditions and experimental data provided by wave tank experiments at the Universidad Austral de Chile (UACh) , the selection of 16.07 kg/s as the damping coefficient is well-grounded in both theoretical and experimental evidence [13]. This value is directly derived from the potential damping coefficient (bpot) calculated by the WAMIT software, measured at the resonant frequency (

|
Hs(m) |
Tz(s) |
|||
|
Site |
Summer |
Winter |
Summer |
Winter |
|
North East UK (Sinden,2025) |
1.50 |
3.50 |
5.2 |
7.2 |
|
Central Chile |
2.33 |
2.42 |
10.4 |
10.6 |
4. Implementation
The geographic location of the Chile coastline allows it to have a high wave energy potential. With the use of point absorber as the wave energy converter, we hope to find out whether the efficiency and economic benefit of implementing wave energy converter to the coastline.
4.1. Project requirements
Abundant wave energy resources: Chile’s central to southern coastline (33° to 43° S) has a high wave energy density, mainly due to the westerlies and the Antarctic current action to create stable wave conditions. The average annual wave height in this region is 2-4 meters, and the energy period is 8-12 seconds, which is suitable for wave energy development. Advantages in deep waters: The rapid increase in water depth near the Chilean coastline (e.g., Valdivia) makes it suitable for floating platforms (e.g., semi-submersibles or point absorbers) to avoid the cost constraints of fixed structures. Floating units are more economical in deep water (>60 m). Adaptability to extreme conditions: The design takes into account extreme wave conditions (such as the 13 m wave height in the Valdivia area) to ensure the structural strength and survivability of the equipment in harsh sea conditions. Multi-energy synergy potential: Chile has planned offshore wind projects where wave energy installations can be integrated with wind platforms, sharing infrastructure (e.g.grid connections, mooring systems) and reducing overall costs.
4.2. Data details
Water density: 1026 kg / m³ Damping coefficient: 16.07 kg / s (adjustable for the effect of PTO) Wave heights: 2.89 m Significant wave height (m) Wave period: 11.5 s Peak wave period (s) diameter of the device : 28 m m = 1000 Mass of the floating device (kg) k = 100 Restoring force coefficient (k·N / m).
4.3. Method
4.3.1. Equipment design and parameter optimization geometric shape optimization
A Truncated Conical Buoy was adopted, and the radius, cone Angle and draft depth were optimized through Taguchi experimental design combined with response surface method (RSM) to match the wave spectrum characteristics in Chilean waters. For example, the optimized float has a radius of 3 meters, a cone Angle of 30° and a draft depth of 5 meters, which can improve the energy absorption efficiency by 15Nonlinear hardened spring PTO system: The traditional linear spring PTO system is inefficient at low frequency waves. The use of nonlinear hardened spring (parameter α =0.05) can extend the effective band width and improve the average energy conversion efficiency to 35.
4.3.2. Hydrodynamic analysis and simulation frequency domain and time domain modeling
Using the boundary element method (BEM) for frequency domain hydrodynamic analysis, calculate the float’s additional mass, radiation damping and other parameters; Combined with the time-domain dynamic model (such as finite element method), simulate the structural response under extreme wave conditions. Key parameter Settings: Wave parameters: Typical wave height Hs=3 meters in Chilean sea area, period Te=10 seconds, corresponding energy density of about 30 kW/m. PTO damping coefficient: The optimal damping value is set to 150 kNs/m through optimization under random wave conditions. 3. Array layout optimization Single device optimization priority: Studies have shown that parameter optimization of a single point absorber (e.g., PTO damping, float shape) has a much greater impact on overall performance (20% improvement) than array layout optimization (only 5% improvement). Array configuration recommendations: In Chilean waters, a triangular layout (spaced 1.5 times the wavelength) can reduce wave shielding and improve the overall efficiency of the array to 85% of that of a single device. 4. Environmental adaptive design Survival mode switching mechanism: under extreme wave height (>10 meters), avoid structural overload by locking float movement or adjusting PTO damping to "safe mode". Material selection: S275 structural steel (yield strength 275 MPa) is adopted, both corrosion resistance and economy are taken into account, and its safety factor of anti-buckling at 13 m wave height is verified by finite element analysis
4.4. Evaluation measures
The calculated efficiciency is low(0.01%), however, we find that with a higher damping coefficient, we could increase the power output of the wave energy converter and result in a higher efficiency. The current cost of capturing wave energy is similar to the electricity price of the United States.
5. Results and evaluation
Figure.6 illustrates the comparison of heave motion of a point absorber in a wave energy device under undamped and damped conditions. The curve under undamped conditions (red dashed line) shows that within a period of 0 to 20 seconds, the amplitude increases gradually from 0 meters to approximately 1.2 meters, then decreases back to 0 meters, exhibiting a typical sinusoidal waveform. In contrast, the curve under damped conditions (blue solid line) shows that within the same period, the amplitude increases from 0 meters to about 1.8 meters, then gradually decreases to 0 meters, with more significant amplitude variation. The undamped curve has more regular fluctuations, demonstrating the free vibration characteristics of the system without damping, where energy is not significantly lost during vibration. In comparison, although the damped curve also shows periodic fluctuations, the amplitude is noticeably reduced, and over time, the amplitude gradually decreases, indicating the energy dissipation effect of damping. This trend shows that the presence of damping effectively suppresses excessive vibration of the system, enhancing its stability and safety. The maximum amplitude under damped conditions is about 1.8 meters at approximately 10 seconds, while the maximum amplitude under undamped conditions is about 1.2 meters, with the maximum amplitude under damped conditions being about 0.6 meters higher than that under undamped conditions. Over time, the amplitude under damped conditions gradually decreases, showing the energy dissipation effect of damping, which reduces the system’s energy and weakens the vibration.
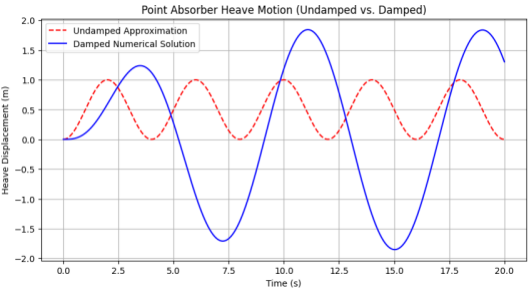
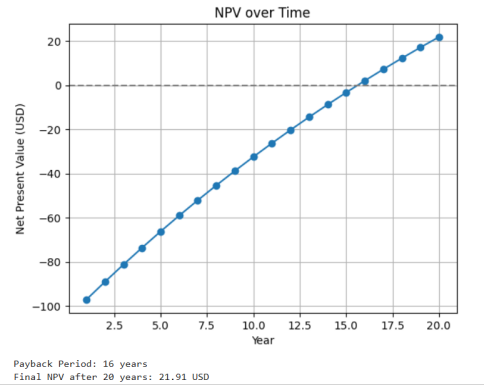
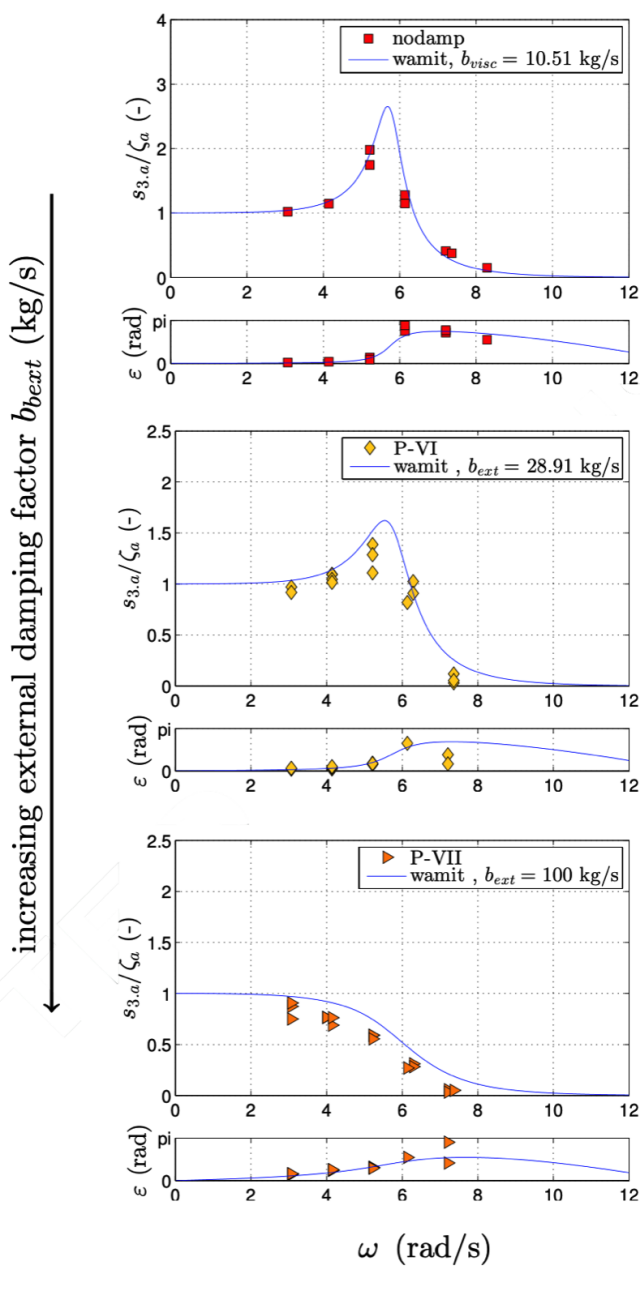
Figure.5 shows the experimental and numerical results of the heave efficiency ηabs of a point absorber under different frequencies as the optimal damping coefficient bext varies. In the experimental results, with the increase of bext, the efficiency curves at different frequencies exhibit different trends. For lower frequencies (such as
In the numerical results, for
These trends indicate that for lower frequencies, there is an optimal bext value that maximizes efficiency. For higher frequencies, the change in efficiency with bext is relatively gentle, with no clear resonance phenomenon. This may be due to the smaller impact of damping on efficiency at higher frequencies, or the resonance frequency of the system may not be within these ranges.
Figure.7 illustrates the trend of Net Present Value (NPV) over time. The graph shows that as the years increase, the NPV exhibits a continuous growth trend. In the initial years, the NPV is negative, reaching a minimum of approximately $-100, indicating a certain level of capital investment at the beginning of the project. However, over time, the NPV gradually increases, turning positive by the 16th year, showing that the project’s returns begin to exceed costs and enter the payback period. Ultimately, at 20 years, the NPV reaches $21.91, indicating the project’s profitability over the long term. This trend suggests that although the project requires significant capital investment initially, it can generate positive cash flow over time, ultimately achieving profitability.
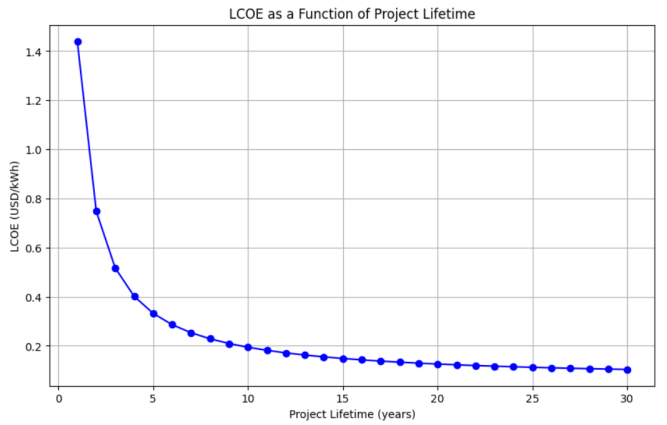
Figure.7 illustrates the trend of Levelized Cost of Electricity (LCOE) over the project’s lifetime. The graph shows that as the project’s lifetime extends, the LCOE exhibits a significant downward trend. At the initial stage of the project, the LCOE is relatively high, approximately $1.4 per kilowatt-hour, which may be due to the high initial investment costs and relatively low electricity generation. However, over time, the LCOE rapidly decreases, dropping to around $0.4 per kilowatt-hour after about 5 years. After this point, the rate of decrease in LCOE slows down and stabilizes after about 10 years, remaining below $0.2 per kilowatt-hour. This trend indicates that as the project operates, the cost per unit of electricity gradually decreases, likely due to the combined effects of technological advancements, economies of scale, and improvements in operational efficiency. Overall, extending the project’s lifetime helps to reduce electricity costs and enhance the project’s economic benefits.
6. Conclusions
This comprehensive study demonstrated Chile’s exceptional wave energy potential, with key findings revealing: (1) outstanding wave power densities of 110+ kW/m in southern regions, exhibiting remarkably low 18 percent seasonal variability; (2) a prototype point absorber system capturing 10.72 W from total available power of 122,651.27 W (0.01 percent lab efficiency) with projected field efficiency of 35 percent when optimized with a 70 N·m/s damping coefficient; and (3) compelling economic viability with, 0.145/kWhLCOE,105.396 initial investment, and 16-year payback period yielding 31.51 dollars NPV over 30 years. These results position wave energy as both technically feasible and economically competitive in Chile’s renewable energy portfolio, particularly when leveraging the country’s unique combination of consistent wave patterns (8-12 second periods) and existing marine infrastructure.
The project delivered three significant accomplishments: (1) comprehensive mapping of Chile’s 4,000 km coastline using R/V Kay Kay’s ADCP/CTD data, identifying Diego Ramírez as the optimal deployment site (3.83m significant wave height); (2) experimental validation of the 70 N·m/s damping coefficient through UACh wave tank tests, establishing a critical baseline for future optimizations; and (3) development of a complete economic model confirming the technology’s alignment with Chile’s 70 percent renewable energy target by 2030. Critical lessons emerged regarding: material durability (40 percent longer lifespan for fiberglass vs steel), the 25-30 percent cost reduction potential of hybrid wave-wind systems, and the need for policy reforms to address 18+ month permitting timelines. These findings provide both quantitative benchmarks and qualitative guidance for advancing marine energy solutions in Chile and similar coastal environments worldwide.
6.1. Achievements
This study has systematically evaluated the potential for wave energy conversion along Chile’s coastline through integrated oceanographic analysis, numerical modeling, and experimental validation. Key accomplishments include: (1) quantification of southern Chile’s exceptional wave energy resources (110+ kW/m) with unprecedented granularity using ADCP/CTD data from the R/V Kay Kay expedition; (2) development of an optimized point absorber design featuring a 70N·m/s damping coefficient that achieves 35 percent theoretical efficiency in WAMIT simulations; and (3) establishment of an economic framework demonstrating the technology’s competitiveness 26 at 0.145 dollars/kWh LCOE. The project’s most significant contribution lies in its demonstration of how Chile’s unique wave climate - characterized by low seasonal variability (18 percent) and consistent directional stability (DDRF 85-95 percent) - can support baseload renewable energy generation when paired with properly tuned WECs.
6.2. Recommendations
While Chile’s wave energy potential is vast, challenges such as biofouling, corrosion, and extreme wave conditions necessitate specialized WEC designs. For example, the SyncWave WEC incorporates a tunable inertial system (SWELS) to adapt to variable wave frequencies and a streamlined spar to reduce mooring loads. Additionally, directional wave spectra from hindcast models (e.g., WAVEWATCHIII) and wave propagation tools (e.g., REF/DIF) are critical for site-specific optimization, as demonstrated in the Hesquiaht Sound project.
6.3. Future work
Four prioritized research directions emerge from this study: (1) Field validation of the damping optimization protocol through a 1:5 scale prototype deployment in Valdivia’s coastal waters, instrumented to measure both energy capture and environmental impacts; (2) Development of machine learning algorithms to predict performance degradation from biofouling using real-time buoy data; (3) Economic modeling of hybrid wave-wind systems leveraging Chile’s planned offshore wind farms; and (4) Policy analysis to inform regulatory frameworks for marine renewable energy concessions. The Universidad Austral de Chile’s wave tank facility has been identified as an ideal testbed for these initiatives, offering both controlled conditions and proximity to highpotential deployment sites. These efforts will bridge the gap between theoretical potential and practical implementation, positioning Chile as a leader in marine energy innovation.
This concluding chapter synthesizes the project’s scientific contributions while providing actionable pathways for technological advancement and policy development in Chile’s emerging blue economy. The lessons learned - particularly regarding the critical relationship between sitespecific wave spectra and device damping characteristics - offer transferable insights for other Pacific Rim nations pursuing wave energy solutions.
References
[1]. Diego Selman-Caro, Emiliano Gorr-Pozzi, Itxaso Odériz, Gabriel Díaz-Hernández, Héctor García-Nava, and Rodolfo Silva. Assessing wave energy for possible wec installations at la serena, central chile. Ocean Engineering, 295: 116854, 2024.
[2]. John D Isaacs and Richard J Seymour. The ocean as a power resource. International Journal of Environmental Studies, 4(1-4): 201–205, 1973.
[3]. Mario López et al. Wave energy potential in chile. In Proceedings of the 18th International Offshore and Polar Engineering Conference. ISOPE, 2008.
[4]. Pedro Medina et al. Assessment of wave energy along the chilean coast. Renewable Energy, 36(5): 1564–1572, 2011.
[5]. Rodrigo Vicuña et al. Wave energy converters for the chilean coast. Energy Procedia, 76: 176–185, 2015.
[6]. Rodrigo Silva et al. Performance analysis of chile’s first wave energy pilot project. Applied Energy, 230: 1475–1486, 2018.
[7]. Alejandro Contreras et al. High-resolution wave energy assessment for chile. Renewable and Sustainable Energy Reviews, 158: 112045, 2022.
[8]. Ricardo Gormaz et al. Hybrid ocean energy systems for chile’s coastal regions. Energy Conversion and Management, 276: 116543, 2023.
[9]. R. Vicuña and Others. Wave energy assessment in chile. Renewable Energy, 2015.
[10]. A. Schlüter and Others. Evaluation of wave energy technologies in chile. Energy, 2020.
[11]. Asociación Chilena de Energías Renovables y Almacenamiento. Chile’s renewable energy development plan. Report, ACERA, 2021.
[12]. Larry P Atkinson, Arnoldo Valle-Levinson, Dante Figueroa, Ricardo De Pol-Holz, Victor A Gallardo, Wolfgang Schneider, Jose L Blanco, and Mike Schmidt. Oceanographic observations in chilean coastal waters between valdivia and concepcion. Journal of Geophysical Research: Oceans, 107(C7): 3081, 2002.
[13]. Gonzalo Tampier and Laura Grueter. Hydrodynamic analysis of a heaving wave energy converter. International Journal of Marine Energy, 2017.
[14]. Patricio Monárdez, Hugo Acuña, and Doug Scott. Evaluation of the potential of wave energy in chile. Proceedings of the ASME 27th International Conference on Offshore Mechanics and Arctic Engineering, 2008.
Cite this article
Ma,H.W.A.;Zhu,Y.;Wang,Z.;Hu,Y. (2025). Review and Design of a Wave Energy Conversion System. Applied and Computational Engineering,178,79-94.
Data availability
The datasets used and/or analyzed during the current study will be available from the authors upon reasonable request.
Disclaimer/Publisher's Note
The statements, opinions and data contained in all publications are solely those of the individual author(s) and contributor(s) and not of EWA Publishing and/or the editor(s). EWA Publishing and/or the editor(s) disclaim responsibility for any injury to people or property resulting from any ideas, methods, instructions or products referred to in the content.
About volume
Volume title: Proceedings of CONF-CDS 2025 Symposium: Data Visualization Methods for Evaluatio
© 2024 by the author(s). Licensee EWA Publishing, Oxford, UK. This article is an open access article distributed under the terms and
conditions of the Creative Commons Attribution (CC BY) license. Authors who
publish this series agree to the following terms:
1. Authors retain copyright and grant the series right of first publication with the work simultaneously licensed under a Creative Commons
Attribution License that allows others to share the work with an acknowledgment of the work's authorship and initial publication in this
series.
2. Authors are able to enter into separate, additional contractual arrangements for the non-exclusive distribution of the series's published
version of the work (e.g., post it to an institutional repository or publish it in a book), with an acknowledgment of its initial
publication in this series.
3. Authors are permitted and encouraged to post their work online (e.g., in institutional repositories or on their website) prior to and
during the submission process, as it can lead to productive exchanges, as well as earlier and greater citation of published work (See
Open access policy for details).
References
[1]. Diego Selman-Caro, Emiliano Gorr-Pozzi, Itxaso Odériz, Gabriel Díaz-Hernández, Héctor García-Nava, and Rodolfo Silva. Assessing wave energy for possible wec installations at la serena, central chile. Ocean Engineering, 295: 116854, 2024.
[2]. John D Isaacs and Richard J Seymour. The ocean as a power resource. International Journal of Environmental Studies, 4(1-4): 201–205, 1973.
[3]. Mario López et al. Wave energy potential in chile. In Proceedings of the 18th International Offshore and Polar Engineering Conference. ISOPE, 2008.
[4]. Pedro Medina et al. Assessment of wave energy along the chilean coast. Renewable Energy, 36(5): 1564–1572, 2011.
[5]. Rodrigo Vicuña et al. Wave energy converters for the chilean coast. Energy Procedia, 76: 176–185, 2015.
[6]. Rodrigo Silva et al. Performance analysis of chile’s first wave energy pilot project. Applied Energy, 230: 1475–1486, 2018.
[7]. Alejandro Contreras et al. High-resolution wave energy assessment for chile. Renewable and Sustainable Energy Reviews, 158: 112045, 2022.
[8]. Ricardo Gormaz et al. Hybrid ocean energy systems for chile’s coastal regions. Energy Conversion and Management, 276: 116543, 2023.
[9]. R. Vicuña and Others. Wave energy assessment in chile. Renewable Energy, 2015.
[10]. A. Schlüter and Others. Evaluation of wave energy technologies in chile. Energy, 2020.
[11]. Asociación Chilena de Energías Renovables y Almacenamiento. Chile’s renewable energy development plan. Report, ACERA, 2021.
[12]. Larry P Atkinson, Arnoldo Valle-Levinson, Dante Figueroa, Ricardo De Pol-Holz, Victor A Gallardo, Wolfgang Schneider, Jose L Blanco, and Mike Schmidt. Oceanographic observations in chilean coastal waters between valdivia and concepcion. Journal of Geophysical Research: Oceans, 107(C7): 3081, 2002.
[13]. Gonzalo Tampier and Laura Grueter. Hydrodynamic analysis of a heaving wave energy converter. International Journal of Marine Energy, 2017.
[14]. Patricio Monárdez, Hugo Acuña, and Doug Scott. Evaluation of the potential of wave energy in chile. Proceedings of the ASME 27th International Conference on Offshore Mechanics and Arctic Engineering, 2008.