


1. Introduction
The rapid development of motorization has increased the number of casualties in serious traffic accidents. Of concern is the fact that fatigued driving has increasingly become a major source of traffic accidents. Within the European Union, fatigue is identified as a contributing factor in 20% of commercial transportation accidents. The aim of this paper is to optimize the traditional vehicle-machine interface by investigating the relevant factors in human-computer interaction to serve as a reminder and mitigation of driver fatigue.
Over the years, many efforts have been made by many researchers on how to detect fatigue in automobile drivers and the methods to detect it. Detection methods for fatigue driving can be categorized into subjective and objective methods. Subjective detection methods require drivers to determine their fatigue level by checking the driving log sheet and their own physiological responses, which are affected by individual differences in drivers and therefore have poor accuracy and real-time performance. Objective detection methods can be divided into three types: detection methods based on drivers’ physiological parameters, detection methods based on drivers’ facial features, and detection methods based on vehicle driving parameters, which need to extract the characteristic parameters related to special equipment driving, and then evaluate the special equipment driving, which is more objective and reliable than the subjective detection methods [1]. A study developed a novel EEG-based spatial–temporal convolutional neural net-work (ESTCNN) to detect driver fatigue based on the spatiotemporal structure of multichannel electroencephalogram (EEG) signals. First, core blocks are introduced to extract the time dependence of EEG signals. Then, spatial features are fused and classification is achieved by employing dense layers. This study conducts a fatigue driving experiment to collect EEG signals from eight subjects in alert and fatigue states, and we compare the effectiveness of ESTCNN with eight competing methods, and the results show that the classification accuracy of ESTCNN is 97.37%, which is superior to the other comparative methods [2]. A study analyzed a driver monitoring system and identified two types of users: drivers and operators. A threat detection method covering identified threats was proposed, and an operator-computer interaction interface reference model was presented showing how the driver monitoring process is organized and what information can be processed automatically and what information related to the driver’s behavior has to be processed manually. The experimental results of the study indicated that when the driver monitoring system detects a threat in the compartment and notifies the driver, the number of threats significantly decreased [3]. Many global automotive corporations, including Toyota, Volkswagen, and Nissan, are presently engaged in research focused on driver attention systems. Toyota introduced a safety detection system that includes features such as other vehicle recognition, lane departure detection, and pedestrian recognition. Nissan, meanwhile, has integrated a driver attention warning system in its Maxima model, which monitors the driver’s steering wheel patterns to warn of abnormal deviations and prompt the driver to apply the brakes. The system establishes the driver’s default behavior and identifies deviations through continuous statistical analysis of steering corrections. Similarly, Volkswagen uses technologies such as lane tracking, pedal usage analysis, and monitoring of irregular steering wheel movements to assess driver fatigue [4]. Numerous external firms have developed fatigue detection solutions centered around a driver’s physiological attributes. For instance, Smart Eye AB has created a product named AntiSleep, which is tailored for instant identification of driver fatigue [4]. Most of the traditional in-vehicle interfaces only involve navigation, radio and other functions, and the direction of the improvement of the in-vehicle interface interaction in recent years is to add more entertainment functions and assisted driving functions, and at present there is only a simple icon reminder for driver fatigue, which is not an obvious reminder to drivers, and it is not very effective in changing the fatigue state of the drivers.
This article utilizes relevant human-computer interaction (HCI) principles to design corresponding UI interfaces for the two driving fatigue mechanisms, to achieve the effect of reminding and slowing down the driver’s fatigue.In the latter part will adopt two research methods, carrying out quantitative research and data modelling through a variation of the ANOVA experimental method, while the A/B test will conduct comparative experiments on the specific performance of the interaction interface.
2. Main body
2.1. Mechanism of Drowsy Driving
2.1.1. Definition of Drowsy Driving. In order to better study the impact of human-computer interaction interfaces on fatigued driving, it is necessary to analyze the mechanism of drowsy driving.Drowsy driving is typically defined as driving while being drowsy, sleepy, asleep, or fatigued [5]. It constitutes a significant threat to road safety and is a major cause of accidents and fatalities on roadways. However, because of instances of unreported cases, the actual number of occurrences is undoubtedly higher, with believable approximations reaching as many as 328,000 accidents and 6,400 fatalities each year [6]. Therefore, drowsy driving should be regarded as a research aspect that needs to be considered during the driving process.
2.1.2. Causes of Drowsy Driving. The root cause of drowsy driving is fatigue, which can result from inadequate sleep and continuous hours of driving. In fact, driving while drowsy is analogous to driving under the influence of alcohol, which imposes severe impairment on driving ability. This research will mainly discuss two factors that are hypothesized to contribute to driver fatigue, extended duration of driving and monotony of the driving environment.
Extended Duration of Driving: Continuous driving for prolonged periods can lead to both physical and cognitive fatigue. This is particularly pertinent in long-distance driving scenarios, where drivers may not have sufficient opportunities for rest [7]. This lack of rest can increase the risk of fatigue and drowsy driving. Therefore, understanding the impact of driving duration on fatigue can inform guidelines on safe driving durations and the necessity of rest periods.
Monotony of the Driving Environment: The driving environment, particularly its monotony, can also induce fatigue in drivers. For instance, maintaining a relatively constant speed and direction on a highway for a lengthy duration can lead to decreased driver alertness. Research into this factor could guide the design of more stimulating driving environments or development of alertness-enhancing tools for such scenarios.
2.1.3. Parameters Related to Drowsy Driving. Through the aforementioned causes of driver fatigue, identifying a precise research criterion to quantitatively analyze the impacts of drowsy driving is essential.
According to a related research on Effects of Fatigue Driving, there are several key measurements of drivers’ physical characteristics associated with drowsy driving include systolic blood pressure (SBP), heart rate (HR), eyesight, dynamic visual acuity (DVA), time for dark adaption (TDA), reaction time to sound (RTS), reaction time to light (RTL), deviation of depth perception (DDP), and time deviation of speed anticipation (TDSA) [8]. These parameters can be noticeably affected under the influence of fatigue, providing valuable insights into the transformation of a driver’s physical characteristics over time during drowsy driving.
2.1.4. Relationship between drowsy driving and human-machine Interaction Interface factors. To bridge the relationship between drowsy driving and human-machine Interaction Interface factors, citing and analyzing previous data could be essential. The experiment which contains nine related parameters to drowsy driving would be discussed in the research. In the experiment, researchers created five different driving conditions: normal, tired, drowsy, both drowsy and tired, and drunk for the study on effects of drowsy driving and drunk driving. For the limitation of the focus, the material and data of alcohol will not be mentioned and discussed.
For the aim to mimic fatigue, the detailed experiment procedures are shown in Table 1, while each parameter result of ANOVA (Analysis of Variance) analysis is revealed in Table 2 [8].
Table 1. Experimental procedures on fatigue driving [8].
Visit 1 | Visit 2 | |
Target situation | NOR and TIRD | DROD and DRTID |
Time | 2:00 p.m. | 2:00 a.m. |
Step 1 | Questionnaire survey and Practice driving | Questionnaire survey and Practice driving |
Step 2 | Drivers’ physical characteristic test for NOR situation | Drivers’ physical characteristic test for DROD situation |
Step 3 | Simulator driving for 100 min | Simulator driving for 100 min |
Step 4 | Drivers’ physical characteristic test for TIRD situation | Drivers’ physical characteristic test for DRTID situation |
Table 2. Results of ANOVA [8].
ANOVA | Significance of contrast between 2 situations | |||||
Parameters | F | P | TIRD vs. NOR | DROD vs. NOR | DRTID vs. NOR | DRTID vs.DROD |
SBP | 17.011** | .000 | 0.111 | 0.364 | 0.001** | 0.001** |
HR | 26.415** | .000 | 0.000** | 0.000** | 0.000** | 0.000** |
Eyesight | 4.516* | .010 | 0.754 | 0.056 | 0.174 | 0.083 |
DVA | 0.140 | .967 | - | - | - | - |
TDA | 2.097 | .087 | - | - | - | - |
RTS | 5.442** | .002 | 0.462 | 0.841 | 0.001** | 0.001** |
RTL | 7.519** | .000 | 0.489 | 0.066 | 0.002** | 0.003** |
DDP | 6.098** | .001 | 0.274 | 0.095 | 0.082 | 0.645 |
TDSA | 4.858** | .008 | 0.599 | 0.792 | 0.216 | 0.316 |
*P<.05.**P<.01. | ||||||
Base on the data analysis from Table1 and Table2, the basic situation of nine parameter can be concluded as Table 3 that is made in the research.Only 6 beneficial parameters can be using on the direction of drowsy driving.
Table 3. Basic summary [8].
Parameter | Summary |
SBP | Significantly decreased in DRTID situation |
HR | Significantly decreased in TIRD, DROD andDRTID situations, with DRTID being the lowest |
DVA | No significant difference among all situations |
TDA | No significant difference among all situations |
RTS | Significantly increased in DRTID situation |
RTL | Significantly increased in DRTID situation |
The design of human-machine interfaces plays a crucial role in supporting drivers in their control of vehicles, especially when they are in a fatigue-driving situation.To reveal the usability of human-machine interaction, four design factors are explored in the research,which are simplicity, color imaging, feedback clarity, and voice recognition.
Simplicity of the interface is likely correlated with dynamic visual acuity (DVA), meaning the clearer and more straightforward an interface is, the easier it is for drowsy drivers to interpret. Simplicity may also negatively correlate with reaction times (RTS and RTL) as complex interfaces might escalate reaction times.
Vibrant and contrasting colors can assist the driver in faster information processing, particularly when their eyesight or DVA is declining due to fatigue.
Unambiguous, clear feedback should have a positive correlation with all measured parameters. Regardless of the driver’s state, any feedback that could help them better understand their state .
Voice recognition systems may correlate positively with SBP and HR as they could reduce the workload of the driver under high-stress or fatigue states. It may also negatively correlate with eyesight and DVA, meaning that drivers may be more reliant on voice functions when their vision is not optimal.
With analysis with some random data, the linear regression model can be drawn as the following equals.
Each situation of parameters:
simplicity = simplicity of interface
color imaging = use of color and imaging
feedback clarity = clarity of feedback to driver
voice recognition = use of voice recognition systems
DVA = dynamic visual acuity
RTS = reaction time when stimulated
RTL = reaction time when tired
SBP = systolic blood pressure
HR = heart rate
a1, a2, a3,a4, a5, a6, a7, a8, a9, a10, a11,a12, a13, a14 = model parameters
b1 , b2, b3, b4 = model parameters
a1, a2, a3,a4, a5, a6, a7, a8, a9, a10, a11,a12, a13, a14>=0
b1 , b2, b3, b4>=0
Equals:
simplicity = a1 * DVA - a2 * RTS - a3 * RTL + b1
color imaging = a4 * DVA + a5 * SBP + a6 * HR + b2
feedback clarity = a7 * SBP + a8 * HR + a9 * DVA + a10 * RTS + a11 * RTL + b3
voice recognition = a12 * SBP + a13 * HR - a14 * DVA + b4
Figure 1 is created to summatively describe the positive and negative correlations between parameters and factors, which the positive correlation is represented by a solid line and the negative correlation is represented by a dashed line.
Figure 2 includes some 3D scatter plots that visualize the relationships between specific parameters and factors.Figure 2 is created by using python codes by Jupyter Book and input statistics comes from random arrays that contain double-precision floating-point numbers.
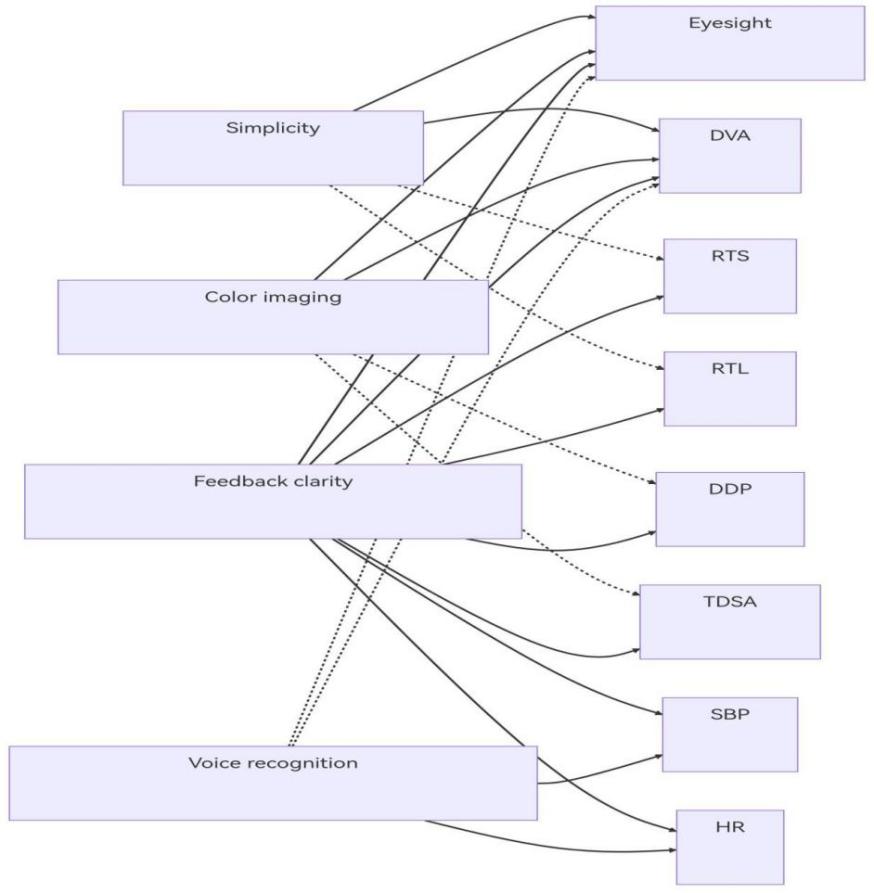
Figure 1. The relationship message of all nine parameters and four factors.
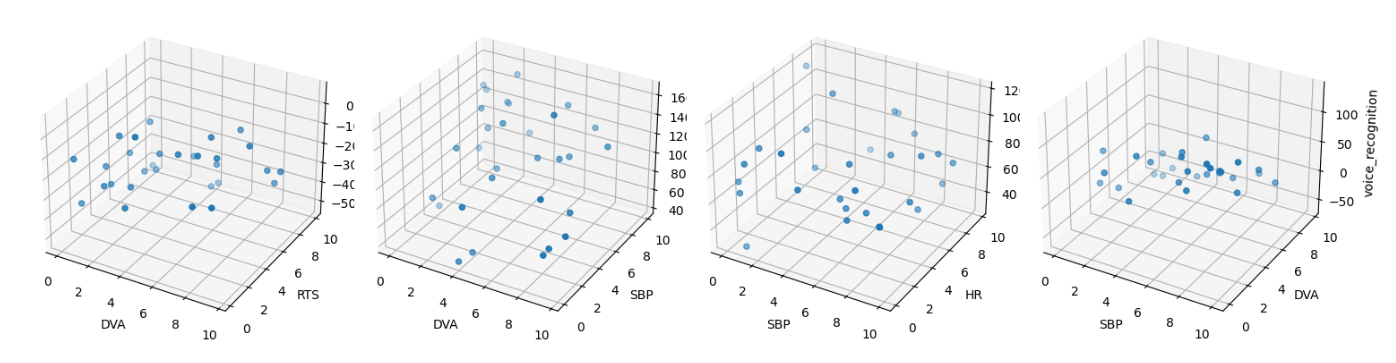
Figure 2. The relationship message of all nine parameters and four factors.
2.2. UI interface design
2.2.1. Font Size. The character height in the interface should conform to the 007 principle. The formula for the 007 principle is as follows: H≥0.007×D
Where H is the minimum acceptable character height, and D is the viewing distance, specifically the distance from the driver’s eyes to the dashboard screen or central control screen. Because D is different in different vehicle models, the minimum acceptable character height needs to be set according to different vehicle models.
2.2.2. Function Settings. To alleviate driver fatigue during driving, the UI interface provides 6 functional modules to help drivers reduce fatigue while driving, which are: trigger voice assistant chat, find nearest service area, enable driving assistance system, fatigue driving reminder, play music and radio, and set air conditioning. Figure 3 shows the 2-layer information architecture diagram of UI interface functions.
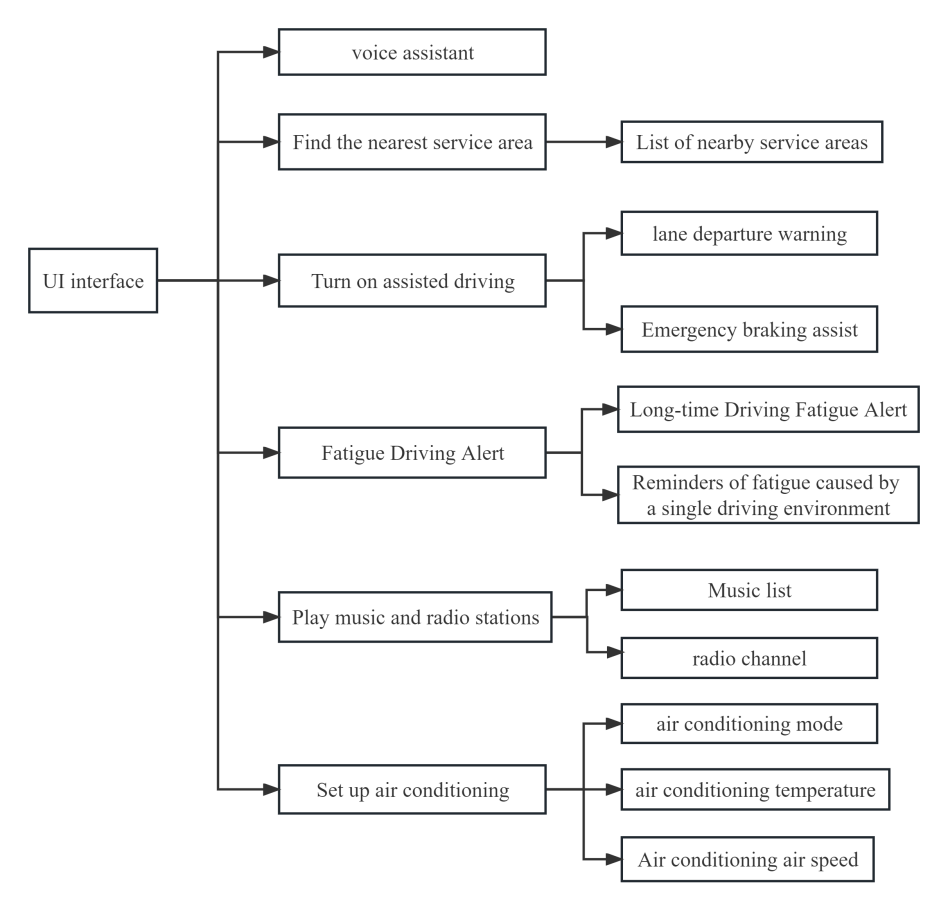
Figure 3. Information architecture diagram of UI interface functions.
2.2.3. Interface Distribution Design. The in-vehicle interface for relieving driving fatigue contains three parts: HUD, dashboard, and central display as shown in Figure 4. The design of this paper focuses on the central display, while the HUD and dashboard only involve navigation switching and warning signs display.
The central display interface contains 5 functional modules and a navigation bar. Reasonably arrange the modules in the interface to ensure that drivers can easily access and use them without distraction.
Figure 5 shows the schematic diagram of central interface function distribution. Drivers can quickly access other functions through the content input or voice assistant search in the top navigation bar. The driving fatigue reminder is placed in the center of the screen. When vehicle detects that the driver is driving fatigue, different prompt slogans are displayed according to the two fatigue mechanisms of long-time driving and monotonous driving environment. If it is detected that the driving time has reached a certain length, the words “You have been driving for XX hours, please stop and rest in time” and a flashing icon will be displayed in this area; if driving in a monotonous environment is detected, the words “Driving in a monotonous environment will cause fatigue, pay attention to rest, and ensure driving safety” will be displayed in this area.The find nearest service area function is located at the upper left of the functional area, represented by icons and text. After clicking, a list of nearby service areas can be displayed. The driver selects the service area he wants to go to and enters the navigation mode directly. The navigation can be displayed on the central screen of the dashboard. The enable driving assistance system function is located at the upper right of the functional area, represented by icons and text. Drivers can activate assisted driving function when tired to reduce driving burden. The play music and radio function is located at the lower left of the functional area, represented by icons and text. After clicking, the playback interface pops up and drivers can select their favorite music or radio stations. The set air conditioning function is located at the lower right of the functional area, represented by icons and text. After clicking, an interface to adjust air conditioning mode, temperature, wind speed and other parameters can be expanded to provide a comfortable driving environment. If the driver has special circumstances during driving and does not need to be reminded of fatigue driving, he can click the exit icon to exit this interface.
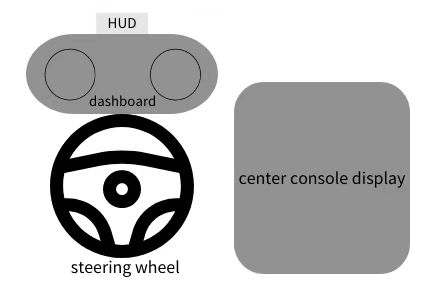
Figure 4. Cockpit Screen Distribution.
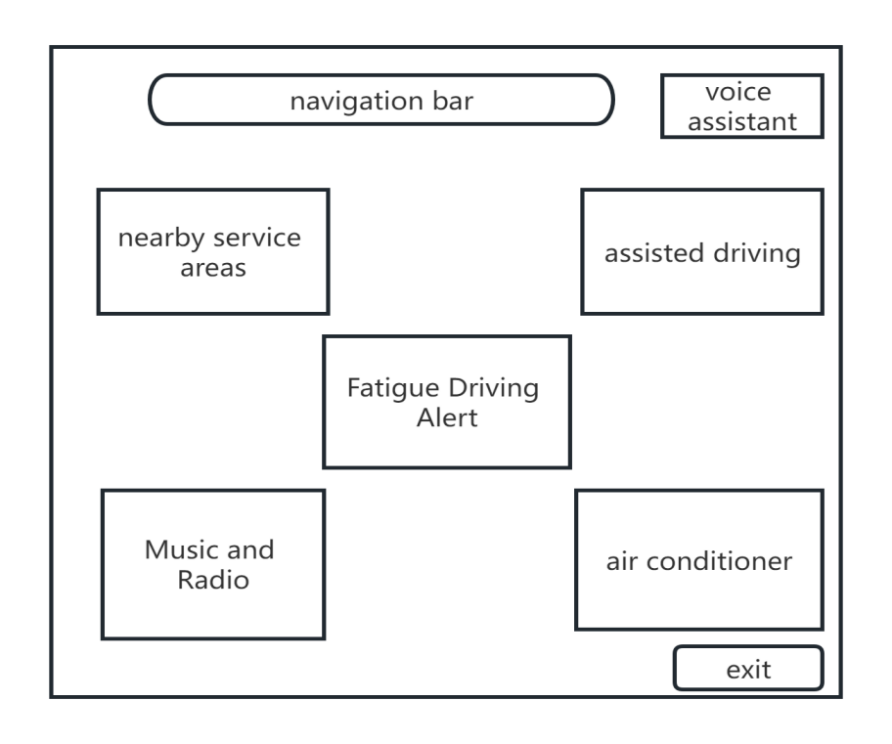
Figure 5. Central control interface function distribution diagram.
2.2.4. Interaction design
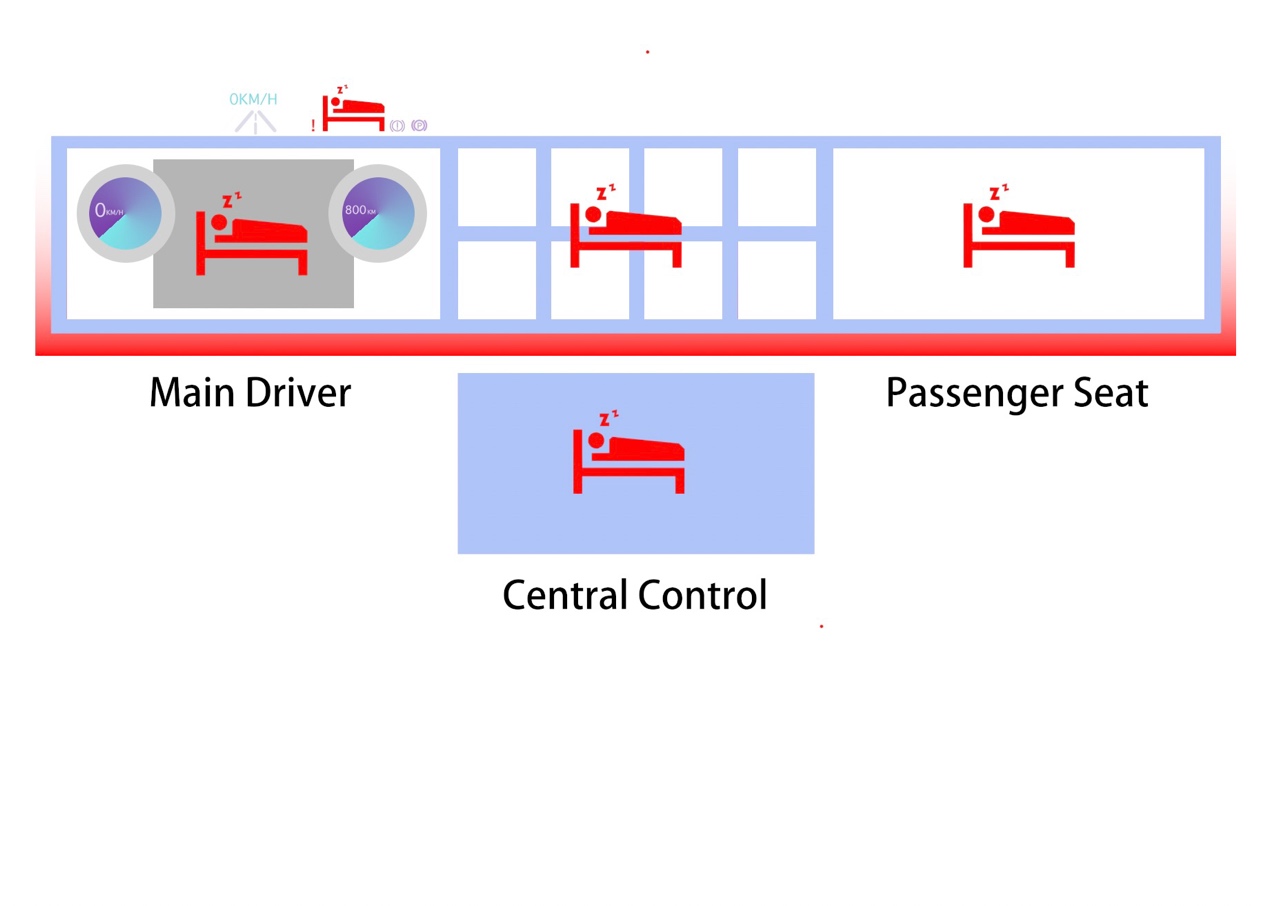
Figure 6. Output interface demonstration diagram.
This design scheme is based on the current full-screen vehicle. From left to right, it is the main driving area, the central control area, and the co-pilot entertainment area. The situation shown in the figure is the scene output by the system through the UI interface when the driver triggers the fatigue driving detection system. According to the relevant literature, red can play a warning role [9]. To better highlight the functionality of red in emergency scenarios, the theme tone of UI interface is mainly cold tone [10]. When the driver triggers the fatigue driving detection system, the system will produce the following reactions through the UI interface:
1) The HUD system will make the icon for warning fatigue driving appear from the functional icon at the bottom of the HUD interface in a way that uses the amplified dynamic effect and flashes the dynamic effect.
2) In the middle of the main driving, the icons warning fatigue driving appear in a fast-flashing manner.
3) the component function area between the central control screen and the main driver and the co-driver ‘s main screen will make the icon warning fatigue driving appear in a flashing manner, and at the same time suspend all non-driving functions in the central control area until the driver recovers awake.
4) the screen of the co-pilot ‘s entertainment area suspends entertainment functions such as music and video, flashes the icon of warning fatigue driving caused by the main driver, and pops up the corresponding emergency function control area, and the co-pilot temporarily takes over part of the vehicle ‘s safety function.
5) The ambient light is switched to red and flashes at a faster rate, causing the driver, co-pilot, and rear passengers to be alert.
Through the UI interface feedback mentioned above, combined with the corresponding tactile vibration in the car, the vigilance of the driver and occupant is improved, to avoid the danger when fatigue driving occurs to a certain extent [11].
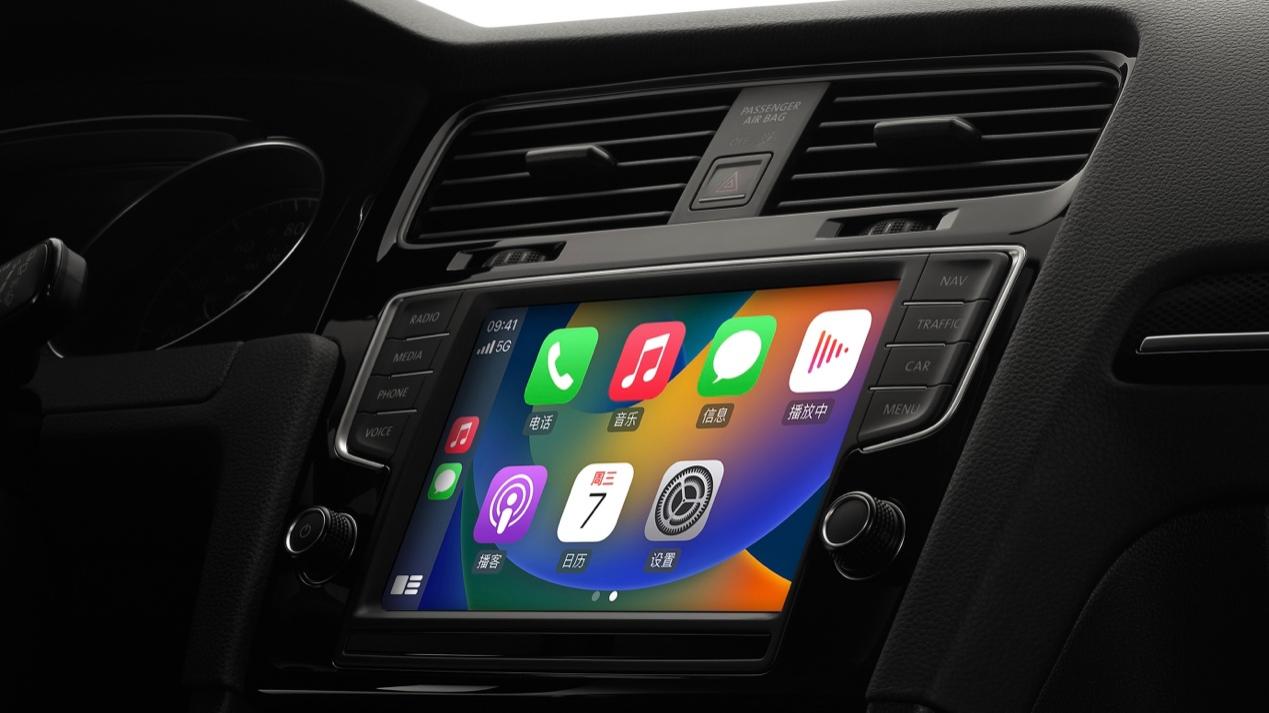
Figure 7. Apple CarPlay effect diagram(Picture from https://www.apple.com.cn/ios/carplay/).
The original Apple CarPlay is located on a screen in the central control area of the vehicle and does not fully access the functions of the vehicle, so that the information distribution of the vehicle is more dispersed, and the driver pays more attention. After long-term accumulation, the probability of driver fatigue during driving will increase significantly. In addition, the display of driving information such as navigation requires the driver to look down to the right. To a certain extent, it increases the driver ‘s distraction again, so that the driver ‘s attention and physical effort are increased again, and the probability of driving fatigue is higher. In addition, because Apple CarPlay is not connected to most of the functions of the vehicle, it cannot make some feedback and help when driving fatigue occurs. It does not make full use of the hardware equipped with the vehicle for feedback, and the function is relatively single, which is less helpful to anti-fatigue driving.
2.3. A/B test.
The A/B test aims to evaluate the improved effectiveness of the optimized UI interface designed in the thesis in alleviating driver fatigue driving relative to the traditional UI interface. Specifically, the test will focus on fatigue mechanisms induced by prolonged driving and a single driving environment.
2.3.1. Experimental design. The experiment was conducted in randomized groups: subjects were divided into 3 age groups (18-44 years old, 45-59 years old, 60 years old and above) and 2 gender groups (male, female), with a total of 6 groups, and the same number of subjects were randomly selected from each group to be assigned to Group A and Group B. Participants in Group A will use the traditional UI interface, while participants in Group B will use the optimized UI interface in the paper. Separate driving simulation experiments will be conducted for Groups A and B: two fatigue mechanisms will be simulated using a driving simulator.
2.3.2. Results Analysis. A questionnaire was designed to allow participants to self-assess the ease of use, visual appeal, and fatigue of the interface. This method, although highly subjective, can provide preliminary user feedback and opinions.
2.3.3. Questionnaire
Table 4. UI Experience Questionnaire.
Survey on UI Interface Experience for Driver Fatigue Driving |
Basic Information: |
1. Gender: Male / Female 2. Age: __ years old 3. Driving experience: __ years 4. Average weekly driving time: __ hours |
Evaluation of UI Interface on Fatigue Driving: |
Please answer the following questions to understand your perception of the UI interface in reducing fatigue driving: 1. After the reminder appears on the UI interface, do you feel more awake and focused? (Yes/No) 2. Is the UI interface helpful in reducing fatigue caused by prolonged driving? (Yes/No) 3. Is the design of the UI interface able to reduce fatigue caused by a monotonous driving environment? (Yes/No) 4. Does the UI interface help improve your attention level? (Yes/No) 5. Does the UI interface have a positive impact on your driving reaction time? (Yes/No) |
Evaluation of UI Interface Functions: |
You can use a 1-10 scoring system to rate the UI interface functions: 1. Simplicity of the UI interface 2. Conspicuousness of the UI interface 3. Types of functions on the UI interface 4. Ease of operation of the UI interface |
Overall Evaluation: |
Please evaluate your experience of using this in-vehicle interface (score from 1 to 5): - 1 (Very unsatisfied) - 2 (Unsatisfied) - 3 (Average) - 4 (Satisfied) - 5 (Very satisfied) |
Suggestions for UI Interface Improvement: Please briefly describe your perceptions and experience of the UI interface in reducing fatigue driving, and any suggestions or ideas for improvement. |
Thank you very much for participating in this questionnaire survey! Your responses are very important for our research. |
2.3.4. Expected results of the experiment. Through data analysis, we found that the improved UI interface positively affected fatigue driving to some extent. Participants generally agreed that the new UI interface was easier to stay awake and focused, which was helpful in reducing fatigue from prolonged driving and improved attention levels. These results suggest that the optimized design of the UI interface has some potential to address the problem of driver fatigue.
3. Discussion
This research provides valuable insights into optimizing vehicle user interfaces to mitigate driver fatigue, but there are some limitations. First, the study did not involve actual UI prototype development or user testing. Follow-up research should focus on implementing the proposed UI framework and evaluating it empirically through usability studies. Second, The main body explores fatigue driving, quantifies its factors, and proposes measurement standards. It connects human-machine interaction factors, models them using multiple linear regression, and provides mathematical references for interface optimization. However, the model’s accuracy is low, and its correlation relationships lack diversity. Future improvements include enhancing model accuracy and data relationship standards, possibly using deep learning models like CNNs and RNNs.
Additionally, the proposed simulated A/B test has limitations in ecological validity compared to real-world driving. Future work should evaluate the UI interface in naturalistic on-road studies with objective measures of fatigue and driving performance. The sample size and diversity of participants should also be expanded. This study considered two fatigue mechanisms, but drivers experience fatigue from a myriad of factors. Further research could investigate other causes of fatigue such as sleep deprivation. The study also did not examine the combined effects of the optimized UI with other countermeasures like rest breaks or caffeine.
Finally, the UI framework offers general principles but manufacturers will need to refine implementations for specific vehicles. Aspects like information architecture, graphics, interactions, and form factors should be human-centered and tested with users. With emerging in-vehicle technologies like augmented reality, opportunities exist to create more immersive fatigue-mitigating interfaces. Despite limitations, this research pioneers a structured methodology for applying human-computer interaction principles to optimize automotive user interfaces for addressing the critical problem of driver fatigue. Findings provide an initial set of guidelines that can inform future research and development of in-vehicle information systems aimed at enhancing road safety.
4. Conclusion
This paper explores the optimization of automotive user interface design to mitigate driver fatigue. Through analysis of the mechanisms of fatigue caused by prolonged driving duration and monotonous environment, a targeted UI interface with functional modules was designed. Parameters related to fatigue driving were analyzed quantitatively using previous data. Four UI design factors of simplicity, color imaging, feedback clarity and voice recognition were hypothesized to correlate with fatigue parameters. The improved interface aims to provide clear reminders, navigation assistance, entertainment, and voice functions to reduce driver workload and enhance alertness. The proposed A/B experiment will compare the optimized UI design against a traditional interface in relieving fatigue in simulated driving scenarios. Results are expected to demonstrate the positive effects of the new UI interface. This study also suffers from a number of limitations, including the lack of real-world test conditions in the simulated A/B experiment. Future research could focus on expanding the sample size and diversity of test participants, exploring additional mechanisms of fatigue, and integrating the user interface with other coping measures, and addressing these limitations could further validate the optimization principles outlined in this paper. In Overall, this study provides a structured approach to applying HCI principles for UI optimization to address driver fatigue.
References
[1]. Shi S, Tang W and Wang Y 2017 A review on fatigue driving detection ITM Web of Conferences 12 01019
[2]. Gao Z, Wang X, Yang Y, Mu C, Cai Q,Dang W and Zuo S 2019 EEG-based spatio–temporal convolutional neural network for driver fatigue evaluation IEEE transactions on neural networks and learning systems 30(9) 2755-63
[3]. Kashevnik A, Ponomarev A, Shilov N and Chechulin A 2022 Threats detection during human-computer interaction in driver monitoring systems Sensors 22(6) 2380
[4]. Sikander G and Anwar S 2019 Driver Fatigue Detection Systems: A Review IEEE Transactions on Intelligent Transportation Systems 20(6) 2339-52
[5]. National Highway Traffic Safety Administration. 2011. Traffic Safety Facts: Drowsy Driving. National Highway Traffic Safety Administration, 854, 1–3.
[6]. Tefft BC, AAA Foundation for Traffic Safety. 2014. Prevalence of Motor Vehicle Crashes Involving Drowsy Drivers, United States, 2009–2013.
[7]. Ting, P.-H., Hwang, J.-R., Doong, J.-L., & Jeng, M.-C. 2008. Driver fatigue and highway driving: A simulator study. Physiology & Behavior, 94(3), 448–453.
[8]. Zhang, X., Zhao, X., Du, H., & Rong, J. 2014. A Study on the Effects of Fatigue Driving and Drunk Driving on Drivers’ Physical Characteristics. Traffic Injury Prevention, 15(8), 801–808.
[9]. Zhang H, Nie Z, Xiao H, Wang D 2023, Color design of human-computer interaction interface in intelligent cockpit of unmanned vehicle [J]. Journal of Jilin University (Engineering Edition), 53 (05): 1315-1321
[10]. Wang D 2021, The application of visual accessibility in APP interface design [J]. Art and Design (Theory), 2 (07): 88-90
[11]. Yan A 2020 Research on interactive interface design of vehicle electronic information system based on unconscious cognition [D]. Taiyuan University of Technology, 2020 (05).
Cite this article
Wei,J.;Sun,Z.;Chen,H. (2024). Optimization of human-machine interface for fatigue driving problem . Applied and Computational Engineering,36,64-76.
Data availability
The datasets used and/or analyzed during the current study will be available from the authors upon reasonable request.
Disclaimer/Publisher's Note
The statements, opinions and data contained in all publications are solely those of the individual author(s) and contributor(s) and not of EWA Publishing and/or the editor(s). EWA Publishing and/or the editor(s) disclaim responsibility for any injury to people or property resulting from any ideas, methods, instructions or products referred to in the content.
About volume
Volume title: Proceedings of the 2023 International Conference on Machine Learning and Automation
© 2024 by the author(s). Licensee EWA Publishing, Oxford, UK. This article is an open access article distributed under the terms and
conditions of the Creative Commons Attribution (CC BY) license. Authors who
publish this series agree to the following terms:
1. Authors retain copyright and grant the series right of first publication with the work simultaneously licensed under a Creative Commons
Attribution License that allows others to share the work with an acknowledgment of the work's authorship and initial publication in this
series.
2. Authors are able to enter into separate, additional contractual arrangements for the non-exclusive distribution of the series's published
version of the work (e.g., post it to an institutional repository or publish it in a book), with an acknowledgment of its initial
publication in this series.
3. Authors are permitted and encouraged to post their work online (e.g., in institutional repositories or on their website) prior to and
during the submission process, as it can lead to productive exchanges, as well as earlier and greater citation of published work (See
Open access policy for details).
References
[1]. Shi S, Tang W and Wang Y 2017 A review on fatigue driving detection ITM Web of Conferences 12 01019
[2]. Gao Z, Wang X, Yang Y, Mu C, Cai Q,Dang W and Zuo S 2019 EEG-based spatio–temporal convolutional neural network for driver fatigue evaluation IEEE transactions on neural networks and learning systems 30(9) 2755-63
[3]. Kashevnik A, Ponomarev A, Shilov N and Chechulin A 2022 Threats detection during human-computer interaction in driver monitoring systems Sensors 22(6) 2380
[4]. Sikander G and Anwar S 2019 Driver Fatigue Detection Systems: A Review IEEE Transactions on Intelligent Transportation Systems 20(6) 2339-52
[5]. National Highway Traffic Safety Administration. 2011. Traffic Safety Facts: Drowsy Driving. National Highway Traffic Safety Administration, 854, 1–3.
[6]. Tefft BC, AAA Foundation for Traffic Safety. 2014. Prevalence of Motor Vehicle Crashes Involving Drowsy Drivers, United States, 2009–2013.
[7]. Ting, P.-H., Hwang, J.-R., Doong, J.-L., & Jeng, M.-C. 2008. Driver fatigue and highway driving: A simulator study. Physiology & Behavior, 94(3), 448–453.
[8]. Zhang, X., Zhao, X., Du, H., & Rong, J. 2014. A Study on the Effects of Fatigue Driving and Drunk Driving on Drivers’ Physical Characteristics. Traffic Injury Prevention, 15(8), 801–808.
[9]. Zhang H, Nie Z, Xiao H, Wang D 2023, Color design of human-computer interaction interface in intelligent cockpit of unmanned vehicle [J]. Journal of Jilin University (Engineering Edition), 53 (05): 1315-1321
[10]. Wang D 2021, The application of visual accessibility in APP interface design [J]. Art and Design (Theory), 2 (07): 88-90
[11]. Yan A 2020 Research on interactive interface design of vehicle electronic information system based on unconscious cognition [D]. Taiyuan University of Technology, 2020 (05).