


1. Introduction
Within the decades after industrialization, the majority of human industries and daily life are powered by the energy generated from fossil fuels. Even nowadays, fossil fuel is still one of the main sources that support the energy consumption in the world. It accounts for more than 80% of energy consumption [1]. However, as global energy consumption keeps increasing, people will be facing a more severe shortage of fossil fuels and an energy crisis in the next few decades. Meanwhile, the utilization of fossil-based energy leads to the emissions of vast quantities of greenhouse gases that contribute to global warming. Thus, it is vital to find sustainable and eco-friendly sources of energy as alternatives.
A favorable option being investigated for this is using biomass to produce synthesis gas (syngas). As a renewable organic material rich in nature, biomass could regrow in a comparatively short period in contrast to fossil fuel. The combustion of biomass does not release extra CO2 into the atmosphere. Common types of biomasses are solid waste, agricultural products and so on which have different carbon content [2]. Syngas is a gaseous mixture made up of varying amounts of hydrogen (H2) and carbon monoxide (CO). It could be utilized as a resource for transportation fuels and hydrogen fuel cells or other purposes [3]. It is regarded as a clean fuel having environmental benefits over other fossil fuels since its carbon dioxide (CO2) and nitrous oxide (N2O) emissions are considerably lower. Biomass gasification is a popular technology to produce syngas from biomass. As a gasifying agent, oxygen or oxygenates in the air are used to convert the combustible portion of biomass fuels into combustible gases (mainly H2, CO and CH4) and a small number of noncombustible gases like CO2 under high-temperature conditions [4]. Compared to the direct combustion method, biomass gasification technology has a high thermal efficiency.
Even though biomass gasification is an efficient method to generate syngas, according to previous literature, several factors during the production process would affect the yield from biomass gasification. This research focuses on the impacts of temperature and types of biomasses on synthesis gas production. We use the Rote learning method to fit the function of carbon content, hydrogen content, oxygen content and temperature of the birth material on the output of synthesis gas generated by gasification through MATLAB, where the unit of synthesis gas output is Nm3/kg.
Rice straw is a byproduct of rice harvesting. In the whole world, rice straw is produced at the amount of about 800 to 1,000 million tons annually [5]. Therefore, the prediction model would be applied to rice straw and the maximum syngas yield per unit mass of rice straw would be obtained. This per unit maximum syngas yield outcome would be utilized to estimate the total syngas yield in different areas around the world from rice straw. Different areas in the world have different focused industries. Not every country is favorable for developing an industry of syngas generation from biomass due to the limited availability of local biomass. Therefore, this project aims to find the distribution of syngas yields from rice straw through gasification around the world to figure out the potential of each area to develop the syngas production industry based on the estimation outcome. The world distribution map of syngas generated from rice straw would help people to analyze the potential of different areas and make ideal decisions about developing the syngas gasification industry. The final results are able to help to improve the efficiency of syngas production from the biomass gasification industry all over the world which would promote sustainable energy use and green economy. The results could be used as a reference for countries on different continents to plan their own industrial development and fiscal expenditure on a better basis. With a highly efficient syngas production method and well-planned future development, a new way of life and economic model will be reshaped.
2. Literature Review
2.1. Research methods and models available in the literature for syngas yield prediction from biomass gasification and Evaluation
Many researchers have worked on biomass gasification syngas yield prediction using a variety of methods and models. The main methods that are able to be utilized to describe the gasification procedures include thermodynamics, reaction kinetics, computational fluid dynamic (CFD) modeling, and so on. The following are some of the common methods and models.
Equilibrium modeling can be used as a benchmark for constructing the gasifier to make reasonable predictions on the ultimate composition, while also monitoring the process parameters like pressure [6]. Numerous studies have discovered significant similarities between modeling and theoretical predictions based on equilibrium models [7,8].
Kinetic models enable researchers to study plenty of factors that exceed the capability of equilibrium models. These kinetically based models, which represent the chemical reactions that take place when biomass is being gasified, are essential for the advancement, assessment, and enhancement of gasifiers. In various studies, this modeling approach for biomass gasification has been attempted [9-12].
CFD models take into account information on mass conservation, matter momentum, energy flow, hydrodynamics, as well as interactions among different gasifier stages [13,14]. The equations for the CFD tool may be defined using the CFD element matrix, accounting for the fluxes of the aforementioned quantities into and out of the control domain with appropriate boundary conditions.
ANN models are frequently used for modeling pyrolysis processes of biomass like agricultural residues, domestic solid wastes, and organic wastes [15].
2.2. Potential for machine learning applications in the energy field
Machine learning has great potential for application in the energy field. The energy system involves a large amount of data, including data from various parts of energy production, transmission, and consumption. Machine learning algorithms can use these data to extract hidden patterns and rules, thereby optimizing the operation of the energy system, predicting energy demand, optimizing energy supply, and so on. In the field of biomass gasification, machine learning can be used to predict gasification efficiency, optimize operating parameters, and improve the stability of the production process.
2.3. Overview of machine learning applications for biomass gasification in the existing literature
Ren et al. developed a physical information-based neural network approach (PINN) to predict the products, including CO, CO2, H2 and CH4 from the gasifying process [16].
Machine learning was used by Kim J. et al. to forecast the composition of synthesis gas production under various circumstances. They conducted research to estimate the composition of syngas using three techniques of machine learning methods: Support Vector Machine (SVM), Random Forest (RF), and Artificial Neural Network (ANN) [17].
Yang et al. investigated the optimal machine learning model for the gasification process using a hybrid database of ANN, decision tree, multiple linear regression, and support vector machine models evaluated by seven regression evaluation metrics [18].
A paper published by George et al. in 2018 also simulates the biomass gasification process by constructing a neural network using MATLAB, which takes into account more detailed elements and also brings the simulation closer to reality [19].
Baruah et al. constructed a neural network with carbon, hydrogen, oxygen, residue, moisture and reduction zone temperature as elements in 2018. The network proved to be effective, and its output closely aligned with the experimental data, demonstrating a high degree of correlation with an R2 value exceeding 0.98. [20].
In 2013, Puig-Arnavat et al. built an ANN model of the gasification process in two fluidized bed reactors with elements of moisture, residue, equivalence ratio, CHO, injected steam ratio and gasification temperature. However, due to the insufficient dataset, identical data were utilized for both testing and validation, leading to overfitting problems. [21].
Simulating the gasification process through neural networks is simple and accurate, but it requires huge data to support it, and if there is a lack of data there are many problems that can lead to poor simulation.
3. Methodology
The methodology part is compromised with the following steps:
1. The ANNs machine learning model is built for the prediction of syngas yield with different types of biomass and temperature conditions.
2. Then the rice straw is selected as the target biomass and its maximum syngas yield capacity is predicted from the model.
3. The data of total syngas yield from rice straw in different areas are visualized and displayed on a world map.
3.1. ANNs machine learning model for prediction
According to previous research, several factors affect the total yield of syngas among which temperature and types of biomasses are the relatively most significant ones. Therefore, the prediction model in this research concentrates on the effects of those two factors. Due to the difficulty of the digitization of the type of biomass, this factor is interchanged with the carbon, oxygen and hydrogen composition of certain types of biomass. Therefore, inputs for the machine learning model are temperature, carbon content, oxygen content and hydrogen content and the output is the total syngas yield per unit of weight of the biomass mass. (Figure 1).
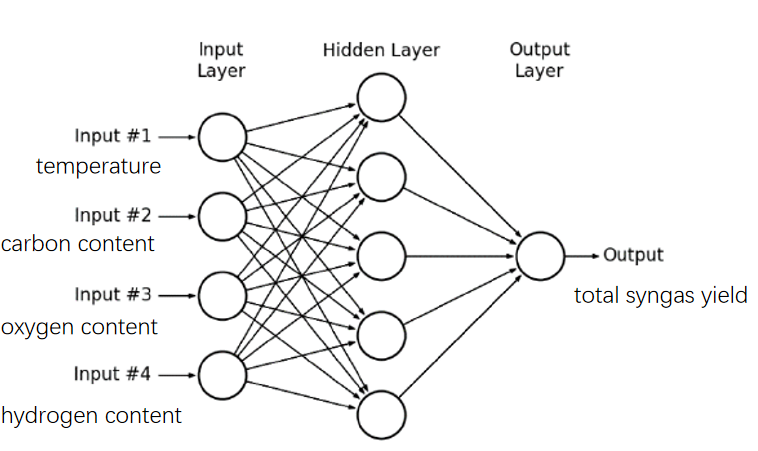
Figure 1. The Logic of ANNs Machine Learning Model
The data of syngas production from different components of biomass at different temperatures is collected for machine learning. It contains the chemical elemental composition of different types of biomasses and the syngas yield of each biomass per kilogram at different temperatures (Table 1). and then used the nnstart function in MATLAB to conduct Rote learning, and finally derived its model.
Table 1. Syngas yield from different types of biomass with Carbon, hydrogen, oxygen content and temperature [22].
Carbon (%wt.) | Hydrogen (%wt.) | Oxygen (%wt.) | Temperature (℃) | Gas Yield (Nm3/kg) | |
Wood | 43.73 | 4.62 | 40.96 | 472 | 1. 01 |
43.73 | 4.62 | 40.96 | 548 | 1.06 | |
43.73 | 4.62 | 40.96 | 570 | 1.1 | |
43.73 | 4.62 | 40.96 | 604 | 1.3 | |
43.73 | 4.62 | 40.96 | 474 | 1.83 | |
43.73 | 4.62 | 40.96 | 503 | 1.98 | |
43.73 | 4.62 | 40.96 | 605 | 2.01 | |
43.73 | 4.62 | 40.96 | 700 | 2.16 | |
43.73 | 4.62 | 40.96 | 402 | 2.76 | |
43.73 | 4.62 | 40.96 | 507 | 2.79 | |
43.73 | 4.62 | 40.96 | 603 | 2.82 | |
43.73 | 4.62 | 40.96 | 698 | 2.85 | |
Paper | 42.27 | 5.3 | 38.43 | 400 | 0.7 |
42.27 | 5.3 | 38.43 | 504 | 0.75 | |
42.27 | 5.3 | 38.43 | 631 | 0.79 | |
42.27 | 5.3 | 38.43 | 650 | 0.84 | |
42.27 | 5.3 | 38.43 | 489 | 1. 47 | |
42.27 | 5.3 | 38.43 | 504 | 1. 51 | |
42.27 | 5.3 | 38.43 | 651 | 1. 53 | |
42.27 | 5.3 | 38.43 | 690 | 1. 55 | |
42.27 | 5.3 | 38.43 | 475 | 2.07 | |
42.27 | 5.3 | 38.43 | 602 | 2.26 | |
42.27 | 5.3 | 38.43 | 660 | 2.3 | |
42.27 | 5.3 | 38.43 | 721 | 2.33 | |
Kitchen | 11. 15 | 1. 47 | 6.9 | 422 | 0.58 |
11. 15 | 1. 47 | 6.9 | 552 | 0.63 | |
11. 15 | 1. 47 | 6.9 | 600 | 0.65 | |
11. 15 | 1. 47 | 6.9 | 631 | 0.66 | |
11. 15 | 1. 47 | 6.9 | 446 | 1. 21 | |
11.15 | 1.47 | 6.9 | 500 | 1.35 | |
11.15 | 1.47 | 6.9 | 620 | 1.42 | |
11.15 | 1.47 | 6.9 | 653 | 1.44 | |
11.15 | 1.47 | 6.9 | 453 | 1.6 | |
11.15 | 1.47 | 6.9 | 514 | 1.68 | |
11.15 | 1.47 | 6.9 | 581 | 1.75 | |
11.15 | 1.47 | 6.9 | 653 | 1.81 | |
Textile | 46.8 | 5.63 | 40.95 | 503 | 0.9 |
46.8 | 5.63 | 40.95 | 670 | 0.93 | |
46.8 | 5.63 | 40.95 | 772 | 0.99 | |
46.8 | 5.63 | 40.95 | 440 | 1.84 | |
46.8 | 5.63 | 40.95 | 524 | 2.01 | |
46.8 | 5.63 | 40.95 | 640 | 2.12 | |
46.8 | 5.63 | 40.95 | 798 | 2.19 | |
46.8 | 5.63 | 40.95 | 450 | 2.77 | |
46.8 | 5.63 | 40.95 | 554 | 2.86 | |
46.8 | 5.63 | 40.95 | 632 | 2.9 | |
46.8 | 5.63 | 40.95 | 736 | 3.04 | |
HK MSW | 43.9 | 5.6 | 32.1 | 453 | 1.55 |
43.9 | 5.6 | 32.1 | 547 | 1.6 | |
43.9 | 5.6 | 32.1 | 636 | 1.63 | |
43.9 | 5.6 | 32.1 | 691 | 1.66 | |
43.9 | 5.6 | 32.l | 491 | 3.17 | |
43.9 | 5.6 | 32.l | 604 | 3.25 | |
43.9 | 5.6 | 32.l | 662 | 3.31 | |
43.9 | 5.6 | 32.l | 520 | 4.59 | |
43.9 | 5.6 | 32.l | 603 | 4.64 | |
43.9 | 5.6 | 32.l | 690 | 4.71 | |
PEPlastic | 85.83 | 14.38 | 0 | 548 | 2.32 |
85.83 | 14.38 | 0 | 626 | 3.03 | |
85.83 | 14.38 | 0 | 700 | 3.l | |
85.83 | 14.38 | 0 | 553 | 4.64 | |
85.83 | 14.38 | 0 | 650 | 5.17 | |
85.83 | 14.38 | 0 | 704 | 5.36 | |
85.83 | 14.38 | 0 | 420 | 7.03 | |
85.83 | 14.38 | 0 | 572 | 7.17 | |
85.83 | 14.38 | 0 | 661 | 7.28 | |
85.83 | 14.38 | 0 | 705 | 7.51 |
3.2. Syngas yield prediction from rice Straw
The machine learning model was applied to predict the ideal temperature required for producing syngas from rice straw. Syngas's estimated carbon, hydrogen, and oxygen content is 43.9%, 5.6%, and 32.1% respectively [22]. Thus, the independent variable now becomes the temperature of the gasification process while the dependent variable is the total syngas yield per unit mass of rice straw burnt. The independent variable, temperature, is modified to a range of 400 to 800 Celsius degrees. From the machine learning model, a graph showing the relationship between the temperature and syngas is gained as the other three variables, CHO content, are inputted. And the maximum yield of syngas per unit mass of rice straw is 4.71 Nm3 at 667 Celsius degrees which means that using 1 kilogram of rice straw for gasification could obtain syngas of 4.71 Nm3 (figure 2).
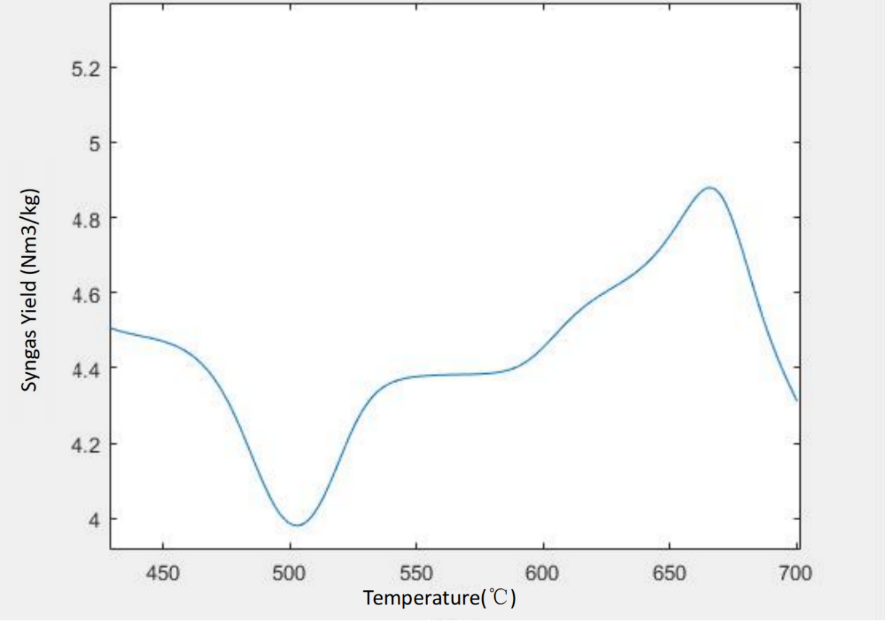
Figure 2. The relationship between gasification temperature and the syngas yield per unit mass of rice straw.
3.3. Data Processing and Visualization
The data on the dry ash produced from rice straw around the world from 2018 to 2020 was gathered (Table 2).
Table 2. The remaining dry ash from rice straw combustion around the world [23].
Area | wt. in 2020 (t) | wt. in 2019 (t) | wt. in 2018 (t) |
Northern Africa | 314530.7 | 312525.4 | 209386.1 |
Southern Africa | 768.35 | 771.1 | 774.95 |
Western Africa | 5993126.15 | 6051111.55 | 6658620.1 |
Northern America | 664845.5 | 551331 | 647707.5 |
Central America | 161527.3 | 153423.6 | 153942.25 |
Caribbean | 176810.7 | 196378.6 | 211157.65 |
South America | 2245515.25 | 2203519.45 | 2327963.55 |
Central Asia | 170463.15 | 170202.45 | 186812.45 |
Eastern Asia | 18150281.05 | 17944145.45 | 18227066 |
Southern Asia | 34573634.15 | 33736420.3 | 33853585.15 |
South-eastern Asia | 24234053.25 | 24190911.8 | 25381994.55 |
Western Asia | 126563.25 | 141955.55 | 71276.7 |
Eastern Europe | 125661.25 | 122700.05 | 118226.35 |
Northern Europe | 0 | 0 | 0 |
Southern Europe | 217022.85 | 212064.05 | 211817.1 |
Western Europe | 8145.5 | 8305 | 7304 |
Australia and New Zealand | 2753.85 | 4191 | 33633.05 |
Melanesia | 2306.15 | 2067.45 | 2310 |
Micronesia | 52.8 | 52.8 | 52.8 |
To convert the weight of dry ash from rice straw to the weight of rice straw used for syngas production through gasification, the equation is applied to each data listed below:
\( weight of rice straw=\frac{weight of dry ash×1000}{10\%}×5\% \)
In this equation, the weight of dry ash times 1000 is to convert the unit of ton to kilogram. The outcome of the previous step is divided by 10% which turns the weight of dry ash to the weight of total rice straw available. The rice straw used for gasification is assumed to be 5% of the total; thus, the total rice straw available is timed by 5%.
After every data from each year is processed, the weight of rice straw used for syngas generation by gasification is obtained. The mass of rice straw times the maximum yield of syngas from a unit mass of rice straw, that is 4.71 Nm3/kg, the total syngas yield from rice straw in different areas is acquired (Table 3).
Table 3. Syngas yields from rice straw by gasification from 2018 to 2020 around the world.
Area | syngas yield in 2020 (Nm3) | syngas yield in 2019 (Nm3) | syngas yield in 2018 (Nm3) | |
Northern Africa | 740719798.5 | 735997317 | 493104265.5 | |
Southern Africa | 1809464.25 | 1815940.5 | 1825007.25 | |
Western Africa | 14113812083 | 14250367700 | 15681050336 | |
Northern America | 1565711153 | 1298384505 | 1525351163 | |
Central America | 380396791.5 | 361312578 | 362533998.8 | |
Caribbean | 416389198.5 | 462471603 | 497276265.8 | |
South America | 5288188414 | 5189288305 | 5482354160 | |
Central Asia | 401440718.3 | 400826769.8 | 439943319.8 | |
Eastern Asia | 42743911873 | 42258462535 | 42924740430 | |
Southern Asia | 81420908423 | 79449269807 | 79725193028 | |
South-eastern Asia | 57071195404 | 56969597289 | 59774597165 | |
Western Asia | 298056453.8 | 334305320.3 | 167856628.5 | |
Eastern Europe | 295932243.8 | 288958617.8 | 278423054.3 | |
Northern Europe | 0 | 0 | 0 | |
Southern Europe | 511088811.8 | 499410837.8 | 498829270.5 | |
Western Europe | 19182652.5 | 19558275 | 17200920 | |
Australia and New Zealand | 6485316.75 | 9869805 | 79205832.75 | |
Melanesia | 5430983.25 | 4868844.75 | 5440050 | |
Micronesia | 124344 | 124344 | 124344 | |
The data of different areas is divided into seven groups based on their syngas yield. For each group, there is a color representing it, and the color displayed a trend from light to dark with the yield from low to high. A map is made to show the data about the syngas yield from rice straw in 2020.
4. Results and Discussion
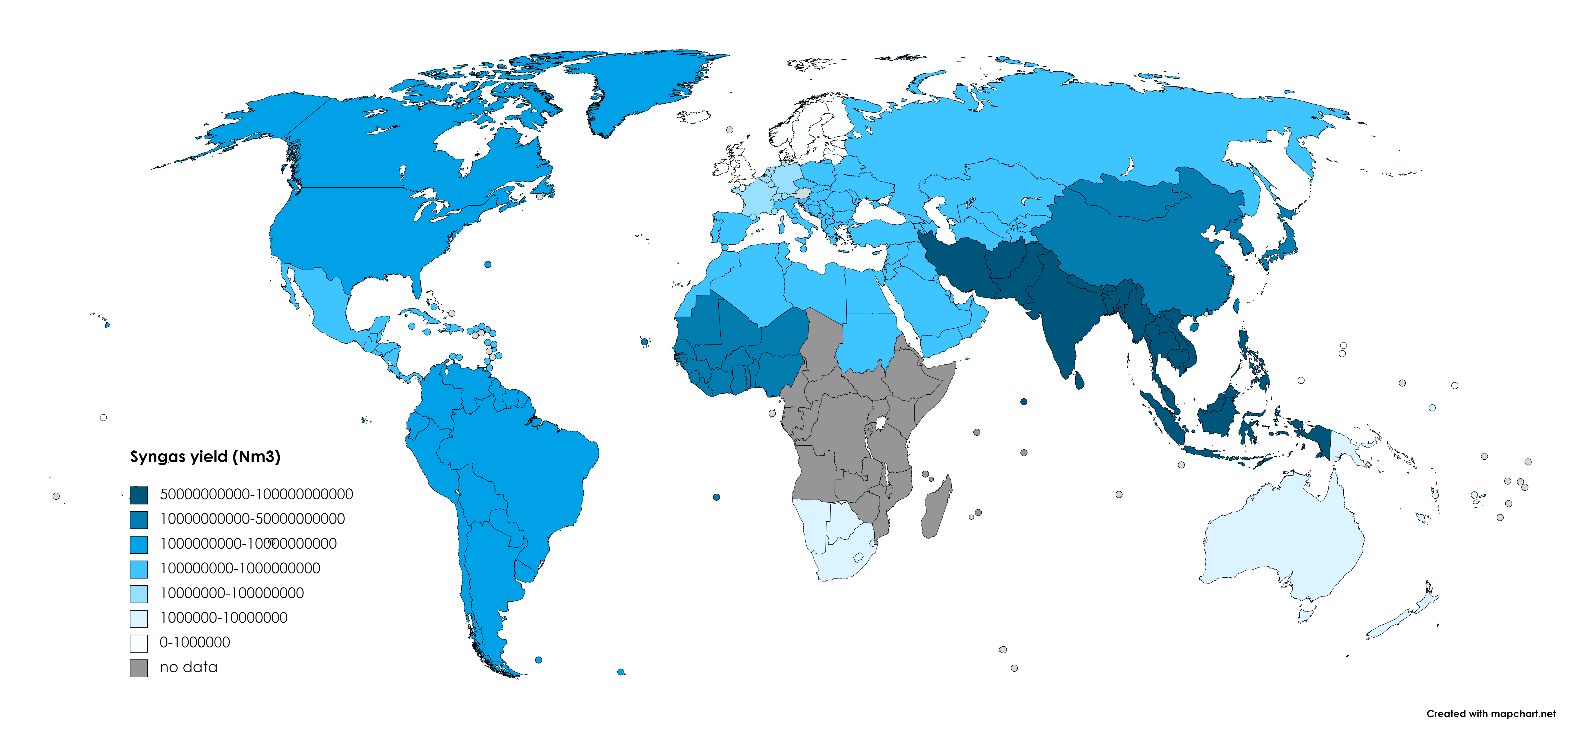
Figure 3. The distribution of syngas generated from rice straw in 2020.
This map shows that in the whole world, southern and south-eastern Asia had the most syngas yield from rice straw in 2020. Then the regions with relatively high syngas yield from rice straw are Eastern Asia and Western Africa. The following regions are Northern America and South America. Caribbean, Central Asia, Northern Africa, Central America, Western Asia, Southern Europe and Eastern Europe have moderate syngas yield compared to those regions mentioned above. Western Europe, Australia and New Zealand, Melanesia, Southern Africa, Micronesia have low syngas yield from rice straw in 2020. Northern Europe, specifically, has 0 production of rice straw which leads to 0 syngas yield in 2020.
In the regions with high syngas yield, those countries are able to gain more profits while investing less money since there is no need for them to import biomass from other countries which would be a great expense. Thus, the regions with more syngas yield from rice straw in 2020 would be more capable of developing the biomass gasification industry relying on rice straw. In this case, governments and industry players in those regions should concentrate more on the development of biomass gasification industries by investing more in research and advancement for biomass gasification technologies to achieve the potential of renewable energy from rice straw and implementing favorable policies and incentives to promote sustainable industrial development.
For the regions which have moderate or low syngas yield from rice straw, those differences in the productivity of syngas might be due to the variety of climates and natural resources like water or soil in different areas. For instance, western Asia is the driest region in Asia which has an annual precipitation average of about or less than 220 mm [24]. Such low precipitation limits the growth of rice straws in western Asia. In this case, it is essential for those regions to explore alternative biomass sources that are abundant in specific areas. Governments and major industry players should invest more in the study of locally available biomass resources for biomass gasification like wood pellets or food wastes. By diversifying biomass sources, these regions can still utilize biomass to generate renewable energy without relying solely on rice straw. Even in regions with unsuitable conditions for plant growth and subsequently low biomass productivity, it is important to explore and utilize various renewable energy sources such as solar and wind energy.
At the same time, cooperation between those regions with different rice straw availability can also contribute to the development of the biomass gasification industry. Cooperative means like cooperative platforms, joint research projects, and other cooperation would not only support regions with low syngas production to increase syngas yield but also help countries that have reached the bottleneck of industrial development to find a new development direction. In this case, the development of biomass gasification technology can be promoted.
5. Conclusion
In the research, a literature review is included about the past research on syngas yield model and method, machine learning about biomass gasification, and MATLAB-specific machine learning model. Then, a machine learning model is constructed to forecast the total syngas yield obtained from biomass through the gasification process. The inputs are temperature, carbon content, hydrogen content, and oxygen content among which the last three represent the different types of biomasses. The output is set to be the total synthesis gas yield from every kilogram of biomass. This model is applied to predict synthesis gas production from rice straw which has carbon, hydrogen, and oxygen composition at 43.9%, 5.6%, and 32.1% respectively. The optimal temperature is found to be 667 Celsius degree and the maximum syngas yield per unit mass of rice straw is found to be 4.71 Nm3/kilogram. With the data on rice straw available in different areas around the world from 2018 to 2020, the amount of rice straw used for the gasification of biomass is obtained. The synthesis gas yield in different regions of the world is acquired based on the maximum syngas yield and mass of available rice straw. The data on syngas yield in 2020 is visualized and the map of the syngas yield distribution in the world is established which makes the capability to produce syngas from rice straw more intuitive in different regions. The specific productivity and potential to develop the biomass gasification industry in different regions are discussed. For the regions with low syngas yield, some possible reasons are analyzed and some possible solutions for it are proposed.
6. Evaluation and Reflection
The graph below shows the performance of our machine-learning model. The R-value, which means the correlation between the model and the raw data, is about 0.75 which is relatively low compared to the highly precise model (Figure 4.). This is due to the limited availability of data from the internet and articles. It is reasonable to state that this is the outcome that we tried our best to get. In the future, if there is more data available, the data could be added to the model established in this research to improve the correlation between the prediction and raw data.
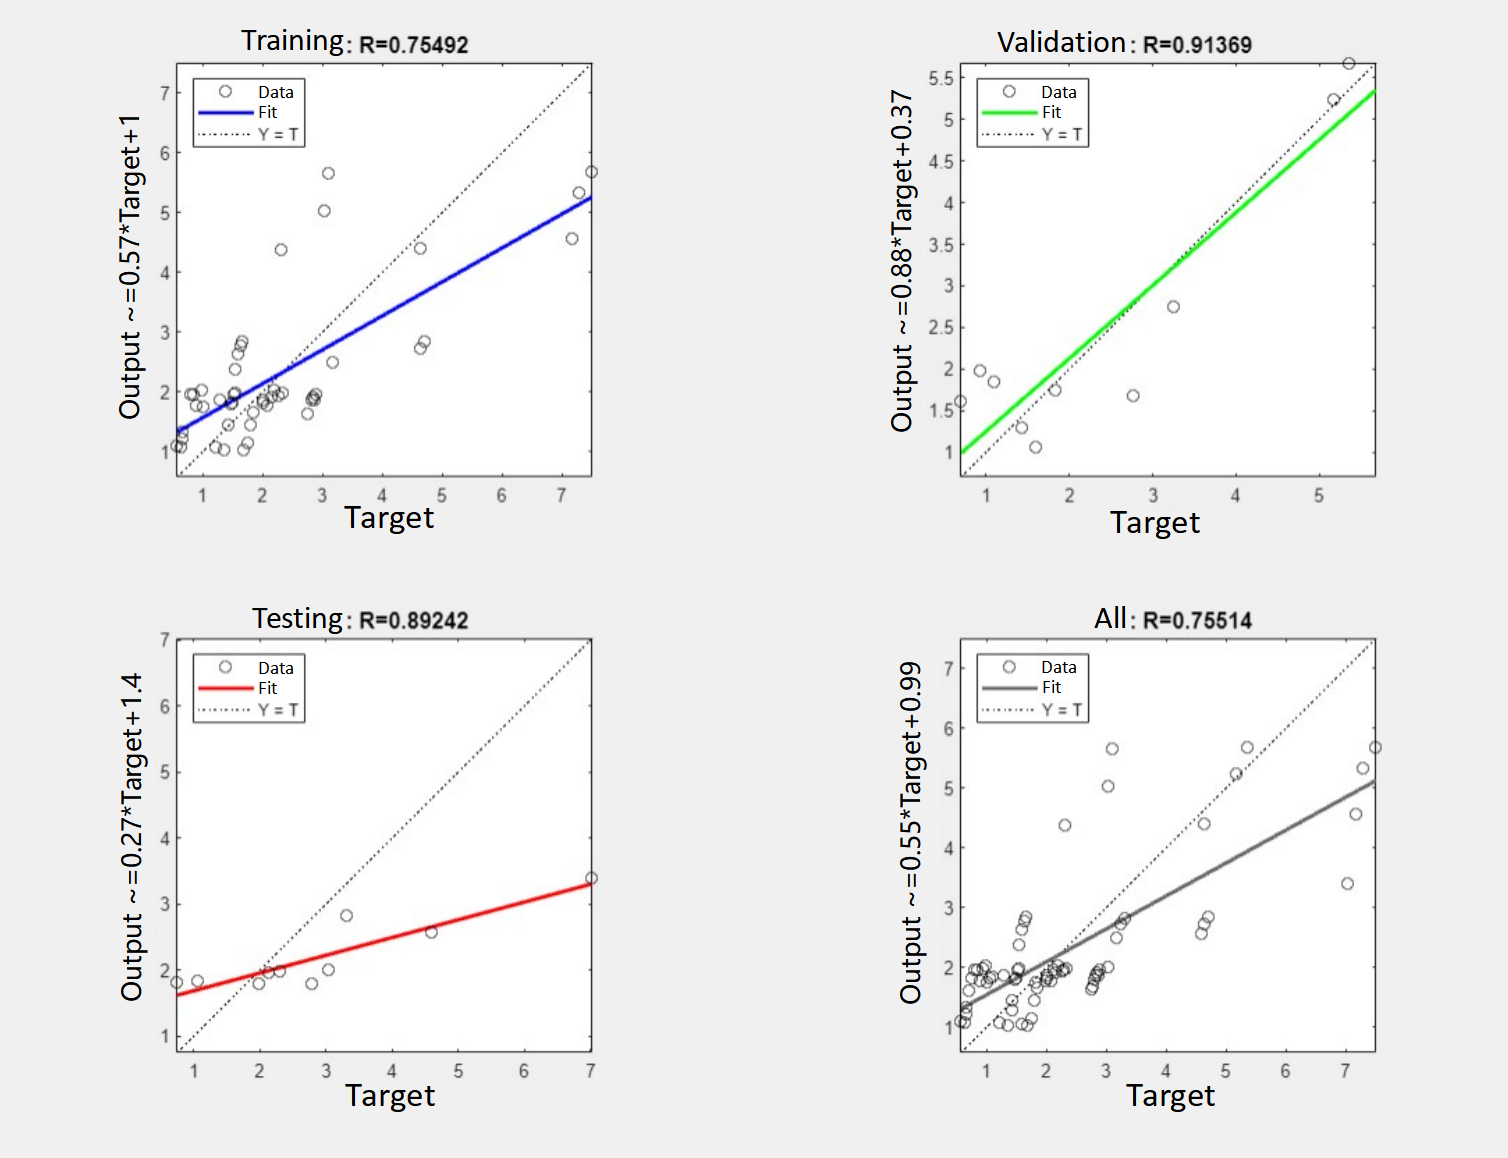
Figure 4. Model simulation performance
Meanwhile, there are many other types of biomasses like corn straw or wood residues. In the future, those specific biomass types could be more possible research directions despite only focusing on rice straw. And the output of our model is the total syngas yield. A more favorable output should include the composition of different gases. This is also an aspect that can potentially be improved in the research with more available data which include the portions of different gases.
Acknowledgment
Yurui Zhang, Jiexi Wang, Siqi Lai, and Zhishang Wu contributed equally to this work and should be considered co-first authors.
References
[1]. Ritchie, H., Roser, M., Rosado, P. (n.d.) Energy mix. Our World in Data. https://ourworldindata.org/energy-mix
[2]. U.S. Energy Information Administration (EIA). (2023) Biomass explained. https://www.eia.gov/energyexplained/biomass/
[3]. Preciado, J., Ortiz-Martinez, J., Gonzalez-Rivera, J., Sierra-Ramirez, R., Gordillo, G. (2012) Simulation of Synthesis Gas Production from Steam Oxygen Gasification of Colombian Coal Using Aspen Plus®. Energies, 5(12): 4924–4940.
[4]. Feng, Y., Xiao, B., Goerner, K., Cheng, G., Wang, J. (2011) Influence of Catalyst and Temperature on Gasification Performance by Externally Heated Gasifier. Smart Grid and Renewable Energy, 02(03): 177–183.
[5]. International Rice Research Institute. (2018) Rice Straw Management. https://www.irri.org/rice-straw-management
[6]. Baruah, D., Baruah, D. (2014) Modeling of biomass gasification: A review. Renewable and Sustainable Energy Reviews, 39: 806–815.
[7]. Chaurasia, A. (2018) Modeling of downdraft gasification process: Studies on particle geometries in the thermally thick regime. Energy, 142: 991–1009.
[8]. Gambarotta, A., Morini, M., Zubani, A. (2018) A non-stoichiometric equilibrium model for the simulation of the biomass gasification process. Applied Energy, 227: 119–127.
[9]. Di Blasi, C., Branca, C. (2013) Modeling a stratified downdraft wood gasifier with primary and secondary air entry. Fuel, 104: 847–860.
[10]. Fermoso, J., Arias, B., Pevida, C., Plaza, M. G., Rubiera, F., Pis, J. J. (2008) Kinetic models comparison for steam gasification of different nature fuel chars. Journal of Thermal Analysis and Calorimetry, 91(3): 779–786.
[11]. Sheth, P. N., Babu, B. (2009) Experimental studies on producer gas generation from wood waste in a downdraft biomass gasifier. Bioresource Technology, 100(12): 3127–3133.
[12]. Sikarwar, V. S., Zhao, M., Clough, P., Yao, J., Zhong, X., Memon, M. Z., Shah, N., Anthony, E. J., Fennell, P. S. (2016). An overview of advances in biomass gasification. Energy & Environmental Science, 9(10): 2939–2977.
[13]. Janajreh, I., Al Shrah, M. (2013) Numerical and experimental investigation of downdraft gasification of wood chips. Energy Conversion and Management, 65: 783–792.
[14]. Kumar, S., Sarma, A. (2013) Recent Advances in Bioenergy Research. Vol. I. SSS-NIRE Publishing, Kapurthala
[15]. Costa, M., Rocco, V., Caputo, C., Cirillo, D., Di Blasio, G., La Villetta, M., Martoriello, G., Tuccillo, R. (2019) Model based optimization of the control strategy of a gasifier coupled with a spark ignition engine in a biomass powered cogeneration system. Applied Thermal Engineering, 160: 114083.
[16]. Ren, S., Wu, S., Weng, Q. (2023) Physics-informed machine learning methods for biomass gasification modeling by considering monotonic relationships. Bioresource Technology, 369: 128472.
[17]. Kim, J. Y., Kim, D., Li, Z. J., Dariva, C., Cao, Y., Ellis, N. (2022). Predicting and Optimizing Syngas Production from Fluidized Bed Biomass Gasifiers: A Machine Learning Approach. SSRN Electronic Journal.
[18]. Yang, Q., Zhang, J., Zhou, J., Zhao, L., Zhang, D. (2023) A hybrid data-driven machine learning framework for predicting the performance of coal and biomass gasification processes. Fuel, 346: 128338.
[19]. George, J., Arun, P., Muraleedharan, C., 2018. Assessment of producer gas composition in air gasification of biomass using artificial neural network model. Int. J. Hydrog. Energy, 43(20): 9558–9568.
[20]. Baruah, D., Baruah, D.C., Hazarika, M.K., 2017. Artificial neural network based modeling of biomass gasification in fixed bed downdraft gasifiers. Biomass Bioenergy, 98: 264–271.
[21]. Puig-Arnavat, M., Hernández, J.A., Bruno, J.C., Coronas, A., 2013. Artificial neural network models for biomass gasification in fluidized bed gasifiers. Biomass Bioenergy, 49: 279–289.
[22]. Kardani, N., Zhou, A., Nazem, M., Lin, X. (2021, April) Modelling of municipal solid waste gasification using an optimised ensemble soft computing model. Fuel, 289: 119903.
[23]. FAOSTAT. (n.d.). Emissions from Burning of crop residues. https://www.fao.org/faostat/en/#data/GB
[24]. Schamm, K., Ziese, M., Becker, A., Finger, P., Meyer-Christoffer, A., Schneider, U., Schröder, M., Stender, P. (2014). Global gridded precipitation over land: a description of the new GPCC First Guess Daily product. Earth System Science Data, 6(1): 49–60.
Cite this article
Zhang,Y.;Wang,J.;Lai,S.;Wu,Z. (2024). Prediction of syngas yield from biomass by gasification and related application. Applied and Computational Engineering,44,138-149.
Data availability
The datasets used and/or analyzed during the current study will be available from the authors upon reasonable request.
Disclaimer/Publisher's Note
The statements, opinions and data contained in all publications are solely those of the individual author(s) and contributor(s) and not of EWA Publishing and/or the editor(s). EWA Publishing and/or the editor(s) disclaim responsibility for any injury to people or property resulting from any ideas, methods, instructions or products referred to in the content.
About volume
Volume title: Proceedings of the 2023 International Conference on Machine Learning and Automation
© 2024 by the author(s). Licensee EWA Publishing, Oxford, UK. This article is an open access article distributed under the terms and
conditions of the Creative Commons Attribution (CC BY) license. Authors who
publish this series agree to the following terms:
1. Authors retain copyright and grant the series right of first publication with the work simultaneously licensed under a Creative Commons
Attribution License that allows others to share the work with an acknowledgment of the work's authorship and initial publication in this
series.
2. Authors are able to enter into separate, additional contractual arrangements for the non-exclusive distribution of the series's published
version of the work (e.g., post it to an institutional repository or publish it in a book), with an acknowledgment of its initial
publication in this series.
3. Authors are permitted and encouraged to post their work online (e.g., in institutional repositories or on their website) prior to and
during the submission process, as it can lead to productive exchanges, as well as earlier and greater citation of published work (See
Open access policy for details).
References
[1]. Ritchie, H., Roser, M., Rosado, P. (n.d.) Energy mix. Our World in Data. https://ourworldindata.org/energy-mix
[2]. U.S. Energy Information Administration (EIA). (2023) Biomass explained. https://www.eia.gov/energyexplained/biomass/
[3]. Preciado, J., Ortiz-Martinez, J., Gonzalez-Rivera, J., Sierra-Ramirez, R., Gordillo, G. (2012) Simulation of Synthesis Gas Production from Steam Oxygen Gasification of Colombian Coal Using Aspen Plus®. Energies, 5(12): 4924–4940.
[4]. Feng, Y., Xiao, B., Goerner, K., Cheng, G., Wang, J. (2011) Influence of Catalyst and Temperature on Gasification Performance by Externally Heated Gasifier. Smart Grid and Renewable Energy, 02(03): 177–183.
[5]. International Rice Research Institute. (2018) Rice Straw Management. https://www.irri.org/rice-straw-management
[6]. Baruah, D., Baruah, D. (2014) Modeling of biomass gasification: A review. Renewable and Sustainable Energy Reviews, 39: 806–815.
[7]. Chaurasia, A. (2018) Modeling of downdraft gasification process: Studies on particle geometries in the thermally thick regime. Energy, 142: 991–1009.
[8]. Gambarotta, A., Morini, M., Zubani, A. (2018) A non-stoichiometric equilibrium model for the simulation of the biomass gasification process. Applied Energy, 227: 119–127.
[9]. Di Blasi, C., Branca, C. (2013) Modeling a stratified downdraft wood gasifier with primary and secondary air entry. Fuel, 104: 847–860.
[10]. Fermoso, J., Arias, B., Pevida, C., Plaza, M. G., Rubiera, F., Pis, J. J. (2008) Kinetic models comparison for steam gasification of different nature fuel chars. Journal of Thermal Analysis and Calorimetry, 91(3): 779–786.
[11]. Sheth, P. N., Babu, B. (2009) Experimental studies on producer gas generation from wood waste in a downdraft biomass gasifier. Bioresource Technology, 100(12): 3127–3133.
[12]. Sikarwar, V. S., Zhao, M., Clough, P., Yao, J., Zhong, X., Memon, M. Z., Shah, N., Anthony, E. J., Fennell, P. S. (2016). An overview of advances in biomass gasification. Energy & Environmental Science, 9(10): 2939–2977.
[13]. Janajreh, I., Al Shrah, M. (2013) Numerical and experimental investigation of downdraft gasification of wood chips. Energy Conversion and Management, 65: 783–792.
[14]. Kumar, S., Sarma, A. (2013) Recent Advances in Bioenergy Research. Vol. I. SSS-NIRE Publishing, Kapurthala
[15]. Costa, M., Rocco, V., Caputo, C., Cirillo, D., Di Blasio, G., La Villetta, M., Martoriello, G., Tuccillo, R. (2019) Model based optimization of the control strategy of a gasifier coupled with a spark ignition engine in a biomass powered cogeneration system. Applied Thermal Engineering, 160: 114083.
[16]. Ren, S., Wu, S., Weng, Q. (2023) Physics-informed machine learning methods for biomass gasification modeling by considering monotonic relationships. Bioresource Technology, 369: 128472.
[17]. Kim, J. Y., Kim, D., Li, Z. J., Dariva, C., Cao, Y., Ellis, N. (2022). Predicting and Optimizing Syngas Production from Fluidized Bed Biomass Gasifiers: A Machine Learning Approach. SSRN Electronic Journal.
[18]. Yang, Q., Zhang, J., Zhou, J., Zhao, L., Zhang, D. (2023) A hybrid data-driven machine learning framework for predicting the performance of coal and biomass gasification processes. Fuel, 346: 128338.
[19]. George, J., Arun, P., Muraleedharan, C., 2018. Assessment of producer gas composition in air gasification of biomass using artificial neural network model. Int. J. Hydrog. Energy, 43(20): 9558–9568.
[20]. Baruah, D., Baruah, D.C., Hazarika, M.K., 2017. Artificial neural network based modeling of biomass gasification in fixed bed downdraft gasifiers. Biomass Bioenergy, 98: 264–271.
[21]. Puig-Arnavat, M., Hernández, J.A., Bruno, J.C., Coronas, A., 2013. Artificial neural network models for biomass gasification in fluidized bed gasifiers. Biomass Bioenergy, 49: 279–289.
[22]. Kardani, N., Zhou, A., Nazem, M., Lin, X. (2021, April) Modelling of municipal solid waste gasification using an optimised ensemble soft computing model. Fuel, 289: 119903.
[23]. FAOSTAT. (n.d.). Emissions from Burning of crop residues. https://www.fao.org/faostat/en/#data/GB
[24]. Schamm, K., Ziese, M., Becker, A., Finger, P., Meyer-Christoffer, A., Schneider, U., Schröder, M., Stender, P. (2014). Global gridded precipitation over land: a description of the new GPCC First Guess Daily product. Earth System Science Data, 6(1): 49–60.