


1. Introduction
The information used to create remote sensing photographs comes from sensors installed on satellites, and they act as the information carriers for the remote sensing identification of objects. We may measure and monitor the intricate structure of the Earth’s surface using remote sensing photographs, which are a useful source of data for Earth observation. For different types of scenes, there are different methods for processing remote-sensing images. Therefore, natural scene classification has become an indispensable part of this work. Effectively understanding remote sensing pictures is a crucial and difficult problem, and it has long been an active study area. [1].
Remote sensing image scene classification is a process of recognizing and classifying the surface attributes of elements on a given remote sensing image. At present, there have been plenty of attempts in this field, such as self Supervised learning [2], multi-mode deep learning [3], etc. Furthermore, at the same time, many different types of high-quality remote sensing datasets have emerged, such as LandCoverNet [4], a global land cover classification training dataset based on Sentinel-2 satellite observations with 10m spatial resolution, and TG1HRSSC [5], a multispectral segment, high spatial resolution and multitemporal hyperspectral remote sensing scene classification dataset based on Tiangong-1, and the new remote sensing natural scene classification benchmark dataset NaSC-TG2 [6] based on Tiangong-2 remote sensing images.
The NaSC-TG2 dataset is a remote sensing image dataset released by the Center for Space Application Engineering and Technology of the Chinese Academy of Sciences in 2021. It includes 20000 remote sensing photographs grouped into ten natural scenes: beach, circle farmland, cloud, desert, forest, mountain, rectangle farmland, residential, river, and snowberg. Each scene has 2000 images of 128×128 pixels, including true color RGB images and multispectral images [6]. This work mainly conducted a series of comparative experiments on the NaSC-TG2 dataset, aiming to identify the optimal model.
2. Literature Review
This section primarily reviews recent developments in remote sensing image classification as well as numerous successes that have been made using the NaSC-TG2 dataset.
There have been several successful outcomes so far in the classification of remote sensing images. Song, Gao, Zhu, and Ma summarized the previous work, which was mainly about the application of deep learning based on Convolutional neural networks (CNNs) in remote sensing image classification [7]. Bazi et al. proposed a remote sensing scene classification method based on the visual converter. These networks were regarded as the most sophisticated natural language processing models because they do not rely on convolutional layers like the conventional convolutional neural network does. They used multi-head attention mechanisms as the basic building element to infer long-range contextual associations between pixels in images [8]. Kumari, M, Kaul introduced five methods to achieve remote sensing image scene classification which included convolutional neural networks, autoencoders, generative adversarial networks, vision transformers, and few-shot learning, and compared the effectiveness of different technology for datasets with different scales [9].
A few developments have been achieved in the classification of the NaSC-TG2 dataset in recent years. Singh et al. proposed a waveletinspired attention-based convolution neural network (WIANet) architecture, which combines a wavelet convolution and attention unit with the modeling of the spatio-spectral resolution of multispectral remote sensing (RS) images, to form a single deep learning architecture for land cover classification. This method achieved 91.80% OA after training 100 epochs on the NaSC-TG2 dataset [10]. Jing et al. proposed CABNN, a lightweight multispectral classification method based on binary neural networks (BNNs), which achieved 96.32% OA and 96.33% AA on NaSC-TG2 [11]. Liu, Qu and Zhang suggested a cross-modal knowledge distillation system that may increase the capability of multispectral scene categorization by transferring previous information from teacher models pre-trained on RGB pictures to the student network with limited data [12]. Wang et al. proposed a lightweight network with a random depth strategy for remote sensing scene classification (LRSCM). This method achieved an accuracy of 98.67% on a 10% training ratio of NaSC-TG2 and 99.03% on a 20% training ratio of NaSC-TG2 [13]. The self-attention mechanism was added to the VGG network by Liu et al., who employed two cascaded self-attention blocks to replace the last four convolutional layers in the VGG-19 network, each block consisting of two multi-head self-attention (MHSA) layers with the remaining network structure. The finely tuned VGG-SA achieved 98.73% OA on NaSC-TG2 [14]. Chen et al. proposed the PyHENet, a generic post-quantum platform, which perfectly combined Cryptography with a plaintext deep learning library. This method achieved an accuracy of 95.05% on the NaSC-TG2 dataset [15]. Tao et al. presented The Original Vision (TOV) model in the field of remote sensing and trained it using enormous unlabeled optical data along a human-like self-supervised learning (SSL) path from general knowledge to specialized knowledge. The method was tested on the NaSC-TG2 dataset, and after fine-tuning the model with 50 labeled samples, a 95.05% OA was obtained [16]. Akhtar et al. used cross-domain transfer learning to classify land cover in natural scene remote sensing photos. The deployed cross-domain transfer-learning system obtained 99.5% and 99.1% accuracy on the NaSC-TG2 test [17].
However, the classification work for the NaSC-TG2 dataset is still insufficient and the methods are not diverse enough presently. As a result, this experiment seeks to use a convolutional neural network-based technique to develop a novel way of NaSC-TG2 dataset classification. The work will compare the performance effect of the ResNet and its variants on the dataset, and select the best method suitable for it.
3. Methodology
3.1. Sample dataset
The massive high-quality earth observation image data set NaSC-TG2 [6], which was acquired by the Tiangong-2 wide-band imager during its orbit and released by the Center for Space Application Engineering and Technology of the Chinese Academy of Sciences in 2021, was used as the sample data set. The scene categories include beach, circle farmland, cloud, desert, forest, mountain, rectangle farmland, residential, river, and snowberg(as shown in figure 1), with a total of 10 types of scenes. The training proportion is 10%, with 200 photos chosen for training in each category and the remaining 18000 images utilized for testing and model assessment.
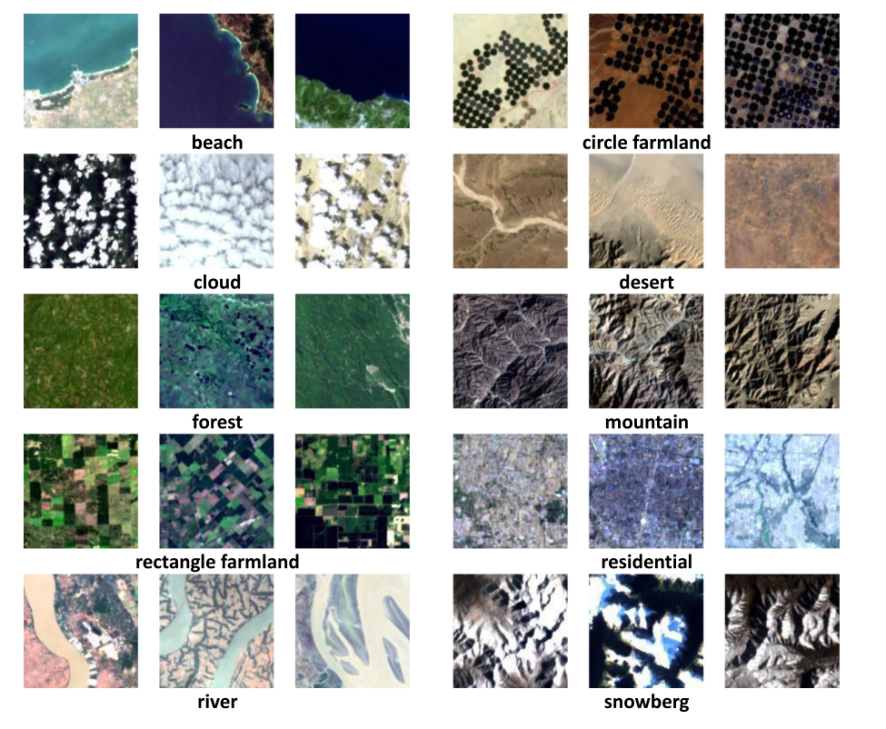
Figure 1. Examples of each natural scene in the NaSC-TG2 [6].
3.2. Preprocessing
To facilitate subsequent processing and recognition, a simple image enhancement algorithm was first used for the image dataset, thereby achieving the effect of improving model accuracy. The processing method mainly includes normalizing image size, scaling the image to extract more features, randomly cropping, rotating, and flipping the image to simulate shooting from different angles, and randomly adjusting image contrast, brightness, saturation, and chromaticity to simulate different scene environments.
3.3. Models
The residual network ResNet [18] and its variants SE-ResNeXt [19] and ResNeSt [20] were selected for comparative experiments on the dataset. SE-ResNeXt is based on the ResNeXt model, applying the SE module (Squeeze-and-Excitation) to the residual block [19]. Table 1 below shows the network configuration of ResNet-50 and SE ResNet50. Moreover, ResNeSt is a model that draws on the structures of ResNeXt, SE Net, and SK Net and proposes a split-attention module based on them [20].
Table 1. Network configuration of ResNet-50 and SE-ResNet-50 [19].
Output size | ResNet-50 | SE-ResNet50 |
112×112 | Conv, 7×7, 64, stride2 | |
56×56 | Max pool, 3×3, stride2 | |
|
| |
28×28 |
|
|
14×14 |
|
|
7×7 |
|
|
1×1 |
| |


 global average pool, 1000-d , softmax
ResNeSt is a variant of the ResNet network proposed by Zhang et al. [20]. The suggestion of a split-attention module, a basic modular computational block that can replace popular residual blocks and build more diversified representations through cross-feature interaction, is the most essential component of the study. The split attention module is divided into two parts: the Feature Map Group and the Split attention operation. The input feature map is divided into K Cardinal groups and R groupings inside each Cardinal group using ResNeSt, resulting in a total number of feature groups of G=KR [21]. The convolution of 1×1 and 3×3 was carried out in each group, respectively, and then the features will be blended by weight through Split-Attention, as shown in the ResNeSt block structure in figure 2.
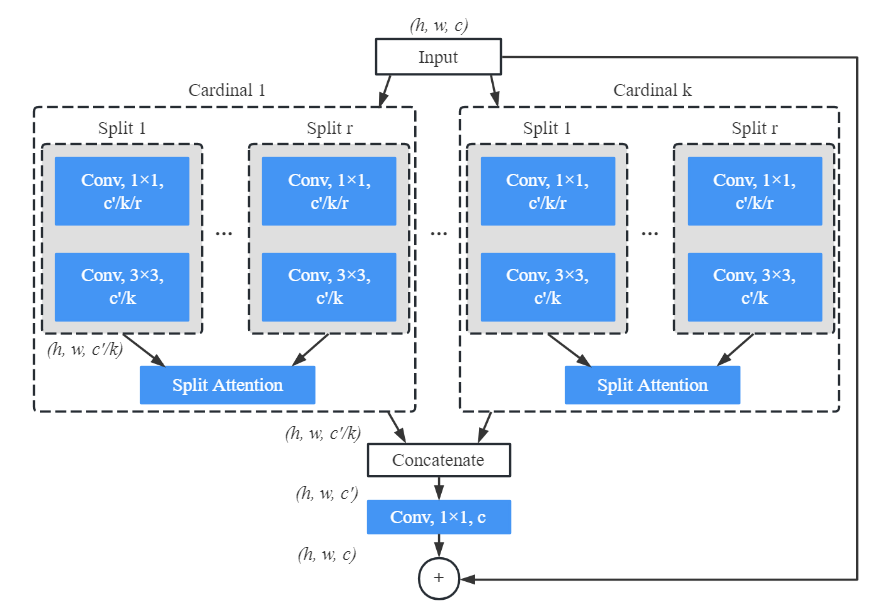
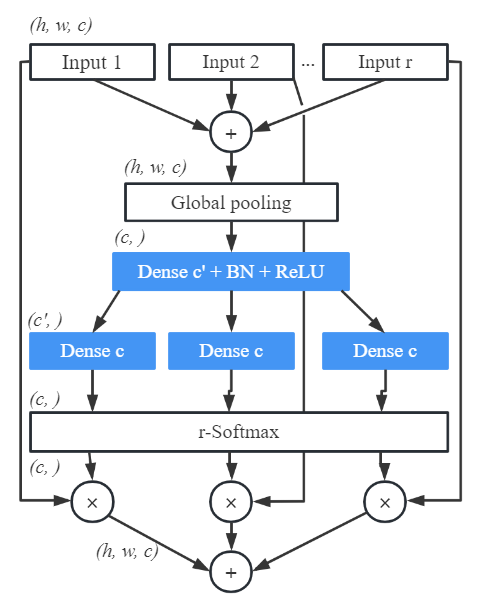
Figure 2. ResNeSt block structure [20]. Figure 3. Split-Attention structure [20].
And the Split-Attention structure in each cardinal group is shown in figure 3.
In Split-Attention, the obtained features will be summed first, and then a feature vector with the same dimension as the split image features will be obtained through a global average pooling operation. After that, the weight coefficients will be assigned, and the weights of each split image feature will be calculated using r-softmax. Finally, each split image feature will be multiplied by its corresponding weight and summed.
3.4. Experiment
The experiment was based on the AI studio platform, using the PaddlePaddle framework and Adam optimization functions. Firstly, the NaSC-TG2 dataset was divided into training: testing=1:9, using the same number of photos in the training set for each category, which means that each category also accounts for 10% of the training set. Then the pictures were preprocessed, after that experiments were carried out on different depths of the ResNet, SE ResNeXt, and ResNeSt models, namely ResNet50, ResNet101, ResNet152, SE-ResNeXt50, SE-ResNeXt101, SE-ResNeXt152, ResNeSt50, ResNeSt101, and ResNeSt200. Based on the transfer learning method, the pictures were trained on these nine models.
The specific configuration of the training environment was as follows:
Table 2. Training environment.
GPU | Tesla V100 |
CPU | 2 Cores |
Video Memory | 16GB |
RAM | 16GB |
Disk | 100GB |
After finishing the training, testing was carried out on the testing set. The trained models were used to classify and predict the NaSC-TG2 test set and then calculated the results of classification accuracy, single image prediction time, and model parameter size of each model for comparison.
4. Results
4.1. Model comparison
After the training was completed, 18000 test images were used, including 1800 for each scenario type, to evaluate 9 models. Table 3 displays the specific outcomes.
Table 3. Evaluating results.
Model | Accuracy | Cost Time | Params |
ResNet50 | 95.07% | 16ms/step | 142M |
ResNet101 | 94.02% | 28ms/step | 256M |
ResNet156 | 93.74% | 40ms/step | 350M |
SE-ResNeXt50 | 92.28% | 25ms/step | 154M |
SE-ResNeXt101 | 93.02% | 48ms/step | 283M |
SE-ResNeXt156 | 90.65% | 77ms/step | 379M |
ResNeSt50 | 98.30% | 34ms/step | 147M |
ResNeSt101 | 98.52% | 70ms/step | 267M |
ResNeSt200 | 98.48% | 158ms/step | 394M |
The findings show that the accuracy of all nine models on the testing set was greater than 90%, with ResNeSt101 earning the best accuracy of 98.52% with the forecast time for a single image being under 70ms. SE-ResNeXt156 had the lowest accuracy, with a score of 90.65%.
Overall, the ResneSt model performed the best on the testing set, with an accuracy of approximately 3% and 6% higher than Resnet and SE-ResneXt, respectively. Moreover, ResNet had a faster prediction time, with the fastest ResNet50 single image prediction taking only 16ms. In addition, It can be observed that ResNet’s accuracy is somewhat greater than SE-ResneXt’s. This is because the features extracted by the SE module are mostly noise [22], and partly because SE-ResneXt had the slightest decrease in loss values compared to the other two models during the training process; the accuracy obtained is lower under the same conditions. Therefore, the performance of SE-ResNeXt on the NaSC-TG2 dataset could be better..
The comparison of several depth models reveals that just increasing the depth of the model will not result in improved accuracy. On the contrary, it may lead to a decrease in the learning ability of some shallow layers. Therefore, it is imperative to grasp the depth of the model during the training process.
4.2. Comparison of ResNeSt at different depths
Table 4 shows the performance of ResNeSt at three different depths, 50, 101, and 200, on the NaSC-TG2 test set. By evaluating the Accuracy, Precision, Recall, and F1 Score, it can be seen that all three models have achieved good results.
Table 4. Evaluating results of ResNeSt.
Model | Accuracy | Precision | Recall | F1-Score | Cost Time |
ResNeSt50 | 98.30% | 98.29% | 98.30% | 98.30% | 34ms/step |
ResNeSt101 | 98.52% | 98.52% | 98.52% | 98.52% | 70ms/step |
ResNeSt200 | 98.48% | 98.48% | 98.48% | 98.48% | 158ms/step |
The accuracy, precision, recall, and F1 Score of the three models were all greater than 98%, with ResNeSt101 outperforming the others, with all evaluation indicators reaching 98.52%. Besides, the prediction time of a single image was fast as well, indicating that the model had good classification performance.
Figure 4 and figure 5 were the changes in loss and accuracy of ResNeSt with epoch during training and testing, respectively. The batch size was set at 64, with a learning rate of 0.01. It can be seen that the rate of convergence of the model was fast, and the accuracy of the three models is stable when the time is less than 20 epochs. That is to say, a good model can be obtained through transfer learning training in a short time.
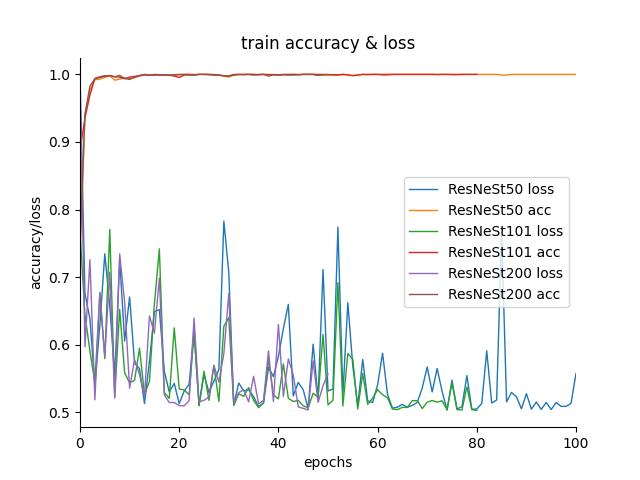
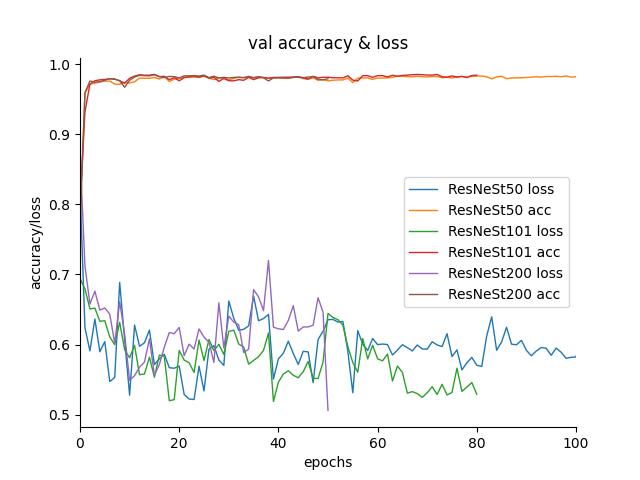
Figure 4. Loss and accuracy on training set. Figure 5. Loss and accuracy on testing set.
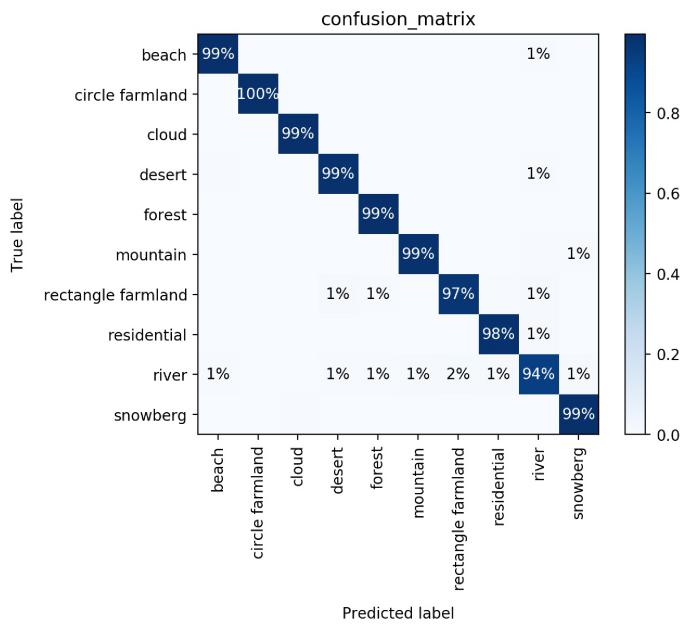
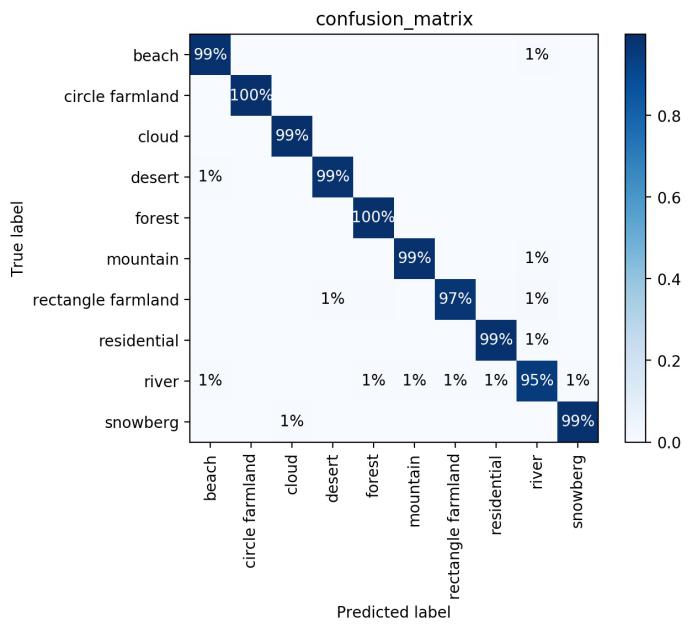
Figure 6a, figure 6b and figure 6c were respectively ResNeSt50, ResNeSt101, and ResNeSt200 Confusion matrices based on the testing set, where the abscissa was the model prediction tag, the ordinate was the real tag of the remote sensing image. The number on the Main diagonal position represented the accuracy of the model classification on different types, and the rest was the error recognition rate of the model [23].
The Confusion matrix shows that among the ResNeSt classification results for the NaSC-TG2 testing set, the results of the agricultural and forest classes were the best, with the accuracy of the three models on these classes approaching 100%; Next are the beach, cloud, desert, mountain, residential, and snowberg classes, which had basically achieved an accuracy of 99% on all three models; Then came the rectangle farmland, which achieved an accuracy of 97% on all three models; Finally was the river class, which had an accuracy of 94%, 95%, and 95% respectively on the three models. Among them, the river was mainly predicted as beach, forest, mountain, circle farmland, residential, and snowberg mistakenly, and there are also a small number of wrong predictions for other classes. And according to the Confusion matrix, the most predicted erroneous results of the other nine classes were also the river type.
It can be seen from the results that photos of the river class had high similarity with other classes and were relatively difficult to classify. It was necessary to continue to enhance the extraction of features from these classes of images to increase the classification accuracy of the river class.
(a) (b)

(c)
Figure 6. Confusion matrix of ResNeSt50, ResNeSt101 and ResNeSt200.
5. Discussion
Through the experiments, it can be concluded that ResNeSt101 can achieve good classification performance on the NaSC-TG2 dataset. The addition of the split-attention module in the ResNeSt network is precisely what has enhanced network performance to some extent.
And by comparing models at different depths, it can also be found that when selecting model depths, comparative experiments should be conducted based on the datasets that need to be classified to select the optimal model.
ResNeSt may be used as a skeleton for additional tasks such as object identification, semantic segmentation, and so on, in addition to remote sensing picture scene categorization. At the moment, models using ResNeSt as the backbone get the best performance in a wide range of tasks [24].
According to the experimental results, ResNeSt101 still has insufficient accuracy in predicting some classes of NaSC-TG2 datasets. For starters, because of issues with inter-species similarity and intra-species variety in these classes of remote sensing pictures, they are prone to being misclassified as others. By enhancing the extraction of image features, the accuracy may be improved. What’s more, optimizing the model may also improve the accuracy. Currently, there are already some optimization cases of ResNeSt networks in other fields. Wang et al. suggested a technique for detecting insulator defects based on enhanced ResNeSt and the Regional Recommendation Network (RPN). The method’s accuracy in detecting insulator defects reached 98.38%, which is higher than ResNeSt [25]. Guo et al. proposed combining the UNet++network with the ResNeSt network to create an automated classification model for chronic inflammation of the common bile duct wall, therefore providing an important foundation for classifying the degree of common bile duct inflammation in PBM patients [26]. Wang et al. present a defect detection approach based on a novel Dual-stage Attention-based Recurrent Neural Network (DARNN) and a depth residual dispersion self-calibration convolution network (SC-ResNeSt). Bearing fault sample prediction tests and subsequent bearing and gear fault diagnosis trials yielded positive results [27]. These optimization models based on ResNeSt have shown excellent results on different datasets and fields. This method can be borrowed from the natural classification of remote sensing images to improve network performance, thus playing a more significant role in the field.
6. Conclusions
The work aims to propose a new method of scene classification for the Tiangong-2 NaSC-TG2 remote sensing dataset. The experiment compared the performance of different depth models of ResNet, SE-ResNeXt, and ResNeSt on the NaSC-TG2 training set and the testing set. It ultimately concluded that the ResNeSt101 model performed best on this dataset. ResNeSt101 model achieved high accuracy and short prediction time of a single sheet on the NaSC-TG2 dataset and had a faster rate of convergence and less training time.
At present, there are still difficulties in the classification of remote sensing images, such as the similarity between some classes and the high diversity in some classes. The paper also proposed corresponding solutions. Furthermore, there is still opportunity for progress in the accuracy of remote sensing picture categorization, as well as the development of more superior models.
A novel natural scene categorization algorithm for remote sensing photos was suggested in the article. This ResNeSt101-based remote sensing image scene classification approach may serve as a reference and aid in future remote sensing image classification work. The work has produced just a few contributions to research in the field of space Earth science and applications, and future work might continue to optimize and build on this foundation.
References
[1]. Cheng G, Xie X, Han J, Guo L, and Xia G -S 2020 Remote Sensing Image Scene Classification Meets Deep Learning: Challenges, Methods, Benchmarks, and Opportunities IEEE J-STARS, vol 13, pp 3735-3756.
[2]. Xu Y, Guo W, Zhang Z and Yu W 2022 Multiple embeddings contrastive pretraining for remote sensing image classification IEEE Geosci Remote S vol 19, pp 1-5.
[3]. Hong D et al. 2021 More diverse means better: multimodal deep learning meets remote-sensing imagery classification IEEE Trans Geosci Remote Sens vol 59, no. 5, pp 4340-4354.
[4]. Alemohammad H 2020 LandCoverNet: a global benchmark land cover classification training dataset arXiv 2020.
[5]. Liu K, Zhou Z, Li S Y, Liu Y F, Wan X, Liu Z W, Tan H and Zhang W F 2020 Scene classification dataset using the Tiangong-1 hyperspectral remote sensing imagery and its applications J. Remote. Sens.(Chinese) vol 24(9), pp 1077-1087.
[6]. Zhou Z et al. 2021 NaSC-TG2: natural scene classification with Tiangong-2 remotely sensed imagery IEEE J-STARS vol 14, pp 3228-3242.
[7]. Song J, Gao S H, Zhu Y Q and Ma C Y 2019 A survey of remote sensing image classification based on CNNs Big Earth Data, 3:3, pp 232-254.
[8]. Bazi Y, Bashmal L, Rahhal M M A, Dayil R A and Ajlan NA 2021 Vision transformers for remote sensing image classification Remote Sensing 13 vol 3, p 516.
[9]. Kumari M and Kaul A 2023 Deep learning techniques for remote sensing image scene classification: a comprehensive review, current challenges, and future directions CONCURR COMP-PRACT E 2023; e7733.
[10]. Singh A and Bruzzone L 2022 WIANet: a wavelet-inspired attention-based convolution neural network for land cover classification IEEE Geosci Remote S vol 20, pp 1-5.
[11]. Jing W, Zhang X, Wang J, Di D, Chen G and Song H 2022 Binary neural network for multispectral image classification IEEE Geosci Remote S vol 19, pp 1-5.
[12]. Liu H, Qu Y and Zhang L 2022 Multispectral scene classification via cross-modal knowledge distillation IEEE Trans Geosci Remote Sens vol 60, pp 1-12.
[13]. Wang X, Xu H, Yuan L and Wen X 2023 A lightweight and stochastic depth residual attention network for remote sensing scene classification IET Image Processing (2023).
[14]. Liu Z, Dong A, Yu J, Han Y, Zhou Y, and Zhao K 2022 Scene classification for remote sensing images with self‐attention augmented CNN IET Image Processing vol 16(11), pp 3085-3096.
[15]. Chen Q, Wu Y, Wang X, Jiang Z L, Zhang W, Liu Y and Alazab M 2023 A generic cryptographic deep-learning inference platform for remote sensing scenes IEEE Journal of Selected Topics in Applied Earth Observations and Remote Sensing vol 16, pp3309-3321.
[16]. Tao C, Qi J, Zhang G, Zhu Q, Lu W, and Li H 2023 TOV: the original vision model for optical remote sensing image understanding via self-supervised learning IEEE Journal of Selected Topics in Applied Earth Observations and Remote Sensing vol 16, pp 4916-4930.
[17]. Akhtar M, Murtza I, Adnan M, and Saadia A 2023 Cross-Domain transfer learning for natural scene classification of remote-sensing imagery Applied Sciences vol 13(13), p 7882.
[18]. He K, Zhang X, Ren S and Sun J 2016 Deep residual learning for image recognition 2016 IEEE Conf. on CVPR Las Vegas, NV, USA pp 770-778.
[19]. Hu, Jie, Li S, and Gang S 2018 Squeeze-and-excitation networks Proc. of the IEEE Conf. on CVPR, Salt Lake City, UT, USA, pp. 7132-7141.
[20]. Zhang H, Wu C, Zhang Z, Zhu Y, Lin H, Zhang Z, ... and Smola A 2022 ResNeSt: split-attention networks Proc. of the IEEE/CVF Conf. on CVPR pp 2736-2746.
[21]. Yang J, Liao C, Guo C and Tang X 2021 Lithology identification based on ResNeSt in high-resolution rock images 2021 4th Int. Conf. on ICICSP, Shanghai, China, pp 415-419.
[22]. Bai X G, Liu C Z, Han J Y, Gao J M, Chen J K 2023 Classification method of small sample apple leaves based on SE-ResNeXt Computer and Modernization vol 0(01), pp 18-23.
[23]. Confusion matrix 2019, Devopedia, https://devopedia.org/confusion-matrix
[24]. Kong T L, Ping A, Tang J Q and Mo W Y 2021 Birdcall identification and prediction based on ResNeSt model 2021 IEEE 21st ICCT, Tianjin, China, pp 1277-1279.
[25]. Wang S, Liu Y, Qing Y, Wang C, Lan T and Yao R 2020 Detection of insulator defects with improved ResNeSt and region proposal network IEEE Access vol 8, pp 184841-184850.
[26]. Guo W L, Geng A K, Geng C, Wang J, and Dai Y K 2022 Combination of UNet++ and ResNeSt to classify chronic inflammation of the choledochal cystic wall in patients with pancreaticobiliary maljunction Br. J. Radiol 2022 PMID: 35451311.
[27]. Wang H, Guo Y, Liu X, Yang J, Zhang X and Shi L 2023 Fault diagnosis method for imbalanced data of rotating machinery based on time domain signal prediction and SC-ResNeSt IEEE Access vol 11, pp 38875-38893.
Cite this article
Yang,Z. (2024). Remote sensing image scene classification based on ResNeSt. Applied and Computational Engineering,45,53-62.
Data availability
The datasets used and/or analyzed during the current study will be available from the authors upon reasonable request.
Disclaimer/Publisher's Note
The statements, opinions and data contained in all publications are solely those of the individual author(s) and contributor(s) and not of EWA Publishing and/or the editor(s). EWA Publishing and/or the editor(s) disclaim responsibility for any injury to people or property resulting from any ideas, methods, instructions or products referred to in the content.
About volume
Volume title: Proceedings of the 4th International Conference on Signal Processing and Machine Learning
© 2024 by the author(s). Licensee EWA Publishing, Oxford, UK. This article is an open access article distributed under the terms and
conditions of the Creative Commons Attribution (CC BY) license. Authors who
publish this series agree to the following terms:
1. Authors retain copyright and grant the series right of first publication with the work simultaneously licensed under a Creative Commons
Attribution License that allows others to share the work with an acknowledgment of the work's authorship and initial publication in this
series.
2. Authors are able to enter into separate, additional contractual arrangements for the non-exclusive distribution of the series's published
version of the work (e.g., post it to an institutional repository or publish it in a book), with an acknowledgment of its initial
publication in this series.
3. Authors are permitted and encouraged to post their work online (e.g., in institutional repositories or on their website) prior to and
during the submission process, as it can lead to productive exchanges, as well as earlier and greater citation of published work (See
Open access policy for details).
References
[1]. Cheng G, Xie X, Han J, Guo L, and Xia G -S 2020 Remote Sensing Image Scene Classification Meets Deep Learning: Challenges, Methods, Benchmarks, and Opportunities IEEE J-STARS, vol 13, pp 3735-3756.
[2]. Xu Y, Guo W, Zhang Z and Yu W 2022 Multiple embeddings contrastive pretraining for remote sensing image classification IEEE Geosci Remote S vol 19, pp 1-5.
[3]. Hong D et al. 2021 More diverse means better: multimodal deep learning meets remote-sensing imagery classification IEEE Trans Geosci Remote Sens vol 59, no. 5, pp 4340-4354.
[4]. Alemohammad H 2020 LandCoverNet: a global benchmark land cover classification training dataset arXiv 2020.
[5]. Liu K, Zhou Z, Li S Y, Liu Y F, Wan X, Liu Z W, Tan H and Zhang W F 2020 Scene classification dataset using the Tiangong-1 hyperspectral remote sensing imagery and its applications J. Remote. Sens.(Chinese) vol 24(9), pp 1077-1087.
[6]. Zhou Z et al. 2021 NaSC-TG2: natural scene classification with Tiangong-2 remotely sensed imagery IEEE J-STARS vol 14, pp 3228-3242.
[7]. Song J, Gao S H, Zhu Y Q and Ma C Y 2019 A survey of remote sensing image classification based on CNNs Big Earth Data, 3:3, pp 232-254.
[8]. Bazi Y, Bashmal L, Rahhal M M A, Dayil R A and Ajlan NA 2021 Vision transformers for remote sensing image classification Remote Sensing 13 vol 3, p 516.
[9]. Kumari M and Kaul A 2023 Deep learning techniques for remote sensing image scene classification: a comprehensive review, current challenges, and future directions CONCURR COMP-PRACT E 2023; e7733.
[10]. Singh A and Bruzzone L 2022 WIANet: a wavelet-inspired attention-based convolution neural network for land cover classification IEEE Geosci Remote S vol 20, pp 1-5.
[11]. Jing W, Zhang X, Wang J, Di D, Chen G and Song H 2022 Binary neural network for multispectral image classification IEEE Geosci Remote S vol 19, pp 1-5.
[12]. Liu H, Qu Y and Zhang L 2022 Multispectral scene classification via cross-modal knowledge distillation IEEE Trans Geosci Remote Sens vol 60, pp 1-12.
[13]. Wang X, Xu H, Yuan L and Wen X 2023 A lightweight and stochastic depth residual attention network for remote sensing scene classification IET Image Processing (2023).
[14]. Liu Z, Dong A, Yu J, Han Y, Zhou Y, and Zhao K 2022 Scene classification for remote sensing images with self‐attention augmented CNN IET Image Processing vol 16(11), pp 3085-3096.
[15]. Chen Q, Wu Y, Wang X, Jiang Z L, Zhang W, Liu Y and Alazab M 2023 A generic cryptographic deep-learning inference platform for remote sensing scenes IEEE Journal of Selected Topics in Applied Earth Observations and Remote Sensing vol 16, pp3309-3321.
[16]. Tao C, Qi J, Zhang G, Zhu Q, Lu W, and Li H 2023 TOV: the original vision model for optical remote sensing image understanding via self-supervised learning IEEE Journal of Selected Topics in Applied Earth Observations and Remote Sensing vol 16, pp 4916-4930.
[17]. Akhtar M, Murtza I, Adnan M, and Saadia A 2023 Cross-Domain transfer learning for natural scene classification of remote-sensing imagery Applied Sciences vol 13(13), p 7882.
[18]. He K, Zhang X, Ren S and Sun J 2016 Deep residual learning for image recognition 2016 IEEE Conf. on CVPR Las Vegas, NV, USA pp 770-778.
[19]. Hu, Jie, Li S, and Gang S 2018 Squeeze-and-excitation networks Proc. of the IEEE Conf. on CVPR, Salt Lake City, UT, USA, pp. 7132-7141.
[20]. Zhang H, Wu C, Zhang Z, Zhu Y, Lin H, Zhang Z, ... and Smola A 2022 ResNeSt: split-attention networks Proc. of the IEEE/CVF Conf. on CVPR pp 2736-2746.
[21]. Yang J, Liao C, Guo C and Tang X 2021 Lithology identification based on ResNeSt in high-resolution rock images 2021 4th Int. Conf. on ICICSP, Shanghai, China, pp 415-419.
[22]. Bai X G, Liu C Z, Han J Y, Gao J M, Chen J K 2023 Classification method of small sample apple leaves based on SE-ResNeXt Computer and Modernization vol 0(01), pp 18-23.
[23]. Confusion matrix 2019, Devopedia, https://devopedia.org/confusion-matrix
[24]. Kong T L, Ping A, Tang J Q and Mo W Y 2021 Birdcall identification and prediction based on ResNeSt model 2021 IEEE 21st ICCT, Tianjin, China, pp 1277-1279.
[25]. Wang S, Liu Y, Qing Y, Wang C, Lan T and Yao R 2020 Detection of insulator defects with improved ResNeSt and region proposal network IEEE Access vol 8, pp 184841-184850.
[26]. Guo W L, Geng A K, Geng C, Wang J, and Dai Y K 2022 Combination of UNet++ and ResNeSt to classify chronic inflammation of the choledochal cystic wall in patients with pancreaticobiliary maljunction Br. J. Radiol 2022 PMID: 35451311.
[27]. Wang H, Guo Y, Liu X, Yang J, Zhang X and Shi L 2023 Fault diagnosis method for imbalanced data of rotating machinery based on time domain signal prediction and SC-ResNeSt IEEE Access vol 11, pp 38875-38893.