


1. Introduction
Climate change has always been considered as a hot topic since the appearance of the two industrial revolutions. From the technology perspective, it is a huge improvement for human society from the revolutions. However, the natural environment also suffers from this leap change and climate change is one of the most concerning problems. Among all the climate change factors, greenhouse gas is one of the most controversial problems and about 75% of global greenhouse gases consist of CO2 [1]. Besides, these gases never get dissolved and could remain in the atmosphere for over thousands of years. This situation makes more and more researchers move their attention on CO2 emissions and get to put more efforts on relevant study. There have been various climate changes in the recent decades and global warming is the most influential and concerning one that has led to many problems. In 2022, Liu et al. reported that the global CO2 emissions in 2021 has increased approximately by 4.8% compared to that in 2020 [2]. This change cuts the carbon budget for limiting the increase of global temperature by 8.4%. There are many natural disasters resulted from this change. One of the effects caused by global warming is heating. It may seem that heating does not have too many negative sides compared to other natural disasters, however, heating has a more direct impact on humans’ activities and health. In the research conducted in Europe, researchers found that the hours of risk caused by heating during medium intensity activities have significantly increased by 106% over the past a hundred years [3]. Moreover, they raised another problem caused by heating, which is wildfire. Since wildfire could generate tons of PM2.5, in 2015-2019, they claimed that there were about 603 deaths from PM2.5 in Europe each year. In short, it can be seen that global warming is an urgency for the world to deal with.
From all these studies, it is obvious that CO2 emissions attribute various issues in direct or indirect way. Therefore, over the past 20 years, there has been a lot of research about CO2 emissions prediction from different fields of study. In 2023, Stef et al. and other fellow researchers started a study about the potential correlation between institutional quality and CO2 emissions [4]. In this study, they used the database form the World’s Bank and built four different groups of variables including natural institutional quality, energy, coeducation and macroeconomics. Then all these covariates were to construct AI models in order to predict CO2 emissions. Based on their model, they found the most causal factors that could lower CO2 emissions and policy makers utilized the results to make it into practice. There is another study focusing on the vehicle sides of CO2 emissions. Since transportation takes up most of the proportion of CO2 emissions and other pollutants [5]. A model that provides the eco-routing navigation was constructed by Zeng and his team. They used the model to find out the most eco-friendly path in order to minimize the CO2 emissions and made some progress in reduction of green-house gas in Toyota city, Japan. There are various alike studies that aim to predict CO2 emissions and help reduce the atmosphere pollution, which motivates this research about analysing the three different models on CO2 emissions prediction.
In this study, three machine learning models (regression, neural network and support vector machine) will be introduced in terms of CO2 emissions prediction and the analysis of them will also be shown. For each model description part, some basic logic of the model will be introduced and the implementation by the researchers will also be demonstrated. Besides, graphs, tables or relevant visualizations will be shown for each model. In the end, this research will provide its own limitations and future expectations with a brief conclusion. All the study’s results from other researchers will be cited formatively with references listed on the very last page.
2. Regression model
In statistics or data science fields, there are many different machine learning models for various purposes and among these models, regression model is the most basic but commonly used one. It has some subcategories, such as simple linear regression model, multi-variable regression model, logistic regression model and so on. These models are all based on some direct numerical relationship with coefficients and intercepts. That’s why regression model is usually the first choice for researchers to start their model construction. Specifically, it is also a very useful model for CO2 emissions prediction and there has been a lot of research about it. In 2023, Dr. Karakurt and Dr. Aydin initiated a study about regression model construction to predict FFCO2 (fossil fuel-related carbon dioxide) emissions in the BRICS (Brazil, the Russian Federation, India, China, South Africa) and MINT (Mexico, Indonesia, Nigeria, Turkey) countries [6]. It is a simple linear regression model with TP (total population/million), UP (urban population/million) and GDPPC (gross domestic production per capita) as its predictors and FFCO2 is the response variable. Since there are countries that the researchers couldn’t get the access to their GDPPC or UP data from, some of the models are reduced model (fewer predictors than the full model). There is a table that shows the contribution rates of each predictor and analyses how significant they are in terms of FFCO2 emissions prediction.
As can be seen from Table 1, for different country, these variables have different contribution rates for the prediction. In general, in most countries, urban population has more effect on the FFCO2 emissions amount and GDP per capita has a relatively less impact based on the results. Besides, Karakurt and Aydin also calculated the R2 value for each model, which is a very commonly-used indicator to show the accuracy of statistical models [6]. Based on their computations, all of their models have a R2 value between 0.9 and 1, which means these models are highly accurate on FFCO2 emissions predictions. In a more practical side of the study, the regression model predicts that the total emissions of FFCO2 in BRICS countries will reach 27515 million tons in 2045 and among these BRICS and MINT countries, India is expected to have a 176% increase of FFCO2 emissions from 2020 amount. Interestingly, there will be an approximate 20.5% decrease of FFCO2 emissions in the Russian Federation compared to 2020. These predictions provide policy makers some helpful insights and they could potentially benefit environmental policies plan accordingly. In general, linear regression model is efficient and relatively reliable when it comes to prediction problems, but it also has some limitations like the ignoration of potential non-linear relationship and highly dependency on the original data distribution, which could be the reason why that most researchers only use it as the baseline model of their study process.
Table 1. Contribution rates of each predictor of the model for the selected countries
Predictors | Brazil | Russia | India | China | South Africa | Mexico | Indonesia | Nigeria | Turkey |
Total population | 46.42 | 60 | 39.79 | 26.60 | 39.69 | 65.00 | 23.12 | 39.16 | 72.28 |
Urban population | 50.84 | - | 60.21 | 64.53 | 60.31 | - | 73.66 | 60.84 | - |
GDP per capita | 2.74 | 40 | - | 8.87 | - | 35.00 | 3.22 | - | 27.72 |
3. Neural network model
As mentioned in the previous part, simple linear regression model does not have the ability to address potential non-linear or non-stationary data relationship. Therefore, neural network model could play a crucial part in this kind of scenario. In terms of the model logic, neural network model works like a human brain which has thousands of “neurons” and they connect with each other. It usually has three main parts: input layer, hidden layers and output layers. Each unit in the model is linked with connection strength. Whenever the model receives some information in its input layer, it will pass the data into the next layer and make predictions. If the results are incorrect, the connection strength will change, and this process will repeat until the prediction satisfies the terminating requirement. Therefore, most data scientists nowadays prefer to use neural network model to make predictions due to its solid flexibility and reliability.
Undoubtfully, neural network model has a wide use on statistical predictions and there have been countless number of CO2 emissions prediction using neural network model in the past decades. In 2021, Jena et al. and his colleagues conducted research on forecasting CO2 emissions worldwide by neural network model [7]. Specifically, they used a very typical type of neural network model called MLANN (multilayer artificial neural network) focusing on purely non-linear data. In order to evaluate their model performance later, they tried three different ways of training-testing set split: 7:3, 8:2 and 9:1. Like other machine learning prediction models on CO2 emissions, they chose GDP, trade ratio and urban population as the predictors and then built the model on the training set. Besides, they evaluated their model prediction accuracy by computing MAPE (mean absolute percentage error), MAE (mean absolute error) and RMSE (root mean squared error) on the testing set and made the terminating requirement as reaching the minimum of all these values.
MAPE = \( \frac{1}{n} \sum _{i=1}^{n}\frac{|t(n)-est(n)|}{t(n)}×100 \) (1)
MAE = \( \frac{1}{n} \sum _{i=1}^{n}|t(n)-est(n)| \) (2)
RMSE = sqrt( \( \frac{1}{n} \sum _{i=1}^{n}{(t(n)-est(n))^{2}} \) ) (3)
After the model construction, Jena et al. used it to predict the future CO2 emissions in some countries and made a line graph to demonstrate the changing pattern. Most countries have a clear increasing pattern of CO2 emissions and China has the most substantial increase, which is from about 3,000,000 kt in 1990 to almost 10,500,000 kt in 2019. However, some countries such as the United States and Japan have been experienced a decrease amount of CO2 emissions since 2010. This result provides policy makers from different countries with some useful guidance: for example, in China, the government has already started the plan to use clean energy (wind, solar and so on) to gradually replace some energy that could generate more harmful pollutants [6]. It can be shown that neural network model has many advantages compared to other machine learning models and it is widely used by many researchers for different purposes. However, it also has its own limitations. Since the model uses its “hidden layers” to process the input and generates the prediction results, it cannot provide enough information and explanation about how does the prediction was made. In other words, it is not as transparent as linear regression model where the relation between each variable is clearly shown by numerical correlation or other connections. However, if the focus of research is more on the consequence side, neural network model could be one of the most reliable tools.
4. SVM
In addition to the two models shown in the previous part, there is another powerful machine learning model called support vector machine (SVM). It was first motivated by Cortes and Vapnik in 1995 and has become a widely use statistical model for different purpose. Simply speaking, support vector machine is a kind of supervised learning model that uses data to implement classification and regression, where the input predictors are used to build a “hyperplane” and SVM will find the best plane that will separate each class most. In this way, the model will output the most significant predictors and help make a better prediction. Although it was firstly used to make data classification (prediction of categorical variables), then there are some developments of this model and it can also be used to predict numerical variables. Especially in environmental science, where there are too many complex factors affecting the target variable, SVM has played a very important part. In 2016, Liu and Sun conducted a study using least square support vector machine (LSSVM) to predict industrial and residential CO2 emissions in China [8]. LSSVM is one of the support vector machine models that is mainly used to predict. Unlike traditional SVM model with inequality constraint, LSSVM uses equal constraint to make optimization problem into linear equations solving through Kuhn-Tucker conditions. In order to make a more rigorous and standard model, all the energy consumption values in this research were converted into standard coal using the basis of conversion coefficient shown in Table 2.
Table 2. CO2 emissions conversion coefficient into standard coal
Energy species | CO2 emissions conversion coefficient (C/(t/t)) | Energy species | CO2 emissions conversion coefficient (C/(t/t)) |
Coal | 0.747 | Diesel | 0.592 |
Coke | 0.855 | Fuel | 0.618 |
Crude oil | 0.585 | Natural gas | 0.448 |
Gasoline | 0.553 | Power | 1.814 |
Kerosene | 0.571 |
Besides, similar to other machine learning model study, the evaluation is also shown by calculating RMSE, MAPE (mean absolute percentage error), MaxAPE (maximum absolute percentage error) and MdAPE (median absolute percentage error). Moreover, in order to show the advantage of LSSVM, the researcher collected performance evaluation of other models on the same dataset.
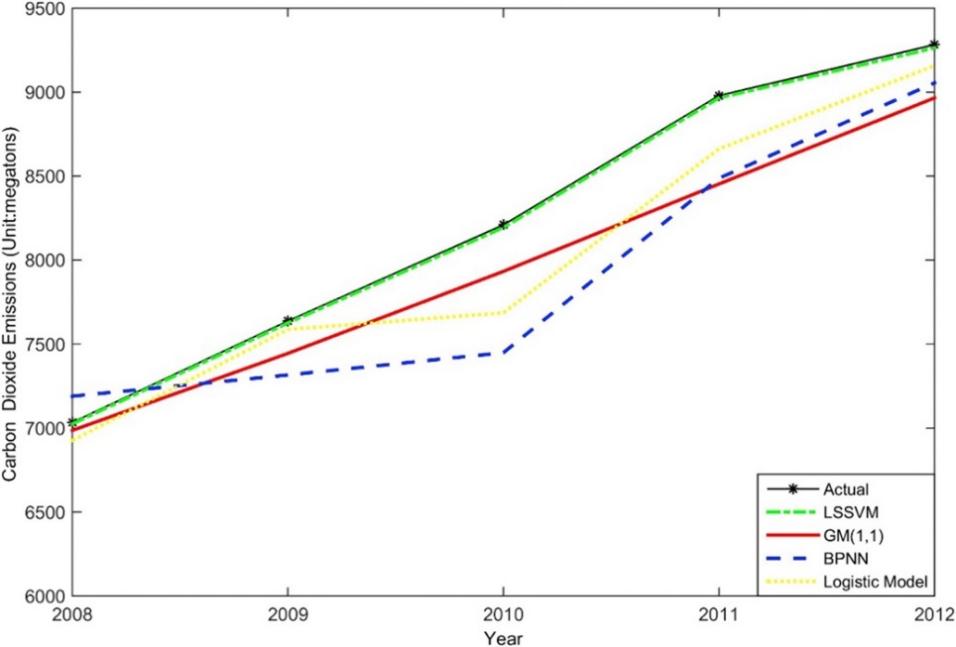
Figure 1. Prediction results from LSSVM model of CO2 emissions [9].
Seen from Fig. 1, among all these prediction models, LSSVM can generate the results that are closest to the actual values, which shows its reliability and accuracy in CO2 emissions prediction. At the same time, the model also gives the researchers some insights that implementing classification can improve the accuracy of CO2 prediction model and China should put more effort on increasing energy efficiency in order to lower CO2 emissions. In general, support vector machine model is a very accurate and versatile model to make predictions. However, it also has some limitations. For example, since it is sensitive to the original data, it is required to standardize the data in order to get a better result. This will potentially increase the cost of time and money. When a huge dataset is given to a SVM model, it is computationally expensive due to its unique algorithm logic [9].
5. Limitations and prospects
In general, it can be seen that all these machine learning models have their pros and cons in terms of CO2 emissions prediction. For linear regression models, its simplicity and convenience are undoubtfully one of the best among other models, which is the reason why that so many researchers use it to start up their project to get some basic relationship between data. However, this simplicity also brings problems: sometimes it will ignore the potential non-linear relationship or other important features of the variables. Artificial neural network model solves this problem by “reviewing” what it has done to the data and improves its next prediction. Therefore, it will provide a more accurate and reliable results due to its relative complexity, but the transparency of the model is so much lower than the others, which could be a big issue for some specific research.
Support vector machine is more in the middle of the two models. It uses some basic mathematic algorithm in its calculation and combine it with some “layer process” like neural network models. Namely, SVM model could give us a transparent and accurate result without making the model too complex. However, it also has some inevitable shortcomings. As mentioned in the previous part, SVM model requires highly standardized data, which means the “sound” within the input data will largely affect its performance. In addition, when it comes to a large size dataset, SVM will become computationally expensive and very inefficient. Although these models have some limitations, they still have a very promising future application in terms of CO2 emissions prediction. There is much more research about this topic using different models. According to a study conducted in China, USA and India, the machine learning models have made a lot of progress on CO2 emissions prediction [10]. They suggest that policy makers already made some policies like energy conservation policy, deployment policies to encourage low-carbon energy and sustainable principles. Also, researchers indicate that with the increasing number of applications of machine learning on CO2 emissions prediction, the global environment is expected to get better and better in a soon future.
6. Conclusion
In conclusion, machine learning models have made a huge contribution on CO2 emissions prediction. Specifically, regression model, artificial neural network and support vector machine play a crucial role in this field and they all made some contributions to help reduce global CO2 emissions in various ways. Although it still leaves some challenges to the current study (limited access of data from some specific areas, changeable environment situation and high costs), researcher still made tons of incredible progress on CO2 emissions prediction. Moreover, these notable achievements will encourage more and more scientists from different fields of study to engage in the CO2 emissions prediction work and make the world better.
References
[1]. Hanif I 2018 Impact of fossil fuels energy consumption, energy policies, and urban sprawl on carbon emissions in East Asia and the Pacific: A panel investigation. Energy strategy reviews vol 21 pp 16-24.
[2]. Liu Z, Deng Z, Davis S J, Giron C and Ciais P 2022 Monitoring global carbon emissions in 2021. Nature Reviews Earth & Environment vol 3(4) pp 217-219.
[3]. van Daalen K R, Romanello M, Rocklöv J, Semenza J C, Tonne C, Markandya A and Lowe R 2022 The 2022 Europe report of the Lancet Countdown on health and climate change: towards a climate resilient future. The Lancet Public Health vol 7(11) p e942-e965.
[4]. Stef N, Başağaoğlu H, Chakraborty D and Jabeur S B 2023 Does institutional quality affect CO2 emissions? Evidence from explainable artificial intelligence models. Energy Economics p 106822.
[5]. Zeng W, Miwa T and Morikawa T 2016 Prediction of vehicle CO2 emission and its application to eco-routing navigation. Transportation Research Part C: Emerging Technologies vol 68 pp 194-214.
[6]. Karakurt I and Aydin G 2023 Development of regression models to forecast the CO2 emissions from fossil fuels in the BRICS and MINT countries. Energy vol 263 p 125650.
[7]. Jena P R, Managi S and Majhi B 2021 Forecasting the CO2 emissions at the global level: A multilayer artificial neural network modelling. Energies vol 14(19) p 6336.
[8]. Sun W and Liu M 2016 Prediction and analysis of the three major industries and residential consumption CO2 emissions based on least squares support vector machine in China. Journal of Cleaner Production vol 122 pp 144-153.
[9]. Suthaharan S 2016 Support vector machine. Machine learning models and algorithms for big data classification: thinking with examples for effective learning pp 207-235.
[10]. Magazzino C, Mele M and Schneider N 2021 A machine learning approach on the relationship among solar and wind energy production, coal consumption, GDP, and CO2 emissions. Renewable Energy vol 167 pp 99-115.
Cite this article
Liu,X. (2024). CO2 emissions prediction based on regression, neural network and SVM. Applied and Computational Engineering,54,98-103.
Data availability
The datasets used and/or analyzed during the current study will be available from the authors upon reasonable request.
Disclaimer/Publisher's Note
The statements, opinions and data contained in all publications are solely those of the individual author(s) and contributor(s) and not of EWA Publishing and/or the editor(s). EWA Publishing and/or the editor(s) disclaim responsibility for any injury to people or property resulting from any ideas, methods, instructions or products referred to in the content.
About volume
Volume title: Proceedings of the 4th International Conference on Signal Processing and Machine Learning
© 2024 by the author(s). Licensee EWA Publishing, Oxford, UK. This article is an open access article distributed under the terms and
conditions of the Creative Commons Attribution (CC BY) license. Authors who
publish this series agree to the following terms:
1. Authors retain copyright and grant the series right of first publication with the work simultaneously licensed under a Creative Commons
Attribution License that allows others to share the work with an acknowledgment of the work's authorship and initial publication in this
series.
2. Authors are able to enter into separate, additional contractual arrangements for the non-exclusive distribution of the series's published
version of the work (e.g., post it to an institutional repository or publish it in a book), with an acknowledgment of its initial
publication in this series.
3. Authors are permitted and encouraged to post their work online (e.g., in institutional repositories or on their website) prior to and
during the submission process, as it can lead to productive exchanges, as well as earlier and greater citation of published work (See
Open access policy for details).
References
[1]. Hanif I 2018 Impact of fossil fuels energy consumption, energy policies, and urban sprawl on carbon emissions in East Asia and the Pacific: A panel investigation. Energy strategy reviews vol 21 pp 16-24.
[2]. Liu Z, Deng Z, Davis S J, Giron C and Ciais P 2022 Monitoring global carbon emissions in 2021. Nature Reviews Earth & Environment vol 3(4) pp 217-219.
[3]. van Daalen K R, Romanello M, Rocklöv J, Semenza J C, Tonne C, Markandya A and Lowe R 2022 The 2022 Europe report of the Lancet Countdown on health and climate change: towards a climate resilient future. The Lancet Public Health vol 7(11) p e942-e965.
[4]. Stef N, Başağaoğlu H, Chakraborty D and Jabeur S B 2023 Does institutional quality affect CO2 emissions? Evidence from explainable artificial intelligence models. Energy Economics p 106822.
[5]. Zeng W, Miwa T and Morikawa T 2016 Prediction of vehicle CO2 emission and its application to eco-routing navigation. Transportation Research Part C: Emerging Technologies vol 68 pp 194-214.
[6]. Karakurt I and Aydin G 2023 Development of regression models to forecast the CO2 emissions from fossil fuels in the BRICS and MINT countries. Energy vol 263 p 125650.
[7]. Jena P R, Managi S and Majhi B 2021 Forecasting the CO2 emissions at the global level: A multilayer artificial neural network modelling. Energies vol 14(19) p 6336.
[8]. Sun W and Liu M 2016 Prediction and analysis of the three major industries and residential consumption CO2 emissions based on least squares support vector machine in China. Journal of Cleaner Production vol 122 pp 144-153.
[9]. Suthaharan S 2016 Support vector machine. Machine learning models and algorithms for big data classification: thinking with examples for effective learning pp 207-235.
[10]. Magazzino C, Mele M and Schneider N 2021 A machine learning approach on the relationship among solar and wind energy production, coal consumption, GDP, and CO2 emissions. Renewable Energy vol 167 pp 99-115.