


1. Introduction
Diabetes mellitus, often simply called diabetes, is a persistent health issue that influences how one’s body transforms food into energy. It has become a global health concern, affecting millions of people all over the world. Diabetic can have a lot of symptoms, including unexplained weight loss, Persistent tiredness, irritability, recurring infections particularly in the genital areas, urinary tract, skin, and oral cavity, delayed wound healing, a dry mouth, itching, episodes of low blood sugar, and diminished vision, impotence or erectile dysfunction, etc. [1]. This kind of disease is more common among the elderly. Diabetes puts a heavy burden on the health care system. Effective prevention and early diagnosis are also important for complications such as cardiovascular diseases, kidney failure, and blindness [2]. Additionally, according to WHO, the global population is aging rapidly. The global population aged over 60 is expected to nearly double, increasing from 12% to 22% between the years 2015 and 2050. Meanwhile, diabetes and age are highly correlated, people with the most diabetes are between the ages of 40 and 59 [3]. Therefore, it is urgent to know how to prevent diabetes correctly.
In recent years, machine learning is more and more widely used in various fields. The healthcare industry also witnessed its rapid development [4-6]. Specifically, it helps to diagnose and prevent various diseases. Analytical models have the capacity to forecast the likelihood of diabetes onset and progression, facilitating early interventions. This predictive capability holds substantial promise for enhancing patient outcomes. Moreover, predicting diabetes can address global health disparity to some extent. Diabetes prevalence exhibits significant disparities across geographical regions and diverse populations, underscoring global health inequalities. Research endeavours in diabetes analysis can play a pivotal role in mitigating these disparities and guiding the formulation of strategies for equitable healthcare provision [7]. Decision trees, logistic regression, and neural networks show good prospects in analysing complex medical dataset and offering valuable insights in disease prediction [4]. Thus, this study will introduce these three ways to estimate the probability of diabetes onset using 12 variables. Tree decision is a hierarchical structure similar to an upside-down tree with a few branches. Each node represents the result of a test with an input. The leaves of the decision tree contain the final prediction or classification [5]. It is known for its ability to handle categorical variables and continuous variables, making them interrelated and easily to be interpreted. The study conducted by Jarullah and colleagues in 2011 showed the capability of decision tree in successfully identifying high-risk individuals and accurately categorizing patients with diabetes [8]. Logistic regression is a popular statistical technique employed to analyse the association between dependent and independent variables. It is a classification algorithm and majorly used for predicting the possibility of predicting that an observation belongs to a particular category, which is well suited for this analysis [6]. The Logistic Regression model plays an important role in diabetes investigation. Research, made by Tabaei and Herman, employed Logistic Regression to create and verify a practical formula for diabetes screening [9]. Artificial Neural Network (ANN) is another technique of machine learning, known for its high accuracy and good performance [4]. It consists of layers of artificial neurons (also known as nodes) that process data. It is worth noting that artificial neural networks, especially deep architectures, have shown potential in capturing complex connections within diabetes data. In a study led by Miotto et al., deep neural networks were employed to generate patient representations that enhance clinical predictions [10].
The motivation for this study comes from the urgent need to address the global diabetes epidemic effectively. With the increasing aging of the population, diabetes will become a major disaster area of elderly diseases. To prevent such a rise in the number of diabetics, it is significant to diagnose accurately and early, precisely assess, and effectively manage the diabetes of individuals, and these processes also play an important role in the healthcare system worldwide.
Table 1. Variable descriptions.
Attribute | Description |
Pregnant | total number of pregnancies the patient has had |
Plasma-Glucose | Two-hour oral glucose tolerance test measurement indicating the concentration of plasma glucose (mm Hg). |
Diastolic BP | Diastolic blood pressure |
Triceps SFT | Measurement of the thickness of the skin fold at the triceps (mm). |
Serum—Insulin | Insulin levels measured in the serum two hours post glucose intake (muU/ml) |
BMI | Body mass index(weight Kg/height in (mm)2 |
DPF | Diabetes pedigree function |
Age | Age of the patient (years) |
Outcome | Onset of diabetes within a five-year period |
2. Data and method
This study used the Pima Indians Diabetes Database. Since this research paper intends to compare the effectiveness of different models. A well-known dataset in the field of diabetes research and machine learning, the Pima Indians Diabetes Database has been selected, because this dataset is a common benchmark in this field. It was initially gathered by the National Institute of Diabetes and Digestive and Kidney Diseases (NIDDK). and is named after the Pima Indians, a Native American community residing in the southwestern United States [11]. This dataset is commonly used for exploring and developing predictive models for diabetes. There are 8 predictor variables and one target variable, outcome, in this dataset, The predictor variables play a crucial role in determining the likelihood of diabetes in patients. Each variable brings unique insight into the patient's overall health and specific risk factors associated with diabetes. The predictor variables contain the number of pregnancies the patient has had,their BMI, insulin level, age, glucose level, blood pressure, skin thickness, and diabetes pedigree function. Table 1 exhibits the details of these variables.
Decision Tree does not require feature normalization because of its decision-making process, decision tree employs binary choices at each node, relying on the individual feature values. And these decisions are typically based on simple thresholding or splits. However, other preprocessing steps, such as handling missing values, dealing with categorical variables are still necessary for building an effective tree decision model. The dataset in this study contains instances of missing values, marked as 0, in several attributes, including pregnancies, glucose, blood pressure, skin thickness, and insulin, as detailed in Table 2. Addressing these missing values involves three common strategies. The first approach requires the elimination of all records containing missing values in any particular attribute, an approach that, while simple, has the risks of excluding potentially important patient data. The second strategy involves the replacement of each missing value with the mean value of its respective attribute. However, this technique might lead to the introduction of bias within the dataset. The third option employs the K-nearest neighbor method, where each missing value is substituted with a value from a similar data point, determined by the Euclidean distance. Like the mean replacement method, this too carries a risk of instilling bias into the dataset [12]. This study used the second method, handling the missing values by substituting them with the mean of each respective variable. However, the occurrence of 0 in the variable of pregnancies will not be replaced because this research paper assumes they are real values. Besides, data normalization was used in this study when preprocessing data for Logistic Regression and Artificial Neural Network. However, A decision tree does not require normalization of data. So, data normalization was not applied in the dataset when building the Decision Trees model.
Table 2. Counts of data.
Counts of zero | Pregnant | 111 |
Counts of zero | Plasma- Glucose | 5 |
Counts of zero | Diastolic BP | 35 |
Counts of zero | Triceps SFT | 227 |
Counts of zero | Serum—Insulin | 374 |
Counts of zero | BMI | 11 |
Counts of zero | DPF | 0 |
Counts of zero | Age | 0 |
Counts of zero | Outcome | 500 |
3. Results and discussion
A decision tree serves as a flexible tool in supervised learning, applicable in both classification and regression scenarios. Characterized by a hierarchical structure, it features a root node, internal nodes, branches, and leaf nodes, mimicking the layout of a tree. Subsequently, the branches emanate from the root node, leading to internal nodes, often referred to as decision nodes. These nodes assess the available features to create homogeneous subsets, ultimately reaching leaf nodes, or terminal nodes, which describe all possible outcomes within the dataset [13]. Besides, there are three popular algorithms in decision trees, which are ID3, C4.5, and CART. This study used the CART algorithm to classify diabetics. The term “CART” stands for "classification and regression trees," a term first coined by Leo Breiman. This algorithm commonly employs Gini impurity as a metric to determine the optimal attribute for division. Gini impurity quantifies the frequency of an incorrectly classified attribute chosen at random. In assessments using Gini impurity, a smaller value is preferable [13]. Logistic Regression is a statistical technique used for forecasting binary results from data. This model fits binary classification problems very well. This method is particularly effective in scenarios like classifying emails as spam or non-spam, or determining if a tumor is malignant or benign. Of course, predicting diabetes is one of its applications. Logistic Regression calculates the possibility of an event taking place. The learning algorithm will estimate the parameters to minimize the cost function. The common algorithm used is Maximum Likelihood Estimation (MLE) [14]. Artificial Neural Networks (ANN) are inspired by the functioning of the human brain's biological neural networks, serving as computational models that simulate these intricate processes. Artificial Neural Networks (ANNs) are structured with multiple layers of nodes, consisting of an input layer, several hidden layers, and an output layer. Each node, or artificial neuron, is interconnected and characterized by a specific weight and threshold. Nodes are triggered to pass data to the next layer when their output exceeds a set threshold. If the output is below the threshold, data transmission to the following layer is halted.
All these models will be developed on a training dataset and a testing dataset. In this study, 70% of the data was allocated to the training dataset, and the remaining 30% was designated as the testing dataset. Besides, all three models will be evaluated based on the following metrics. They are accuracy, precision, recall, PR curve, F1 score, and ROC (Receiver Operating Characteristic) curve. Precision = TP/(TP+FP), Recall = TP/(TP+FN). The CART algorithm was used to build the decision tree model. The key parameter in this model is max_depth and min_samples_leaf. After multiple trials, this study set them to be appropriate values. Specifically, max_depth=5, min_samples_leaf=10. The threshold is 154.5, which means samples are splitted based on the Plasma glucose concentration. Specifically, if Plasma glucose concentration is less than 154.5, then, test their age. If age is less than 28.5, test their Plasma Glucose concentration again and so on. The values inside brackets on the leaf nodes indicate the total training instances linked to that node and the number of those instances that have been incorrectly classified. Some leaf nodes have Gini impurity of 0, which means there are no misclassified samples, all the samples are classified correctly. The accuracy rate of the decision trees model is 76.1905%.
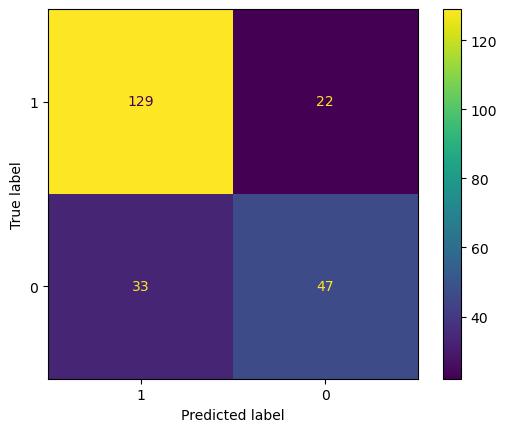
Figure 1. Confusion matrix for decision tree (Photo/Picture credit: Original).
For decision trees, The precision rate = 129/(129+33) = 79.63%, recall rate = 129/(129+22) = 85.43%. The main purpose of the model is to identify the diabetics. High precision rate applies to some conditions that require less error, and would rather miss than misclassification. While the recall rate presents the proportion of all true positive cases is predicted to be positive cases. The model performs initial screening of diabetic patients, as long as diabetes is predicted, participants should have a physical examination. In this case, recall rate is more important since the model is not strict on precision. Sometimes, both precision and recall rate are important. The Precision-Recall curve (seen from Fig. 2) is a plot of precision against recall at different threshold values. It shows the dilemma between precision and recall as the classification threshold changes. Different threshold values result in higher precision or higher recall rate. The F1 score is the harmonic mean of precision and recall. It is very helpful when a balance between these two elements is desired, the bigger the F1 score, the better. F1 score in this case is 0.6309. This value will be compared with the F1 score of other models later. An ROC curve (Receiver Operating Characteristic curve) is a visual illustration that plots the true positive rate in comparison to the false positive rate at multiple thresholds during a diagnostic assessment. And, the AUC (Area under curve) offers a scalar value that quantifies the overall ability of the test to discriminate between positive and negative outcomes. An AUC of 1.0 signifies flawless distinction between classes, while an AUC of 0.5 denotes an inability to differentiate between classes, equivalent to making random guesses. According to Figure 8, AUC is 0.7209 which can be classified as a good classifier.
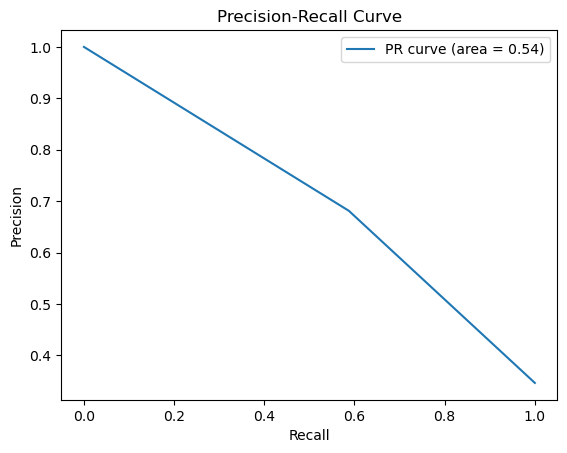
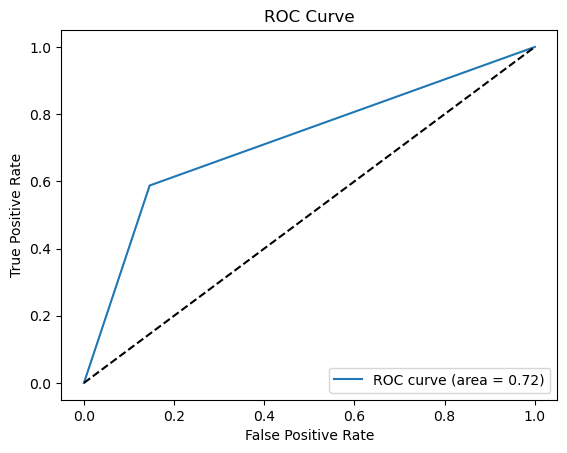
Figure 2. Precision-recall and ROC curve for decision tree (Photo/Picture credit: Original).
Figure 3. Confusion matrix for logistic regression (Photo/Picture credit: Original).
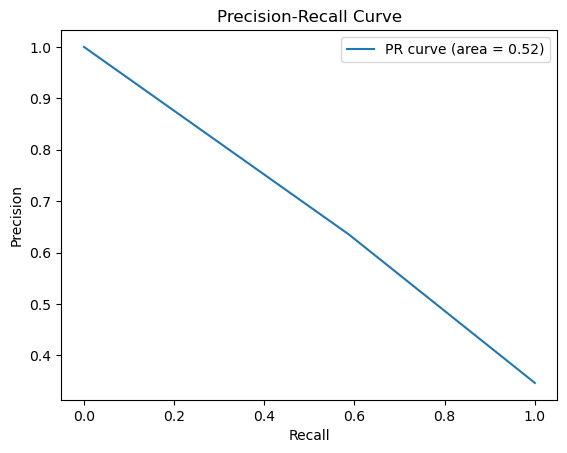
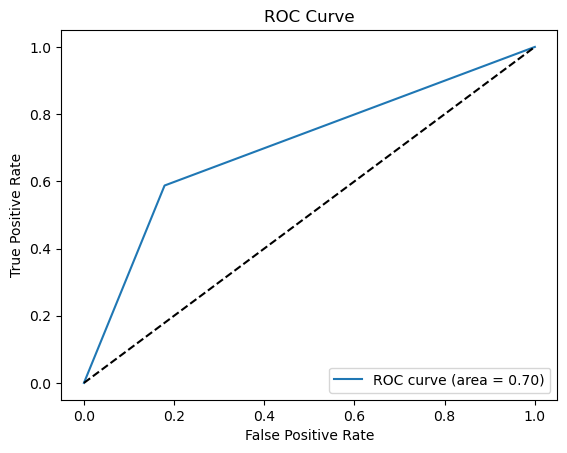
Figure 4. Precision-recall and ROC curve for logistic regression (Photo/Picture credit: Original).
The accuracy of the logistic regression model is 74.03%. Fig. 3 is the confusion matrix of the logistic regression. Accuracy rate=(124+47)/(124+27+33+47)=74.03%. For logistic regression, the precision rate = 124/(124+33) = 78.98%, recall rate = 124/(124+27) = 82.12%. Fig. 4 shows the PR curve and F1 score in logistic regression is 0.6104 as well as demonstrates the ROC curve with AUC. Area of 0.7043, which can also classify this model as a good model.
The key parameters of an Artificial Neural Network are the count of hidden layers and the quantity of nodes within each of those layers. After multiple trials, this study sets the number of hidden layers to be 2, and both layers have 32 nodes. In this case, the accuracy of the model is around 72.64%. Fig. 5 is the confusion matrix of the Artificial Neural Network. For Artificial Neural Network, The precision rate = 138/(138+52) = 72.63%, recall rate = 138/(138+13) = 91.39%. Fig. 6 shows the PR curve and F1 score in Artificial Neural Network is 0.4628 as well as demonstrates the ROC curve with AUC. Area of 0.6320, which can also classify this model as a good model.
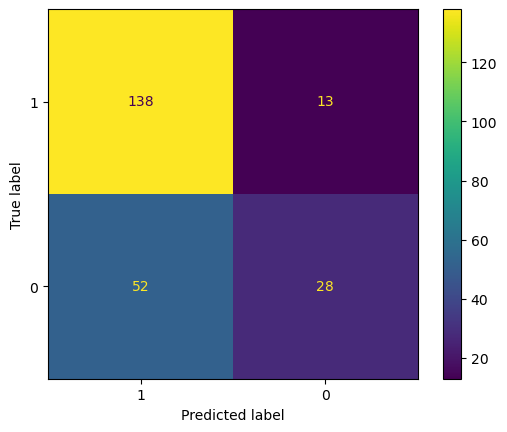
Figure 5. Confusion matrix for ANN (Photo/Picture credit: Original).
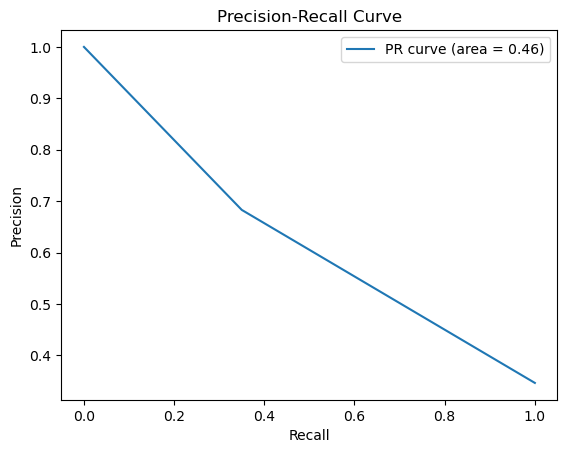
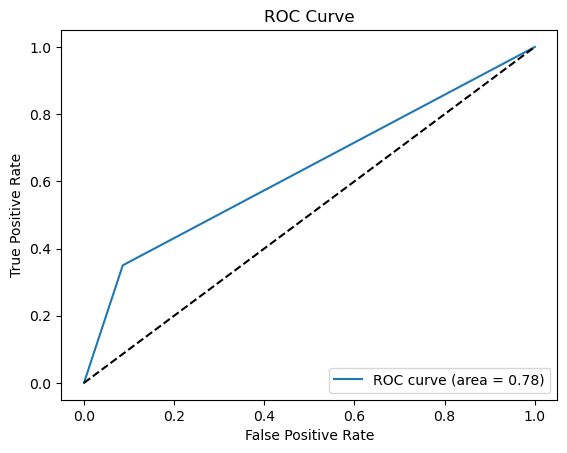
Figure 6. Precision-recall and ROC curve for ANN (Photo/Picture credit: Original).
These three models will be compared with each other based on precision, recall, F1 score, and ROC curve. According to the results:
●Accuracy: Decision Trees > Logistic Regression > Artificial Neural Network
●Precision: Decision Trees > Logistic Regression > Artificial Neural Network
●Recall: Artificial Neural Network > Decision Trees > Logistic Regression
●F1 Score: Decision Trees > Logistic Regression > Artificial Neural Network
●ROC curve (AUC): Decision Trees > Logistic Regression > Artificial Neural Network
Although Artificial Neural Network performs very well in Recall rate which is a very significant factor since this study was to identify all the diabetic patients, and the precision rate of True Positive becomes irrelevant, by all other measures, decision trees are way ahead. Thus, Decision Trees are a better model in predicting diabetic patients.
4. Limitations and prospects
This study is designed to pinpoint individuals suffering from diabetes based on specific physical data by using three different models, and find out the efficiency of different models in order to filter out the most suitable model for predicting diabetic patients. This study utilized the Pima Indian Diabetes dataset, which might overlook certain crucial risk factors, such as family history, prediabetes, gestational diabetes, ethnicity, and smoking habits. A comprehensive model should encompass a wide range of relevant data, attainable through the combination of datasets from diverse sources. This is the limitation of models built in this study. Additionally, The Pima Indians Diabetes Database contains missing values in attributes like pregnancies, glucose, blood pressure, skin thickness, and insulin. Although this research paper mentioned that these were handled by replacing them with the mean of the variable, this approach can introduce bias into the dataset. Meanwhile, as a common benchmark dataset, the results obtained might not be very indicative of the models' performance on new, unseen data or different datasets related to diabetes. Hence, using different datasets to build models and combining the results to find the most suitable model is the future research direction.
5. Conclusion
This study rigorously assesses the effectiveness of Decision Trees, Logistic Regression, and Artificial Neural Networks in predicting diabetes, offering crucial insights into their respective strengths, weaknesses, and applicability in real-world scenarios. The comparative analysis revealed the Decision Tree’s superior performance in accuracy, precision, F1 score, and ROC-AUC through an extensive evaluation of the Pima Indian diabetes database. The Artificial Neural Network excelled in recall at identifying true positive cases, a critical aspect in medical diagnoses. However, each model exhibited inherent limitations, such as parameter sensitivity in decision trees and the linear nature of logistic regression. For Decision Trees, the model's performance is highly contingent upon the choices for parameters like max_depth and min_samples_leaf. In practice, this means that different settings of these parameters can lead to varied model performances, making the tuning process crucial yet challenging. There is also an inherent trade-off between the model’s complexity and interpretability. Increasing the tree’s depth can improve its accuracy but at the expense of making the model more complex and potentially leading to overfitting, which is great at handling training data, but not as good at handling unfamiliar, unencountered data. The decision tree model is sensitive to instability, even minor changes in the data can lead to the generation of a substantially different tree structure. The prospect of improving these models lies in addressing these challenges, potentially integrating more advanced machine learning techniques and diverse, real-world datasets to enhance their predictive accuracy and reliability. The insights garnered from this study hold profound implications for the healthcare sector, particularly in the realm of diabetes management. By leveraging these machine learning models, practitioners can achieve early, accurate diagnoses, facilitating timely interventions and management strategies, ultimately contributing to enhanced patient outcomes and a reduction in the global health disparity associated with diabetes.
References
[1]. Ramachandran A. Know the signs and symptoms of diabetes. Indian J Med Res. 2014 Nov;140(5):579-81. PMID: 25579136; PMCID: PMC4311308.
[2]. American Diabetes Association; 2. Classification and Diagnosis of Diabetes: Standards of Medical Care in Diabetes—2021. Diabetes Care 1 January 2021; 44 (Supplement_1): S15–S33. https://doi.org/10.2337/dc21-S002
[3]. Zoungas, S., Woodward, M., Li, Q. et al. Impact of age, age at diagnosis and duration of diabetes on the risk of macrovascular and microvascular complications and death in type 2 diabetes. Diabetologia 57, 2465–2474 (2014). https://doi.org/10.1007/s00125-014-3369-7
[4]. Larabi-Marie-Sainte S, Aburahmah L, Almohaini R, Saba T. Current Techniques for Diabetes Prediction: Review and Case Study. Applied Sciences. 2019; 9(21):4604. https://doi.org/10.3390/app9214604
[5]. Myles A J, Feudale R N, Liu Y, Woody N A and Brown S D 2004 Journal of Chemometrics: A Journal of the Chemometrics Society vol 18(6) pp 275-285.
[6]. LaValley, P. M. (2008, May 6). Logistic regression. Logistic Regression | Circulation. https://www.ahajournals.org/doi/10.1161/CIRCULATIONAHA.106.682658
[7]. Laxy, M., Knoll, G., Schunk, M., Meisinger, C., Huth, C. and Holle, R. (2016) Quality of Diabetes Care in Germany Improved from 2000 to 2007 to 2014, But Improvements Diminished since 2007. Evidence from the Population-Based KORA Studies. PLoS ONE, 11, e0164704. https://doi.org/10.1371/journal.pone.0164704
[8]. Al Jarullah A A 2011 International Conference on Innovations in Information Technology, Abu Dhabi, pp 303-307.
[9]. Bahman P. Tabaei, William H. Herman; A Multivariate Logistic Regression Equation to Screen for Diabetes : Development and validation. Diabetes Care 1 November 2002; 25 (11): 1999–2003. https://doi.org/10.2337/diacare.25.11.1999
[10]. Miotto, R., Li, L., Kidd, B. et al. Deep Patient: An Unsupervised Representation to Predict the Future of Patients from the Electronic Health Records. Sci Rep 6, 26094 (2016). https://doi.org/10.1038/srep26094
[11]. Chang, V., Bailey, J., Xu, Q.A. et al. Pima Indians diabetes mellitus classification based on machine learning (ML) algorithms. Neural Comput & Applic 35, 16157–16173 (2023). https://doi.org/10.1007/s00521-022-07049-z
[12]. Li W, Yin H, Chen Y, et al. 2022 Frontiers in cardiovascular medicine vol 9 p 858994.
[13]. IBM. What is a decision tree. Retrieved from: https://www.ibm.com/topics/decision-trees
[14]. Kumar M and Rath S K. 2016 Emerging Trends in Computer Science and Applied Computing, Emerging Trends in Applications and Infrastructures for Computational Biology, Bioinformatics, and Systems Biology, pp 213-242.
Cite this article
Shao,Z. (2024). Analysis of diabetes based on Tree Decision, Logistic Regression and Artificial Neural Network. Applied and Computational Engineering,47,248-256.
Data availability
The datasets used and/or analyzed during the current study will be available from the authors upon reasonable request.
Disclaimer/Publisher's Note
The statements, opinions and data contained in all publications are solely those of the individual author(s) and contributor(s) and not of EWA Publishing and/or the editor(s). EWA Publishing and/or the editor(s) disclaim responsibility for any injury to people or property resulting from any ideas, methods, instructions or products referred to in the content.
About volume
Volume title: Proceedings of the 4th International Conference on Signal Processing and Machine Learning
© 2024 by the author(s). Licensee EWA Publishing, Oxford, UK. This article is an open access article distributed under the terms and
conditions of the Creative Commons Attribution (CC BY) license. Authors who
publish this series agree to the following terms:
1. Authors retain copyright and grant the series right of first publication with the work simultaneously licensed under a Creative Commons
Attribution License that allows others to share the work with an acknowledgment of the work's authorship and initial publication in this
series.
2. Authors are able to enter into separate, additional contractual arrangements for the non-exclusive distribution of the series's published
version of the work (e.g., post it to an institutional repository or publish it in a book), with an acknowledgment of its initial
publication in this series.
3. Authors are permitted and encouraged to post their work online (e.g., in institutional repositories or on their website) prior to and
during the submission process, as it can lead to productive exchanges, as well as earlier and greater citation of published work (See
Open access policy for details).
References
[1]. Ramachandran A. Know the signs and symptoms of diabetes. Indian J Med Res. 2014 Nov;140(5):579-81. PMID: 25579136; PMCID: PMC4311308.
[2]. American Diabetes Association; 2. Classification and Diagnosis of Diabetes: Standards of Medical Care in Diabetes—2021. Diabetes Care 1 January 2021; 44 (Supplement_1): S15–S33. https://doi.org/10.2337/dc21-S002
[3]. Zoungas, S., Woodward, M., Li, Q. et al. Impact of age, age at diagnosis and duration of diabetes on the risk of macrovascular and microvascular complications and death in type 2 diabetes. Diabetologia 57, 2465–2474 (2014). https://doi.org/10.1007/s00125-014-3369-7
[4]. Larabi-Marie-Sainte S, Aburahmah L, Almohaini R, Saba T. Current Techniques for Diabetes Prediction: Review and Case Study. Applied Sciences. 2019; 9(21):4604. https://doi.org/10.3390/app9214604
[5]. Myles A J, Feudale R N, Liu Y, Woody N A and Brown S D 2004 Journal of Chemometrics: A Journal of the Chemometrics Society vol 18(6) pp 275-285.
[6]. LaValley, P. M. (2008, May 6). Logistic regression. Logistic Regression | Circulation. https://www.ahajournals.org/doi/10.1161/CIRCULATIONAHA.106.682658
[7]. Laxy, M., Knoll, G., Schunk, M., Meisinger, C., Huth, C. and Holle, R. (2016) Quality of Diabetes Care in Germany Improved from 2000 to 2007 to 2014, But Improvements Diminished since 2007. Evidence from the Population-Based KORA Studies. PLoS ONE, 11, e0164704. https://doi.org/10.1371/journal.pone.0164704
[8]. Al Jarullah A A 2011 International Conference on Innovations in Information Technology, Abu Dhabi, pp 303-307.
[9]. Bahman P. Tabaei, William H. Herman; A Multivariate Logistic Regression Equation to Screen for Diabetes : Development and validation. Diabetes Care 1 November 2002; 25 (11): 1999–2003. https://doi.org/10.2337/diacare.25.11.1999
[10]. Miotto, R., Li, L., Kidd, B. et al. Deep Patient: An Unsupervised Representation to Predict the Future of Patients from the Electronic Health Records. Sci Rep 6, 26094 (2016). https://doi.org/10.1038/srep26094
[11]. Chang, V., Bailey, J., Xu, Q.A. et al. Pima Indians diabetes mellitus classification based on machine learning (ML) algorithms. Neural Comput & Applic 35, 16157–16173 (2023). https://doi.org/10.1007/s00521-022-07049-z
[12]. Li W, Yin H, Chen Y, et al. 2022 Frontiers in cardiovascular medicine vol 9 p 858994.
[13]. IBM. What is a decision tree. Retrieved from: https://www.ibm.com/topics/decision-trees
[14]. Kumar M and Rath S K. 2016 Emerging Trends in Computer Science and Applied Computing, Emerging Trends in Applications and Infrastructures for Computational Biology, Bioinformatics, and Systems Biology, pp 213-242.