


1. Introduction
Accurate stock price forecasting is essential for all investors because it directly affects their returns. Prudent investment decisions, as well as risk management, will benefit investors in a variety of ways. Correct stock projections can assist shareholders in making informed decisions about purchasing, selling, or holding shares. Forecasting accurately can help investors maximize returns while limiting portfolio risk. Thus, accurate stock price forecasts attracted a lot of attention from investors.
With the advancement of artificial intelligence in recent years, machine learning has improved its ability to predict stock values, and this is a strategy that is getting more and more popular. There are numerous types of machine learning models, each of which is suited for analyzing different sorts of data, and selecting the right one can considerably increase the accuracy of your stock price forecasts. Uber is the largest shared mobility company in the United States, offering services such as taxi, food delivery and freight transport, with operations in 70 countries and 10,500 cities around the world. As a commonly used software in everyone's daily life, its share price is also under the spotlight, which attracts a lot of investors to buy its shares, resulting in frequent stock fluctuations. Therefore, this article will investigate whether machine learning models can accurately predict Uber's share price.
2. Literature Review
As artificial intelligence gets traction, the application of machine learning for stock price prediction is becoming more prevalent. Machine learning is widely used for stock price prediction, especially in the context of COVID-19 pandemic epidemics and heightened geopolitical risks.
Numerous researchers have employed machine learning techniques to forecast stock prices thus far. Several globally renowned technology companies, like Microsoft and Apple, are regularly taken into consideration for study. Sharma employed long short-term memory (LSTM) to forecast the stock price of Microsoft Corporation in 2021. The findings of the experiment indicated that while the LSTM-predicted stock price trend was accurate, the actual value was significantly lower [1].
Torres et al. also forecast Apple's stock price for 2021 using LSTM. Using data spanning Apple's previous 21 years, the authors concluded that, in addition to its well-established, mature business model and management, Apple's sales figures have benefited from the introduction of new products or services. This has reduced implied volatility of Apple's stock and improved the predictive accuracy of the LSTM [2].
Bank of America Corp (BAC) stock price was predicted using the Random Forest Algorithm [3]. The authors found that the algorithm is very accurate and appropriate for handling vast amounts of data. JPMorgan Chase's "Machine Learning Financial Innovations" paper details a program that aims to propose trade timing and size in 2017 [4]. A variety of gathered data was fed into a machine learning system that used the Random Forest Algorithm.
Amazon's stock was predicted by Umer et al using linear regression. The results indicated that the prediction was rather close, albeit it might not be tradeable, but it did provide the researchers with a direction [5]. A linear regression model was used by Gururaj, Shriya and Ashwini to study the Coca-Cola share price in 2019. Although the data is very different, the chart indicates that the trend is correct [6].
The literature indicates that a large number of researchers will focus on the equities of financial institutions, e-commerce sites, and technology enterprises. Seldom are shares of ride-sharing apps like Uber examined. Uber, Inc. is a well-known food delivery and cab service with 110 million active users worldwide. Each person's everyday existence is intimately connected to the services offered by the organization. Therefore, the Uber corporation serves as the research target in this essay.
3. Methods
3.1. Database
Data on the Uber stock market from 10/5/2019 to 24/3/2022 was used in this study. The datasets have a total of 7 columns and 725 rows which from kaggle website. Some basic descriptive statistics are shown in the following Table.
Table 1. statistic data
Stock name | Maximum | Minimum | Mean | Standard deviation |
Uber | 63.25 | 15.96 | 39.45 | 33.66 |
According to Table 1, Uber Inc.'s stock had its peak value of 63.25 and lowest value of 15.96 between October 5, 2019, and March 24, 2022. Its mean value was 39.45, and its standard deviation was 33.66.
3.2. Data Preprocessing
For the purpose of cleaning and preparing machine learning data, data preprocessing is essential. Missing value handling, scaling or normalizing the data, and converting categorical variables into numerical representations, to name a few possible jobs.
After preprocessing, the data is separated into two groups: a test group and a training group. In this experiment, 20% of the database served as the test set and 80% of the database as the training set.
3.3. Models
Three main machine models have been used in this research, which are linear regression, random forest regressor and LSTM.
Linear regression is a supervised machine learning technique that calculates a linear connection between one or more independent features and a dependent variable. The definitions of the coefficients in a linear regression model are clear and relevant. Models of linear regression are widely used. This indicates that for predictive modeling and inference, linear regression is widely recognized. In terms of software implementations, teaching materials, and linear regression models, there is a lot of collective experience and expertise. However, because there are very few associations that can be learned and because they frequently oversimplify the complexity of reality, linear models' prediction ability is also typically not very good [7].
For machine learning regression, random forest regression is a supervised learning algorithm and bagging methodology that makes use of ensemble learning techniques. During training, a large number of decision trees are built, and the system outputs either the class pattern (classification) or the regression (average projected value) of each individual decision tree. There is no contact between the trees when they are growing since they operate in parallel in a random forest. Although Random Forest creates decision trees slowly, it is very accurate, especially when working with big volumes of data [8-9].
Analysis of sequential data, including spoken word, audio recordings, and time series, is done with recurrent neural networks (RNNs) of a particular kind called long short-term memory (LSTM). Long-term relationships in continuous data are easily captured and remembered by LSTM, which makes them ideal for applications where data has dependencies over a range of time periods. As a result, it works well for jobs like time series prediction, speech recognition, and language translation. LSTM is widely utilized in the stock market for stock price prediction and financial time series forecasting [10].
4. Experimental Results
Regarding the results of predicting the close price of uber's stock price, this paper presents the visualization in the following Figures 1-3.
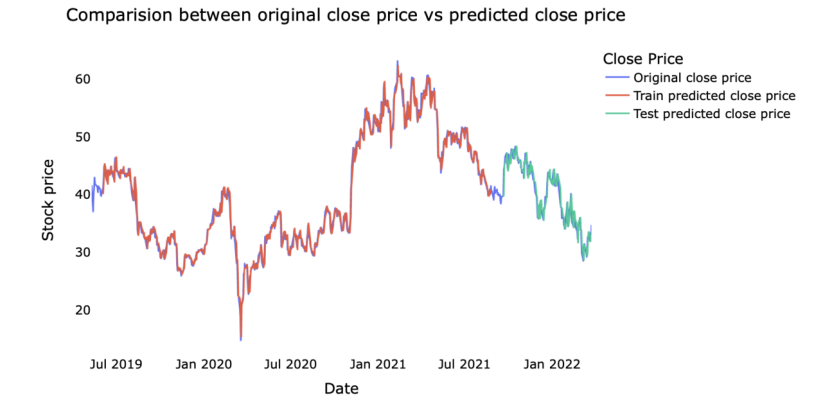
Figure 1. Prediction by linear regression
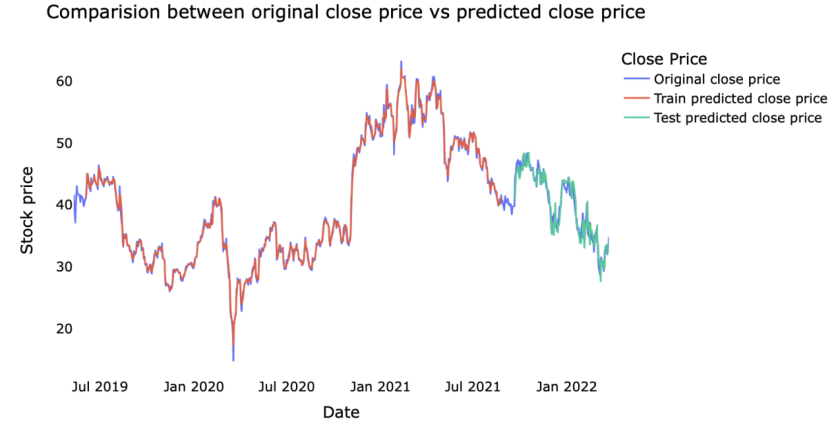
Figure 2. Prediction by random forest
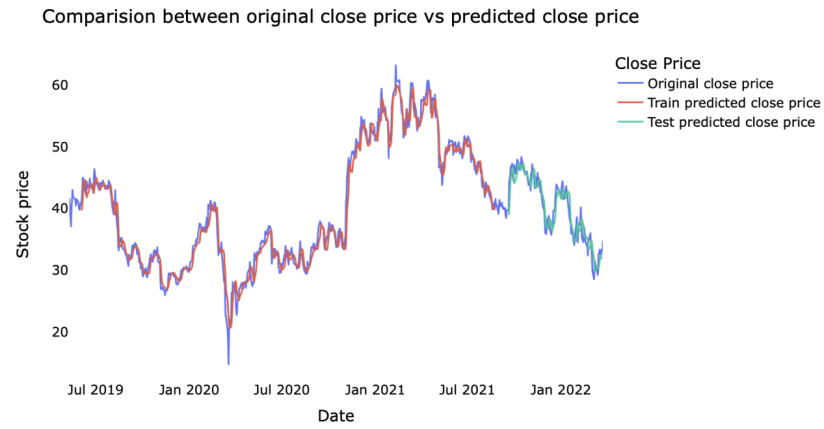
Figure 3. Prediction by LSTM
Based on the predictions, this paper calculates several indicators to compare the forecasts, and shows the results in the following Table 2. According to the result, the predicted value of the random forest regressor is closest to the actual stock price.
Table 2. Comparison between models
Methods | R^2 | RMSE | MSE | MAE |
linear regression | 0.98 | 1.27 | 1.62 | 0.94 |
Random forest regressor | 1.00 | 0.52 | 0.27 | 0.38 |
LSTM | 0.97 | 1.68 | 2.82 | 1.25 |
5. Conclusion
In order to forecast Uber's stock price, this study primarily uses three machine learning models: Linear Regression, Random Forest regressor and LSTM. Ultimately, Random Forest regressor value prediction comes the closest to the stock price. However, deficiencies also exist. For example, in this paper, classic models are considered, some sophisticated models are missing, these models deserve further investigations.
References
[1]. Reddy, V. K. S. (2018). Stock market prediction using machine learning. International Research Journal of Engineering and Technology (IRJET), 5(10), 1033-1035.
[2]. Torres P, E. P., Hernández-Álvarez, M., Torres Hernández, E. A., & Yoo, S. G. (2019). Stock market data prediction using machine learning techniques. In Information Technology and Systems: Proceedings of ICITS 2019 (pp. 539-547). Springer International Publishing.
[3]. Daniel, cox. (2005, March). Driving Organic Growth at Bank of America - ProQuest.
[4]. Itransition. Available at: https://www.itransition.com/
[5]. Umer, M., Awais, M., & Muzammul, M. (2019). Stock market prediction using machine learning (ML) algorithms. ADCAIJ: Advances in Distributed Computing and Artificial Intelligence Journal, 8(4), 97-116.
[6]. Gururaj, V., Shriya, V. R., & Ashwini, K. (2019). Stock market prediction using linear regression and support vector machines. Int J Appl Eng Res, 14(8), 1931-1934.
[7]. Ng, A. (2014). CS6140 Machine Learning Regression.
[8]. Nti, K. O., Adekoya, A., & Weyori, B. (2019, July 19). Random Forest Based Feature Selection of Macroeconomic Variables for Stock Market Prediction.
[9]. Palimkar, P., Shaw, R. N., & Ghosh, A. (2021). Machine Learning Technique to Prognosis Diabetes Disease: Random Forest Classifier Approach. Advanced Computing and Intelligent Technologies, 218(1), 219–244.
[10]. Kumar, A., Purohit, K., & Kumar, K. (2021). Stock Price Prediction Using Recurrent Neural Network and Long Short-Term Memory. SpringerLink, 175(1), 153–160.
Cite this article
Dong,X. (2024). Uber stock prediction: A comparative study between three models. Applied and Computational Engineering,46,278-282.
Data availability
The datasets used and/or analyzed during the current study will be available from the authors upon reasonable request.
Disclaimer/Publisher's Note
The statements, opinions and data contained in all publications are solely those of the individual author(s) and contributor(s) and not of EWA Publishing and/or the editor(s). EWA Publishing and/or the editor(s) disclaim responsibility for any injury to people or property resulting from any ideas, methods, instructions or products referred to in the content.
About volume
Volume title: Proceedings of the 4th International Conference on Signal Processing and Machine Learning
© 2024 by the author(s). Licensee EWA Publishing, Oxford, UK. This article is an open access article distributed under the terms and
conditions of the Creative Commons Attribution (CC BY) license. Authors who
publish this series agree to the following terms:
1. Authors retain copyright and grant the series right of first publication with the work simultaneously licensed under a Creative Commons
Attribution License that allows others to share the work with an acknowledgment of the work's authorship and initial publication in this
series.
2. Authors are able to enter into separate, additional contractual arrangements for the non-exclusive distribution of the series's published
version of the work (e.g., post it to an institutional repository or publish it in a book), with an acknowledgment of its initial
publication in this series.
3. Authors are permitted and encouraged to post their work online (e.g., in institutional repositories or on their website) prior to and
during the submission process, as it can lead to productive exchanges, as well as earlier and greater citation of published work (See
Open access policy for details).
References
[1]. Reddy, V. K. S. (2018). Stock market prediction using machine learning. International Research Journal of Engineering and Technology (IRJET), 5(10), 1033-1035.
[2]. Torres P, E. P., Hernández-Álvarez, M., Torres Hernández, E. A., & Yoo, S. G. (2019). Stock market data prediction using machine learning techniques. In Information Technology and Systems: Proceedings of ICITS 2019 (pp. 539-547). Springer International Publishing.
[3]. Daniel, cox. (2005, March). Driving Organic Growth at Bank of America - ProQuest.
[4]. Itransition. Available at: https://www.itransition.com/
[5]. Umer, M., Awais, M., & Muzammul, M. (2019). Stock market prediction using machine learning (ML) algorithms. ADCAIJ: Advances in Distributed Computing and Artificial Intelligence Journal, 8(4), 97-116.
[6]. Gururaj, V., Shriya, V. R., & Ashwini, K. (2019). Stock market prediction using linear regression and support vector machines. Int J Appl Eng Res, 14(8), 1931-1934.
[7]. Ng, A. (2014). CS6140 Machine Learning Regression.
[8]. Nti, K. O., Adekoya, A., & Weyori, B. (2019, July 19). Random Forest Based Feature Selection of Macroeconomic Variables for Stock Market Prediction.
[9]. Palimkar, P., Shaw, R. N., & Ghosh, A. (2021). Machine Learning Technique to Prognosis Diabetes Disease: Random Forest Classifier Approach. Advanced Computing and Intelligent Technologies, 218(1), 219–244.
[10]. Kumar, A., Purohit, K., & Kumar, K. (2021). Stock Price Prediction Using Recurrent Neural Network and Long Short-Term Memory. SpringerLink, 175(1), 153–160.