


1.Introduction
With the rapid economic development and urbanization, the population problem is becoming more and more serious, and the population distribution is becoming more and more diversified. The change in population distribution in space directly reflects the change of different regions in the social and economic fields. Different regions have different cultural backgrounds, economic factors, policies, and management, so their population spatial distribution structure varies. Geographic Information System (GIS) is a computer-based system for acquiring, storing, analyzing, and presenting spatial data. It enables users to visualize, query, and analyze data to gain insights and make informed decisions. GIS is composed of hardware, software, and data. It allows users to create interactive maps and 3D models to explore and analyze spatial relationships, patterns, and trends. GIS is used across a wide range of industries and applications, such as urban planning, navigation, crime analysis, natural resource management, and many more [1]. GIS can help organizations and individuals better understand their environment and enable them to make more informed decisions. GIS is powerful, accurate, cost-effective, and can help improve organizational efficiency and performance. This paper analyzes the current situation and changes in the spatial distribution of population and the urban spatial structure in Chengdu by using GIS technology, so as to provide a scientific basis for promoting sustainable population development. Businesses can use population distribution data to identify potential markets and target audiences. Understanding the demographic characteristics of populations in specific areas, including age, gender, income levels, etc., helps companies tailor their products or services and develop targeted marketing strategies. This can also reveal the environmental impact of human activities in different areas. This information informs policies for sustainable land use, resource management, and environmental protection.
2.Study area profile and data sources
Situated at the western edge of the Sichuan Basin and sitting on plains, Chengdu administers 12,390 km2 of land, ranging in latitude from 30° 05' to 31° 26' N. Meishan, Ziyang, Ya'an, Deyang, and the Ngawa Tibetan and Qiang Autonomous Prefecture are its neighboring prefectures. The urban area features a few rivers with an elevation of 500 m, while the topography becomes more complicated outside of the immediate urban area. The lowest point in Chengdu Prefecture, lying in southeast anointing County, is at 378 m. The total resident population of the city reached 20,947,000 at the end of 2020. The urbanization rate of the resident population is 78.77%, an increase of 3.68 percentage points from the end of 2017. The birth rate of the population is 12.11%, the death rate of the population is 10.38%, and the natural population growth rate is 1.73% [2]. The population data of this study were obtained from the total population data of the sub-districts in the years 2012, 2017, and 2021 in the Chengdu Statistical Yearbook, and the map data were obtained from the National Basic Geographic Information Center. Since the administrative area was adjusted in 2016, the map of 2012 is the zoning map before the administrative area adjustment, and the map of 2017 and 2021 is the zoning map after the administrative area adjustment.
3.Methodology
3.1.Population distribution structure index
Population Distribution Structure Index (PDSI) is a measure of population distribution structure, which reflects the change in population distribution structure in a certain area. PDSI is usually used to assess the population distribution of a certain area, such as the number and density of urban and rural populations, the structure of rural settlements, the response of the population to the geographical environment, etc. PDSI can help governments and social organizations to effectively solve local population distribution problems, such as planning urban structure [3], managing population movement, developing urban and rural transportation, etc.
\( U=\sqrt[]{\frac{\sum _{i=1}^{n}{[\frac{\sqrt[]{2}}{2}(\frac{{P_{i}}}{P}-\frac{{S_{i}}}{S})]^{2}}}{n}} \)(1)
\( C=\frac{1}{2}\sum _{i=1}^{n}|\frac{{P_{i}}}{P}-\frac{{S_{i}}}{S}| \)(2)
In the formulas above, U is the imbalance index, C is the concentration index, P is the total population of the region, S is the total area of the region, and i is a sub-region; n is the sum of all subregions within the study region, Pi is the total population of the region i, and Si is the sum of the areas of the region i.
3.2.Density of population
The density of population is the number of people per unit of land area. There are two commonly used units of measurement: person/square kilometer and person/hectare. It is an important indicator of the distribution of population in a country or region.
\( D=\frac{P}{S} \)(3)
In the formula above, D is the population density within a region, P is the number of people in a region, and S is the number of areas in a region.
3.3.Mean pointer center
The mean point center of a population is a point of equilibrium. The center of gravity of a population is the central point of an area's population, which reflects the total population distribution of an area. It can help study trends in population change and can provide useful information to government decision-makers [4]. The center of gravity can be marked with a dot on a map to reflect the distribution of the population.
4.Analysis of the spatial and temporal evolution of population distribution
4.1.Population distribution structure index
The closer the imbalance and concentration indices are to 0, the more balanced the population distribution is; the closer the imbalance and concentration indices are to 1, the more uneven the population distribution is. With the change of time, the U-value and C-value of the population distribution structure index of Chengdu are both on the rise, and the overall population distribution is more balanced.
4.2.Density of population
Using ArcGIS software to process the population statistics of Chengdu in 2012, 2017, and 2021, the population density distribution of Chengdu can be obtained, as shown in Figure 1. From Figure 1, it can be seen that before the administrative area adjustment in 2016, the largest population densities were in Wuhou and Shuangliu districts. The areas with the lowest density were Xinjin and Pujiang counties. As the main urban area, Wuhou has many factors that attract the population, such as large commercial and trade areas, abundant leisure and entertainment venues, and well-developed subway transportation [5], with interchange stations for many lines set up in this district. The overall population density in the eastern region is larger than that in the west. After the administrative region adjustment in 2016, the population density of Jinyang city gradually became larger, the population density in the east is still higher than that in the west, and the population density in the north is also rising.
4.3.Mean pointer center
The use of the population center of gravity shift model can provide an important basis for making decisions on how to distribute the population and regional socio-economic development in metropolitan areas in the future [6]. By using the ArcGIS tool to visualize the calculation results, it can be seen that the center of gravity of the population in Chengdu in 2012, 2017, and 2021 is in Wuhou District (as shown in Figure 1-4), and the population distribution pattern has not changed much in these three years. The population distribution pattern of the city has not changed much.
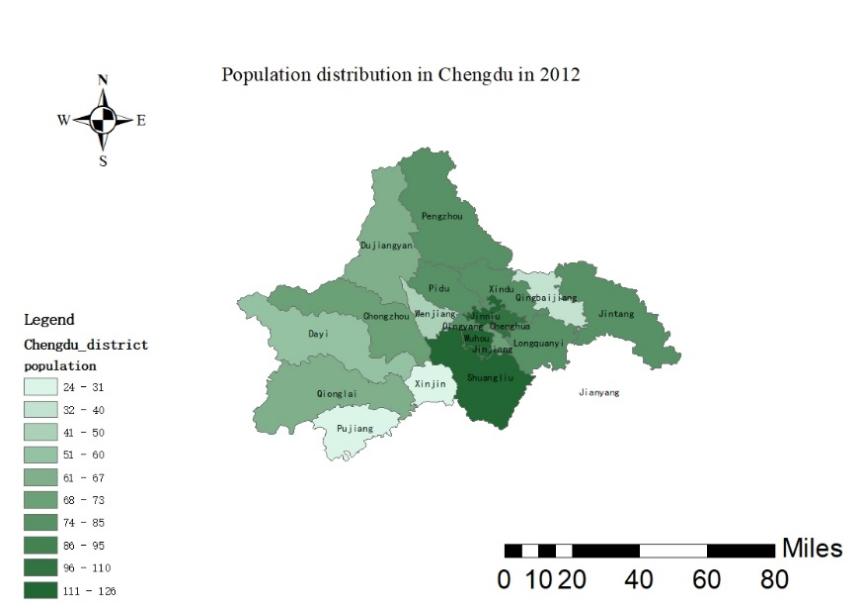
Figure 1. Population distribution in Chengdu in 2012.
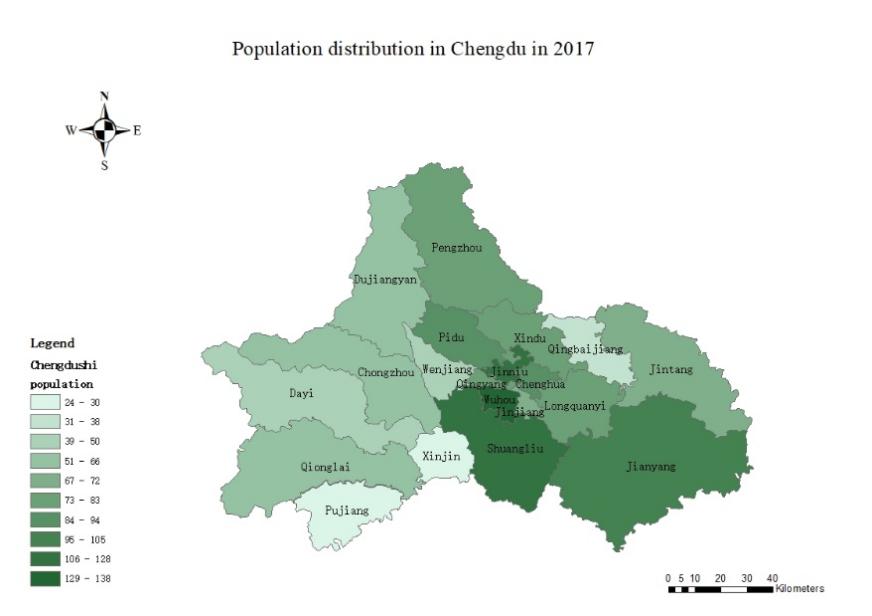
Figure 2. Population distribution in Chengdu in 2017.
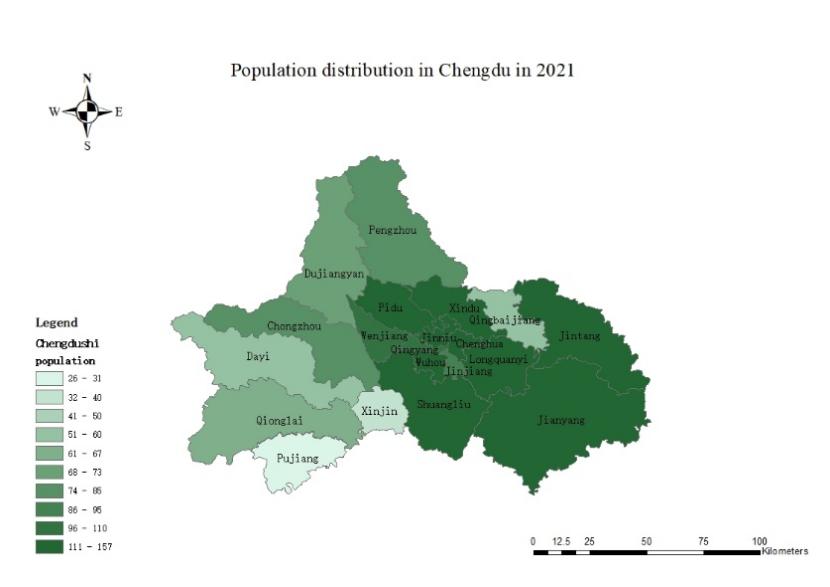
Figure 3. Population distribution in Chengdu in 2021.
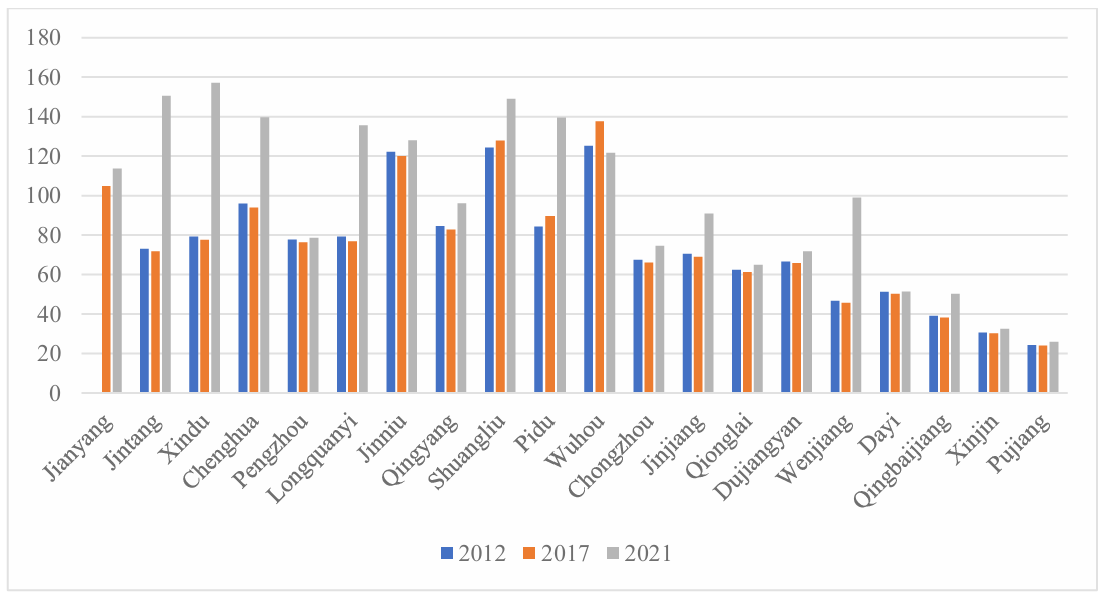
Figure 4. Comparison of population distribution in Chengdu in 2012, 2017, and 2021.
5.The main factors influencing the spatial and temporal patterns of population distribution in Chengdu
The population distribution in a certain region is necessarily influenced and constrained by various factors such as the level of economic development and social production methods in the region [7]. In general, the macroscopic pattern of population distribution in Chengdu has been relatively stable since 2010 until the administrative division adjustment in 2016, with significant geographical differences in population distribution due to the natural environment, economic development level, urban planning and policy factors in the study area, etc. After the administrative division adjustment in 2016, there were significant differences in population distribution compared to the previous pattern [8].
5.1.Environmental and location factors
The environmental and locational factors affecting the population distribution in Chengdu include geographic location, natural resources, economic development, population aggregation patterns, transportation network, and urban development. Geographic location factors include the transportation links and economic links between Chengdu and the surrounding areas, as well as the geographical location where Chengdu is located, and these factors influence population movement and population aggregation. Natural resource factors include climate, vegetation, land quality, topography [9], geomorphology, etc. These resources influence population placement and aggregation. Economic development refers to the economic activities that influence the distribution of population in metropolitan areas, such as agriculture, industry, services, and commerce, which determine the placement and aggregation of the population. Population aggregation pattern refers to the forms of population aggregation, such as urban, rural, and fringe land.
5.2.Urban area restructuring and policy factors
The adjustment of the administrative division of Chengdu in 2016 has led to a significant improvement in the urban development space of Chengdu, optimized resource allocation, and maximum embodiment of the functions of the central city. The area of the central city expands and drives the development of the surrounding areas, and the population distribution shows obvious changes, with a lower degree of aggregation and a more balanced population distribution.
5.3.Economic development level factors
The nature of the spatial distribution of the population is a direct reflection of the differences in the level of economic development. The higher the level of economic development, the higher the population density. The downtown area is the economic, policy, and cultural center of Chengdu. The industries formed in the precinct of the city center have formed a good trend of cluster development. As the collaboration between Sichuan and Chongqing accelerates, the urban areas will attract more resources and investment. The rest of the counties will choose different economic development models according to their own characteristics and market-oriented industries [10], such as agricultural and sideline products, fruits and vegetables, etc., which will fully promote local economic development and thus change the population distribution pattern. The synergistic economic development will drive the population of Chengdu to disperse to different counties and districts. Therefore, the level of economic development can directly influence the spatial distribution of the population, and at the same time, the gathering of the population will also improve the local economic level, resulting in mutual interaction.
6.Conclusion
By analyzing the population structure, population density, and population center of gravity in Chengdu in 2012, 2017, and 2021, it can be concluded that the spatial distribution of the population in Chengdu has the following characteristics:
First, the population distribution pattern in Chengdu has not changed much, but because of the change in administrative areas in 2016, the city area has been expanded to attract talent to the city center.
Second, in the past decade, the population of Chengdu centered in Wuhou district and Shuangliu district; in 2021, the population became more in the areas that are located a little north, such as Wenjiang district. This means that the policy adjustment has a certain impact on the population center of gravity, but not as much as other factors.
Third, the population concentration in Chengdu is obvious, and the population in the western mountainous areas is small, indicating that topography also has an impact on population distribution. Additionally, the economic development and transportation in the west are not as good as they are in the east, so the population is more in the east.
References
[1]. Zhang, R. (2021). Analysis of Spatial and Temporal Changes in Population Distribution and Influencing Factors in Handan City Based on GIS. Technology and Industry (01),130-137.
[2]. Mo, Y., Zhu, Y. F., Zhang, M. and Zhou, B. (2019). Analysis of spatial and temporal evolution characteristics of population distribution in Qingyuan City based on GIS. Journal of Southwest Normal University (Natural Science Edition) (04), 41-48. doi:10.13718/j.cnki.xsxb.2019.04.009.
[3]. Bai, P. Y. and Sun, P. H. (2019). Study on the spatial distribution of population in Nanjing based on GIS. Journal of Shangqiu Normal University (03), 63-67.
[4]. Tian, D. P. (2022). Analysis of the Population Spatial Distribution Pattern in the Downtown of Chengdu Based on Tencent′s Location Big Data Platform. Surveying and Spatial Geographic Information (11), 167-169+177.
[5]. Liu, J. S. (2019). Research on population distribution and economic development of Beijing. Cooperative Economy and Technology (13), 18-19. doi:10.13665/j.cnki.hzjjykj.2019.13.005.
[6]. Tang, P. (2006). Characteristics and impact of floating population in Chengdu Plain urban agglomeration. Sichuan Construction (S1), 33-35+38.
[7]. Zhang, W. L., Hao, Z. J., Wang, Y. B. and Wei, R. B. (2023). Urban agglomeration population mobility spatial network and influencing factors. Geographic Sciences (01), 72-81. doi:10.13249/j.cnki.sgs.2023.01.008.
[8]. He, J. X., Qing, J., Li, X. M., Ling, B. D., Lu, W., He, Z. and the Research Group of “Research on Reasonable Population Distribution in Chengdu District of Tianfu New District”. (2012). Research on Population Development and Policy Suggestions in Chengdu District of Tianfu New District. Western Development Review (00), 26-40.
[9]. Wang, J., Liu, B. T. and Li, Y. R. (2018). Spatial-temporal characteristics and influencing factors of population distribution and floating changes in Beijing-Tianjin-Hebei region. Geographical Research 37(9), 1802-1817.
[10]. Guo, J. M. (2015). Analysis of population distribution and influencing factors in Sichuan Province. Sichuan Normal University.
Cite this article
Chen,Y. (2024). Population analysis using GIS software tools – A case study of Chengdu. Applied and Computational Engineering,59,99-105.
Data availability
The datasets used and/or analyzed during the current study will be available from the authors upon reasonable request.
Disclaimer/Publisher's Note
The statements, opinions and data contained in all publications are solely those of the individual author(s) and contributor(s) and not of EWA Publishing and/or the editor(s). EWA Publishing and/or the editor(s) disclaim responsibility for any injury to people or property resulting from any ideas, methods, instructions or products referred to in the content.
About volume
Volume title: Proceedings of the 4th International Conference on Materials Chemistry and Environmental Engineering
© 2024 by the author(s). Licensee EWA Publishing, Oxford, UK. This article is an open access article distributed under the terms and
conditions of the Creative Commons Attribution (CC BY) license. Authors who
publish this series agree to the following terms:
1. Authors retain copyright and grant the series right of first publication with the work simultaneously licensed under a Creative Commons
Attribution License that allows others to share the work with an acknowledgment of the work's authorship and initial publication in this
series.
2. Authors are able to enter into separate, additional contractual arrangements for the non-exclusive distribution of the series's published
version of the work (e.g., post it to an institutional repository or publish it in a book), with an acknowledgment of its initial
publication in this series.
3. Authors are permitted and encouraged to post their work online (e.g., in institutional repositories or on their website) prior to and
during the submission process, as it can lead to productive exchanges, as well as earlier and greater citation of published work (See
Open access policy for details).
References
[1]. Zhang, R. (2021). Analysis of Spatial and Temporal Changes in Population Distribution and Influencing Factors in Handan City Based on GIS. Technology and Industry (01),130-137.
[2]. Mo, Y., Zhu, Y. F., Zhang, M. and Zhou, B. (2019). Analysis of spatial and temporal evolution characteristics of population distribution in Qingyuan City based on GIS. Journal of Southwest Normal University (Natural Science Edition) (04), 41-48. doi:10.13718/j.cnki.xsxb.2019.04.009.
[3]. Bai, P. Y. and Sun, P. H. (2019). Study on the spatial distribution of population in Nanjing based on GIS. Journal of Shangqiu Normal University (03), 63-67.
[4]. Tian, D. P. (2022). Analysis of the Population Spatial Distribution Pattern in the Downtown of Chengdu Based on Tencent′s Location Big Data Platform. Surveying and Spatial Geographic Information (11), 167-169+177.
[5]. Liu, J. S. (2019). Research on population distribution and economic development of Beijing. Cooperative Economy and Technology (13), 18-19. doi:10.13665/j.cnki.hzjjykj.2019.13.005.
[6]. Tang, P. (2006). Characteristics and impact of floating population in Chengdu Plain urban agglomeration. Sichuan Construction (S1), 33-35+38.
[7]. Zhang, W. L., Hao, Z. J., Wang, Y. B. and Wei, R. B. (2023). Urban agglomeration population mobility spatial network and influencing factors. Geographic Sciences (01), 72-81. doi:10.13249/j.cnki.sgs.2023.01.008.
[8]. He, J. X., Qing, J., Li, X. M., Ling, B. D., Lu, W., He, Z. and the Research Group of “Research on Reasonable Population Distribution in Chengdu District of Tianfu New District”. (2012). Research on Population Development and Policy Suggestions in Chengdu District of Tianfu New District. Western Development Review (00), 26-40.
[9]. Wang, J., Liu, B. T. and Li, Y. R. (2018). Spatial-temporal characteristics and influencing factors of population distribution and floating changes in Beijing-Tianjin-Hebei region. Geographical Research 37(9), 1802-1817.
[10]. Guo, J. M. (2015). Analysis of population distribution and influencing factors in Sichuan Province. Sichuan Normal University.