


1. Introduction
With the development of the automotive industry, the number of cars in China has gradually increased, and automobiles have become one of the most important means of transportation for people traveling. However, traffic accidents threaten the safety of people, with more than a million people killed in car accidents globally each year, and roughly 20 times as many people seriously injured as killed [1]. In the field of passive safety of automobile occupants, many scholars at home and abroad have conducted a lot of research on the protection of the occupants’ head, chest and other key parts [2-4]. But in the process of automobile collision, the lower limbs of the human body may also collide with the dashboard. Although this kind of lower limb injuries do not generally constitute fatal injuries, but the high cost of treatment, long cycle, which may result in the occupant’s physiological function is impaired or even disabled, and unable to live a normal life, which will cause serious damage to the individual and the society.
2. Background
Lower limb protection is very important, and some scholars have conducted relevant research. PJ Atkinson [5] and others studied the effect of instrument panel on femur loads and analyzed the knee injury mechanism. Fan Shasha [6] analyzed the effect of two-order acceleration on occupant leg injury by simplifying the collision waveforms. Huang Jie [7] and Zhu Lanqin [8] studied the injury of the lower leg in a frontal collision, and Zeng Qingyong [9] investigated the effect of IP structure, the angle of lower limb bias of the occupant, and the angle of lower leg to the floor on the injury of the femur. The above have mainly analyzed the lower leg or ankle area or studied knee injuries using simulation methods, with a lack of data support in terms of testing. Domestic and international automobile crash safety regulations for frontal crashes provide limit values for femur loads and knee displacement. In addition to this, Euro NCAP (EUROPEAN NEW CAR ASSESSMENT PROGRAMME) [10] was the first to publish a knee mapping test protocol in 2011, which examines the knee risk in different possible impact positions and provides a more detailed evaluation of the risk of femur injuries. C-NCAP (China-New Car Assessment Program) [11] added this section to the 2021 version of the program, and other assessment organizations are gradually following suit.
According to the knee mapping section of the C-NCAP 2021 Revision , after the vehicle has been tested in a frontal collision, an evaluation of the knee risk area is required, and if there is a crash location point that could result in the femur loads of more than 3.8 kN and/or a knee displacement of more than 6 mm, then the corresponding leg score will be penalized, of which an additional penalty score will be assessed if it is due to the presence of a structural hard point.
This paper combines a large number of knee mapping test data in C-NCAP, statistics on the OLC value, knee risk area distribution and femur loads exceeding the limit at different speeds. The influencing factors and distribution patterns of femur loads in full-width frontal collisions of vehicles were obtained. The results of the study can inform the structural design of vehicle dashboards and the risk assessment of dummy knees.
3. Crash waveform intensity and risk profile statistics
3.1. Distribution of OLC values and their range of change after speedup
In terms of vehicle collision safety, the occupant load criterion (OLC) value is used as an important index to evaluate the strength of the vehicle collision waveform, which assumes that when the vehicle collision occurs, the delay speed of the restraint system is linearly changing, and the constraint system on the dummy constraint acceleration is a constant value that is the OLC value. This value has important implications for knee risk. In the C-NCAP, the acceleration of the B-pillar of the vehicle in a frontal collision at 50 km/h is used for the knee mapping test. In this section, the distribution of OLC values of 50 km/h full-width frontal crashes under different car models is counted, and the total number of statistical data is 36 car models, which are divided into four parts according to the size of OLC values, as shown in Figure 1, which shows that the largest number of distributions is in the range of 26-29 g, accounting for 38.9% of the total number of distributions, whereas there are fewer distributions of 23g or less, which account for only 8.3% of the total number of distributions.
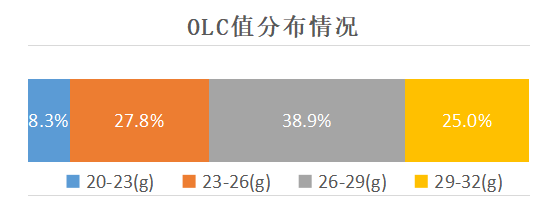
Figure 1. Distribution of OLC values of positive collision test waveforms
In the E-NCAP protocol, the official laboratory counted a large amount of crash waveform data under the MPDB test and designed a generalized waveform, as shown in Figure 2. The distribution of their data is given in Table 1, where it can be seen that the largest percentage, 39.3%, is distributed between 22 g and 29 g. When knee mapping is performed the collision waveform of the sled can be freely selected from the whole MPDB collision waveform or the generic waveform. When selecting the generic waveform, the intensity of the generic waveform can not be exceeded by ±5g. Compared with C-NCAP, it has a wider distribution of OLC value ranges and greater differences in waveform intensity.
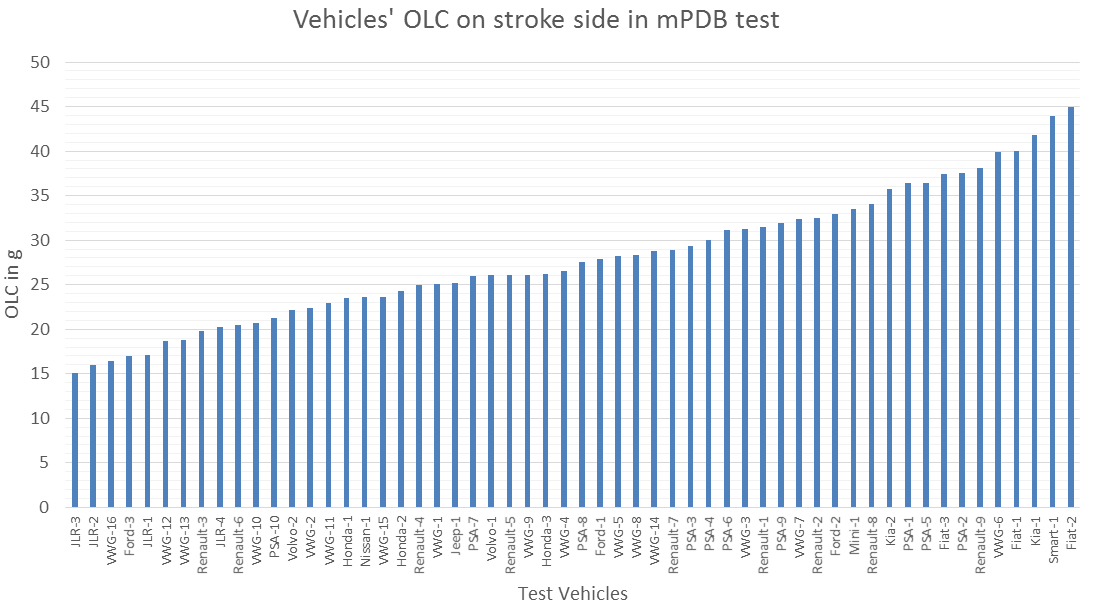
Figure 2. MPDB test waveform OLC values
Table 1. MPDB test waveform distribution
Class | OLC range | No. Data | Percent |
A | ≤ 22g | 12 | 21.4% |
B | 22g < ≤ 29g | 22 | 39.3% |
C | 29g < ≤ 36g | 12 | 21.4% |
D | > 36g | 10 | 17.9% |
When the body structure is not changed, the general OLC value will increase with the increase of collision speed, according to the draft of C-NCAP 2024, the full width frontal impact speed is expected to be increased from 50 km/h to 56 km/h. Table 2 shows the change of OLC value under different speeds in the collision of several different brands and models. According to the results of the research on some manufacturer, the OLC value increases in the range of 3 to 5 g after optimization, models 1 and 2 are the OLC value increases after speed increase without optimization. Models 3 and 4 are the models after structural optimization, and their average increase of OLC value change is only 0.8 g. It can be seen that the amount of OLC change can be effectively reduced after structural optimization in the case of increased speed.
Table 2. Changes in OLC values after speed increase
Manufacturer | OLC variation |
Manufacturer 1 | 4g |
Manufacturer 2 | 3-4g |
Manufacturer 3 | 4-5g |
Model 1 | 7.65g |
Model 2 | 8.36g |
Model 3 | 0.6g |
Model 4 | 1g |
Figures 3 give details of the changes in body acceleration for Model 1 and Model 2 after increasing the impact speed. It was found that when the structure was not optimized, the overall acceleration of Model 1 were increased, and although the peak value of Model 2 was not increased, the early acceleration was significantly increased, and the calculated OLC values were changed significantly. It shows that after the increase of speed, the two kinds of body acceleration waveform intensity both increased, but the form of increase is different, one for the overall level of increase, and the other for the acceleration of the valley value becomes larger.
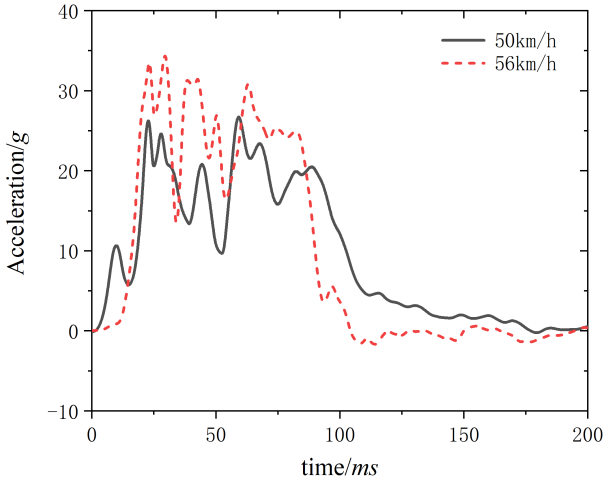
model 1
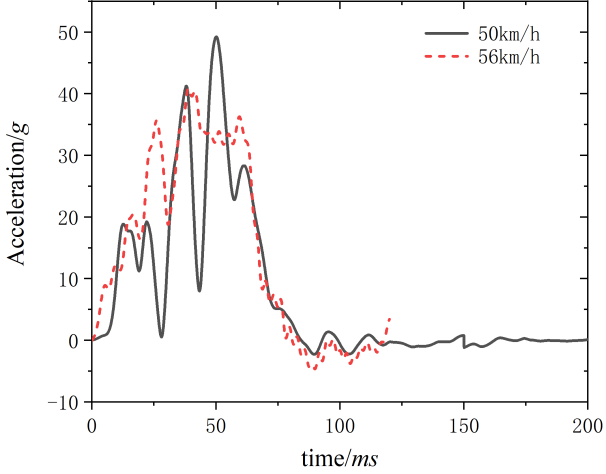
model 2
Figure 3. Unoptimized acceleration profile
3.2. Analysis of the distribution pattern of risk points
The following is a statistical analysis of the distribution pattern of knee risk points. The selection of risk points is greatly influenced by the model, interior parts and other factors. Through a number of test data for comparison and analysis, the main driving risk points are now divided into five positions according to their characteristics: steering column adjustment switch, steering column shroud bolts and brackets, the harder interior transition parts, instrument panel surface switch hard point and the corner of the center control screen. Figure 4 shows a typical schematic diagram of the risk points of each characteristic.
steering column adjustment switch |
steering column shroud bolts and brackets |
the harder interior transition parts |
instrument panel surface switch hard point |
the corner of the center control screen | |
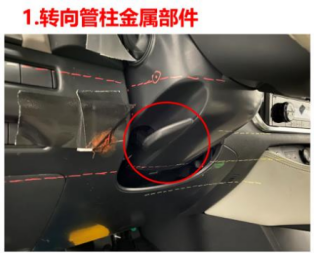
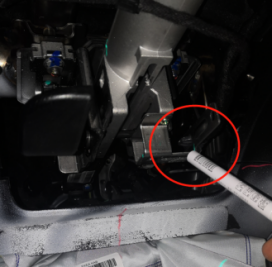
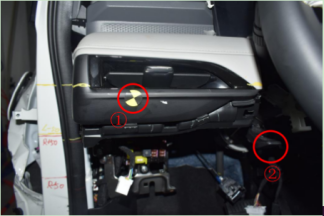
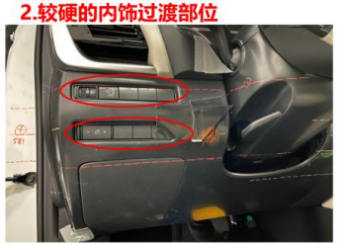
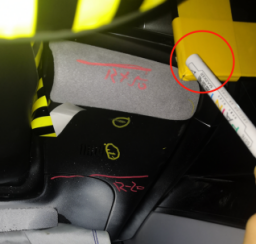
Figure 4. Schematic diagram of risk points for the driver’s region
The following will be analyzed according to the driver and passenger riding position, the left leg and the right leg parts of the statistical analysis. Figure 5-6 show the driver of the different legs of the risk point distribution. The driver of the left leg of the risk point location of the steering column adjustment switches accounted for 40%, followed by the transition parts of the harder interior decoration. The driver’s right leg is primarily focused on the steering column shroud bolts and brackets, accounting for close to 1/2 of the driver’s right leg. The second highest percentage is the harder interior trim piece transition area. Across all models, the steering column adjustment switch and the steering column shroud bolt and its bracket are two locations that tend to be risky. The high percentage of transition areas for harder interior parts is mainly due to their wider scope, which mainly includes the intersection line of two parts and harder projecting surfaces.
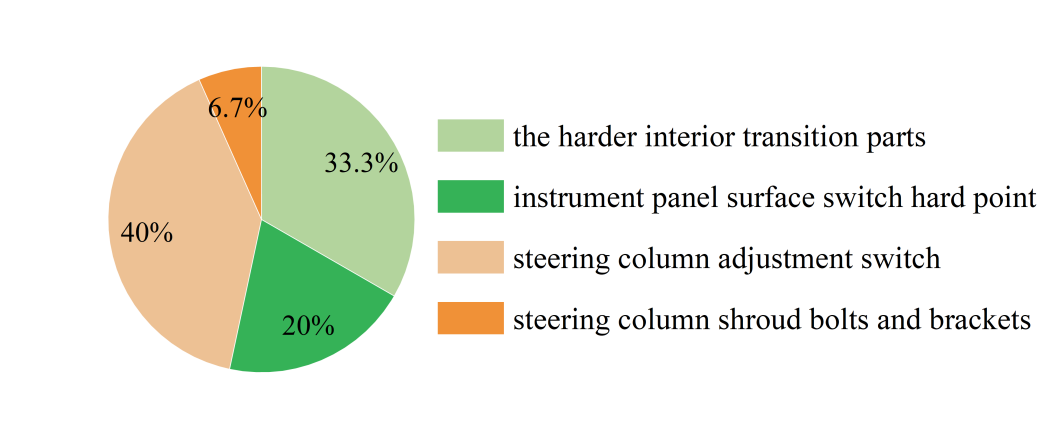
Figure 5. Percentage of risk points for the left leg’s region
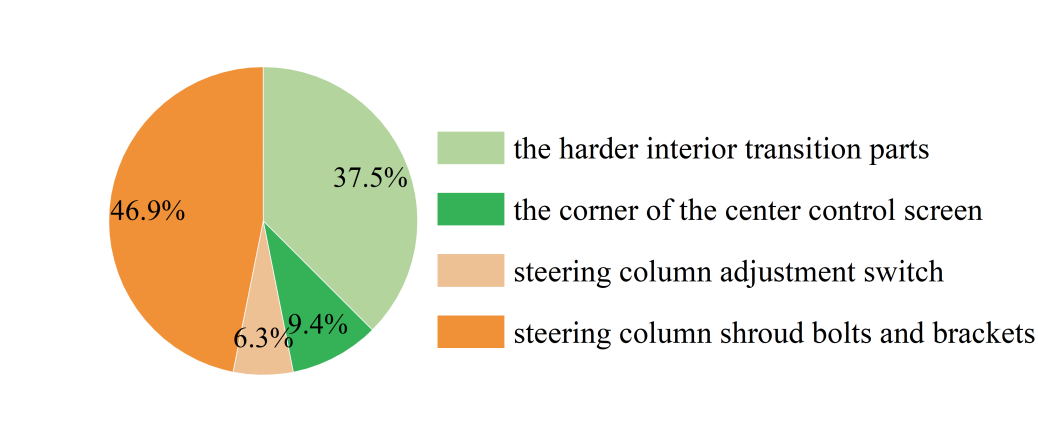
Figure 6. Percentage of risk points for the right leg’s region
glove compartment switch |
the harder interior transition part |
the corner of the center control screen | |
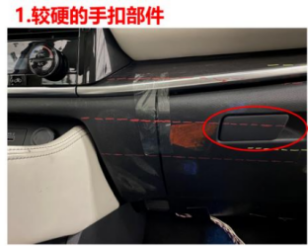
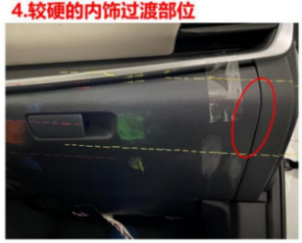
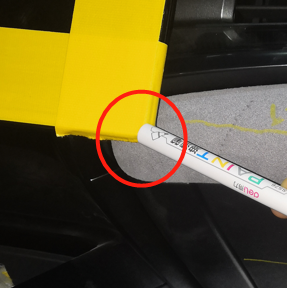
Figure 7. Schematic diagram of risk points for the passenger’s region
Risk points were counted in the same way for the passenger side. The dashboard in front of the passenger side is more concise compared to the ride environment on the driver’s side, and the overall number and type of risk points become less, which can be categorized into the following three characteristic risk points: the glove compartment switch, the harder interior transition part, and the corner of the center control screen, whose typical schematic diagrams are given in Figure 7.
Figure 8 shows the distribution of risk points for the passenger’s left leg, and it can be seen that due to the wide range of harder interior transition parts, it occupies 79.5% of the proportion, in addition to the glove box switch and center screen impact risk is also relatively high. On the other hand, the risk points of the passenger’s right leg are all in the transition part of the harder upholstery, and there are no other characteristic risk points.
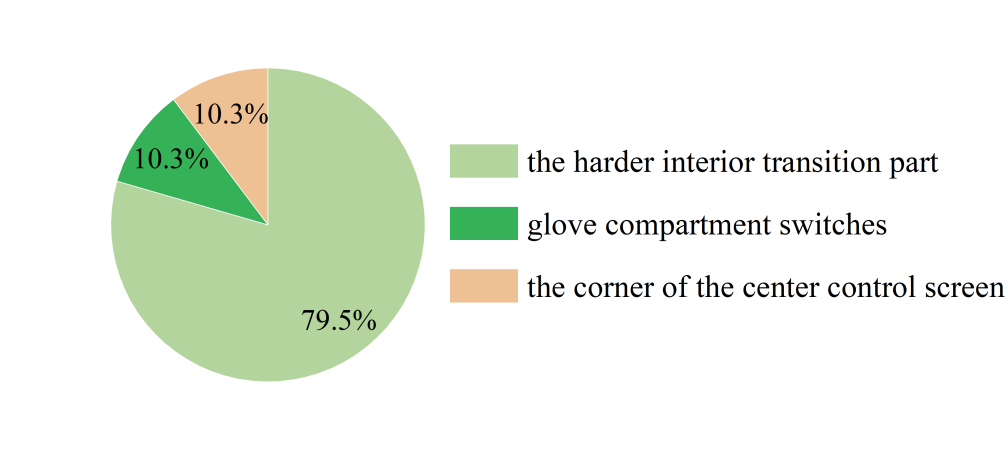
Figure 8. Percentage of risk points for passenger left leg characteristics
3.3. Statistical analysis of femur loads overruns
Then counted the situation of femur loads exceeding the limit. Table 3 shows the statistical process of exceeding the limit of the location, the number of times and the proportion of the situation, the total number of times in this section of the test statistics is 145 times. The femur loads exceeded the limit of the number of times for 7 times, the overall proportion of 4.8%. It can be found that the position of steering column adjustment switch is most likely to exceed the limit value, and the vehicle design should focus on considering the risk of this position.
Table 3. Femur loads overruns
Impact location | Total number of times | Exceeding limit times | ratio |
the harder interior transition parts | 85 | 4 | 4.7% |
steering column adjustment switch | 20 | 2 | 10% |
steering column shroud bolts and brackets | 20 | 1 | 5% |
Others | 20 | 0 | 0% |
Total | 145 | 7 | 4.8% |
In addition, the test process found that some of the risk points, although in the division of the region, and the structural strength of the larger or more protruding shape. But due to the location of the more marginal, after the test is more difficult to produce an impact with the location. Figure 9 shows a schematic diagram of the location of the risk. For such more marginal risk points, the optimization can be reduced according to the other structure to reduce the consideration as appropriate.
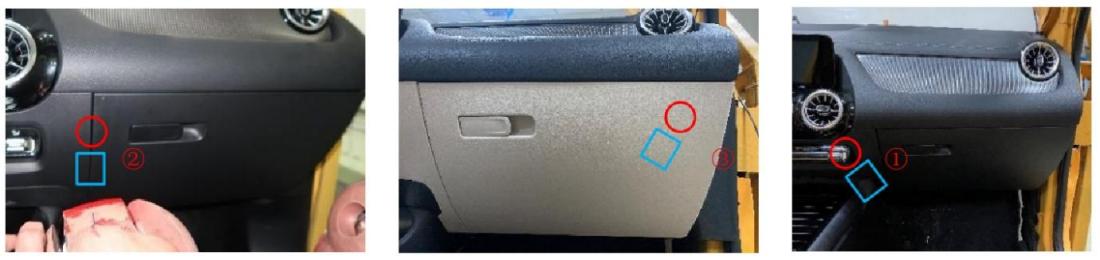
Figure 9. Schematic of edge risk points
4. Analysis of femur injury results
4.1. Distribution pattern of femur loads at different locations of risk points
The femur loads injury values are analyzed below. Table 4 shows the median femur loads at different positions, and it can be seen that the top three risky positions are the hard corner of the center control screen, the steering column shroud bolts and brackets, and the glove compartment switch, with median femur loads of 2.163 kN, 2.041 kN, and 1.853 kN, respectively.
Table 4. The median femur loads at different positions
Impact location | Femur loads(kN) |
the corner of the center control screen | 2.163 |
steering column shroud bolts and brackets | 2.041 |
glove compartment switches | 1.853 |
the harder interior transition part | 1.562 |
steering column adjustment switch | 1.519 |
instrument panel surface switch hard point | 0.806 |
Analysis of the results revealed that the hard corners of the protruding center screen caused the highest degree of damage to the femurs. Secondly, the steering column shroud bolts and brackets, combined with the previous section can be seen, as each model basically has the steering column shroud bolts and brackets location, and because of the hard metal material, these locations are easy to become a point of risk, but also easy to cause serious injury to the femurs. For the passenger glove box switch position, compared to other smooth dashboards, this position is characterized by hard corners and hard edges due to the presence of the switching mechanism, which poses a higher risk of knee injuries. For the two positions of the transition part of the harder interior parts and the steering column adjustment switch, their femur loads injury values are similar, and for the position of the switch on the surface of the instrument panel, it was analyzed and found that the lower femur loads injury is due to the fact that the half of the switch is located on the side of the femurs and above the femurs, which does not produce a tighter collision during the impact, and therefore the risk of this position is smaller.
4.2. Effect of different collision speeds on femur loads
The crash waveforms and OLC value changes for Model 1 and Model 2 have been previously available. In this section, four risk points were selected to analyze the femur loads injury changes in 50 km/h and 56km/h speed crashes, as shown in Table 5. From the table, it can be seen that for the same position at different speeds in the positive collision, the femur loads injury value has increased, but the increase is limited. Calculation of the following four comparison tests shows that the average femur loads increase is about 0.75 kN.
Table 5. Comparison of femur loads at different speeds
Vol (km/h) | OLC variation | Location | Impact location | Femur loads(kN) | Increment |
50 | 7.65 | Passenger’s left leg | the harder interior transition part 1 | 2.592 | 1.087 |
56 | Passenger’s left leg | the harder interior transition part 1 | 3.679 | ||
50 | Passenger’s right leg | glove compartment switches | 1.524 | 0.221 | |
56 | Passenger’s right leg | glove compartment switches | 1.745 | ||
50 | 8.36 | Driver’s right leg | the harder interior transition part 2 | 0.924 | 0.951 |
56 | Driver’s right leg | the harder interior transition part 2 | 1.875 | ||
50 | Passenger’s right leg | the harder interior transition part 3 | 0.05 | 0.74 | |
56 | Passenger’s right leg | the harder interior transition part 3 | 0.79 |
4.3. Effect of different seat belt tension on femur loads
Since the lap belt force in knee mapping test has an important restraining effect on knee impact, the tension of the seat belt B6 position was collected, and for the steering column adjustment switch risk point, the relationship between the tension of the B6 position and the femur loads was statistically calculated for different car models, as shown in Figure 10. It shows that most of the distribution range of the tensiometer is concentrated in 7-10 kN, and at the same time, with the increase in the lap belt force, the value of the femur injury has a tendency to gradually decrease.
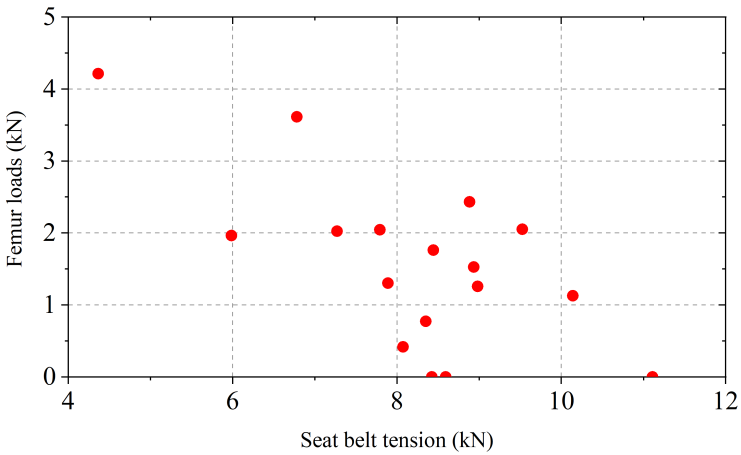
Figure 10. Femur loads at different seat belt tension
5. Conclusions
This article uses knee mapping test data to analyze the distribution of OLC values of waveform strength in frontal impact tests and the range of changes after acceleration. By dividing knee risk positions through different features, the distribution of risk points is statistically analyzed, and the influence of different factors on femur loads is explored. The results indicate that:
At a collision speed of 50km/h, the vast majority of OLC values are in the range of 23 g-32 g, with the largest percentage of 29 g-32 g in Part IV at 38.9%. The OLC value will increase after speeding up, and the amount of change in the OLC value can be effectively reduced by optimizing the front suspension. For the same position, the femur loads increases with the increase in collision speed, and the average of the four test increases is 0.75kN.
Based on the knee mapping test risk location characteristics, the driver’s region was categorized into five characteristic risk points and the passenger into three characteristic risk points. The most risky locations for the driver are the steering column adjustment switch and the steering column shroud bolts and their brackets. The most risky location on the passenger’s left leg is the hard interior transition area. The highest position of the femur loads override ratio is the steering column adjustment switch.
The location with the largest median femur loads under different impact positions is the hard corner of the center control screen, followed by the steering column shroud bolts and brackets. The manufacturer should focus on the structural design and use of materials in this location to reduce the risk caused by this location when conducting structural design. In the process of collision, the size of the belt force of the safety belt has an important role in the protection of the dummy knee injury. Within a certain range, as the seat belt tension increases, the femur loads gradually decreases.
References
[1]. Fitzpatrick,Laura. (2009) Global Status Report On Road Safety: Time for Action.Time.
[2]. Tian W, Li J, (2019) Analysis of the chest injury value and seat belt force value of a frontal collision dummy. Science and Technology & Innovation,(7):46-48, 51.
[3]. Xiao S, Yang J k, et al. (2017) Analysis of chest injury in frontal impact via finite element modelling based on biomechanical experiment. Chinese Journal of Theoretical and Applied Mechanics, 49(1): 191-201.
[4]. Li B Y, Fang Q Y, et al. (2015) The Optimization of Passenger Dummy Chest Injury for a Car in Frontal Crash.Infats Proceedings of the 12th International Forum of Automotive Traffic Safety, (7):334-340.
[5]. Atkinson P J , Garcia J J , Altiero N J ,et al. (1997) The Influence of Impact Interface on Human Knee Injury: Implications for Instrument Panel Design and the Lower Extremity Injury Criterion.Sae Technical Papers, 167-180.
[6]. Fan S S, Duan D L, et al. (2022) Effect of Vehicle Frontal lmpact Acceleration on Occupant Leg Injury, Automobile Parts,(7):79-82.
[7]. Huang J, Fei J, et al. (2018) Study on the Lower Leg Injury of Front Collision Base on a Vehicle. Journal of Chongqing University of Technology( Natural Science), 32(10) : 47-52.
[8]. Zhu L Q, Zhang T T, et al. (2016) Analysis and research on the characteristics of dummy calf injuries in frontal collisions. The 19th conference of automotive safety technology, P 1-9.
[9]. Zeng Q Y, Xiang Z K, et al. (2020) Research on the thigh injury of a frontal collision dummy based on a certain type of vehicle. Machine tool & Hydraulics, 48(18): 116-122.
[10]. Euro NCAP. (2011) European New Car Assessment Programme. http// www.euroncap.com.
[11]. CATARC. (2021) China-New Car Assessment Program. https://www.c-ncap.org.cn.
Cite this article
Wang,J.;He,Y.;Lou,L.;Wang,X. (2024). Analysis of femur injury of vehicle frontal collision based on knee mapping test. Applied and Computational Engineering,65,128-137.
Data availability
The datasets used and/or analyzed during the current study will be available from the authors upon reasonable request.
Disclaimer/Publisher's Note
The statements, opinions and data contained in all publications are solely those of the individual author(s) and contributor(s) and not of EWA Publishing and/or the editor(s). EWA Publishing and/or the editor(s) disclaim responsibility for any injury to people or property resulting from any ideas, methods, instructions or products referred to in the content.
About volume
Volume title: Proceedings of Urban Intelligence: Machine Learning in Smart City Solutions - CONFSEML 2024
© 2024 by the author(s). Licensee EWA Publishing, Oxford, UK. This article is an open access article distributed under the terms and
conditions of the Creative Commons Attribution (CC BY) license. Authors who
publish this series agree to the following terms:
1. Authors retain copyright and grant the series right of first publication with the work simultaneously licensed under a Creative Commons
Attribution License that allows others to share the work with an acknowledgment of the work's authorship and initial publication in this
series.
2. Authors are able to enter into separate, additional contractual arrangements for the non-exclusive distribution of the series's published
version of the work (e.g., post it to an institutional repository or publish it in a book), with an acknowledgment of its initial
publication in this series.
3. Authors are permitted and encouraged to post their work online (e.g., in institutional repositories or on their website) prior to and
during the submission process, as it can lead to productive exchanges, as well as earlier and greater citation of published work (See
Open access policy for details).
References
[1]. Fitzpatrick,Laura. (2009) Global Status Report On Road Safety: Time for Action.Time.
[2]. Tian W, Li J, (2019) Analysis of the chest injury value and seat belt force value of a frontal collision dummy. Science and Technology & Innovation,(7):46-48, 51.
[3]. Xiao S, Yang J k, et al. (2017) Analysis of chest injury in frontal impact via finite element modelling based on biomechanical experiment. Chinese Journal of Theoretical and Applied Mechanics, 49(1): 191-201.
[4]. Li B Y, Fang Q Y, et al. (2015) The Optimization of Passenger Dummy Chest Injury for a Car in Frontal Crash.Infats Proceedings of the 12th International Forum of Automotive Traffic Safety, (7):334-340.
[5]. Atkinson P J , Garcia J J , Altiero N J ,et al. (1997) The Influence of Impact Interface on Human Knee Injury: Implications for Instrument Panel Design and the Lower Extremity Injury Criterion.Sae Technical Papers, 167-180.
[6]. Fan S S, Duan D L, et al. (2022) Effect of Vehicle Frontal lmpact Acceleration on Occupant Leg Injury, Automobile Parts,(7):79-82.
[7]. Huang J, Fei J, et al. (2018) Study on the Lower Leg Injury of Front Collision Base on a Vehicle. Journal of Chongqing University of Technology( Natural Science), 32(10) : 47-52.
[8]. Zhu L Q, Zhang T T, et al. (2016) Analysis and research on the characteristics of dummy calf injuries in frontal collisions. The 19th conference of automotive safety technology, P 1-9.
[9]. Zeng Q Y, Xiang Z K, et al. (2020) Research on the thigh injury of a frontal collision dummy based on a certain type of vehicle. Machine tool & Hydraulics, 48(18): 116-122.
[10]. Euro NCAP. (2011) European New Car Assessment Programme. http// www.euroncap.com.
[11]. CATARC. (2021) China-New Car Assessment Program. https://www.c-ncap.org.cn.