


1. Introduction
Malaria is a vector-borne disease caused by the bite of the Anopheles mosquito, which is infected with the Plasmodium parasite. Despite significant progress in reducing the total number of malaria cases and deaths worldwide, malaria remains a huge threat to the African continent and the world at large. According to the World Malaria Report issued by the World Health Organisation (WHO), there will be an estimated 249 million malaria cases and 608,000 malaria deaths in 85 countries globally in 2022, with the African region accounting for 94 percent of the total number of malaria cases and 95 percent of malaria deaths, and with children under five years of age accounting for approximately 78 percent of all malaria deaths in the region [1]. Accurate Plasmodium testing and treatment are the most effective means of preventing mild cases of malaria from progressing to severe illness and death [2].
According to the gold standard recommended by the WHO, malaria blood smear microscopy is the most direct and important method for detecting Plasmodium and malaria cases [2]. However, this method is time-consuming and requires a lot of resources. What’s more, according to the relevant tracking research in China, the relevant staff have a low rate of mastery of the core content of the new version of the "Diagnosis of malaria" (WS259-2015) standard, and there is confusion between the old and the new version of the standard, which cannot meet the needs of field work [3]. The situation is even more serious in some resource-poor areas in China.
In recent years, the application of computer-aided diagnostic technology in the medical field has gradually become a research hotspot, especially the superior performance of deep learning technology in image recognition and pattern analysis, which provides new possibilities for its application in malaria diagnosis. Integrated learning is an approach to solving classification problems by integrating base models. Each base model makes its own label predictions and then the final category label predictions are generated by voting through the integrated learning model [4]. In contrast to integrated learning, Convolutional neural network (CNN) is a typical deep neural network, and its main feature is that it can automatically extract image features and classify them, which has a wide range of applications in medical fields. CNNs are able to automatically learn and extract local features in an image through a combination of convolutional and pooling layers, which in turn identifies higher-level features. This feature extraction approach makes CNNs very effective in representing features in image data. In contrast, feature selection for integrated learning models is very difficult for complex image data. And then, CNN can achieve fast learning of similar features based on weight sharing [5].
Based on this, the paper proposed a CNN-based model to solve the above problems encountered in the diagnosis of malaria. We hypothesized that the method can automatically identify the appearance of cells and distinguish infected cells from uninfected cells, thus achieving cell classification and characterization.
2. Methods
2.1. Image dataset description
The malaria cell dataset in this study was extracted from the official website of the National Institutes of Health [6]. It contains 2 folders: "infected" and "uninfected", with a total of 27,558 images (13,779 images each for "infected" and "uninfected"). The images are in Portable Network Graphics (PNG) format, and the size of each image ranges from 5KB to 20KB. It can be found that this dataset has sufficiently rich samples and is relatively balanced.
2.2. Image pre-processing
The dataset images were firstly scaled (the images are uniformly resized to 50x50 pixels) to maintain feature consistency and improve computational efficiency. Also, it was to adapt the model input of the CNN.
On the other hand, CNNs require a large amount of data for support in order to meet the training requirements and improve the generalization ability of the model. In the case of limited data in the dataset, this study used the preprocessing of data augmentation on the dataset, which consists of rotating the images by 45 degrees and 75 degrees, respectively, as well as blurring to achieve the purpose of expanding the dataset.
The images were then grabbed and drawn and labelled to understand the appearance of infected and uninfected cells. Figure 1 and Figure 2 show the 49 cell images generated, with "infected" labelled as 1 and uninfected labelled as 0. Figure 2 shows a comparison of "infected" and "uninfected" cells. Then, the processed data are divided into training set, validation set and test set in about 8:1:1. Figure 3 shows the comparison of the specific number of samples.
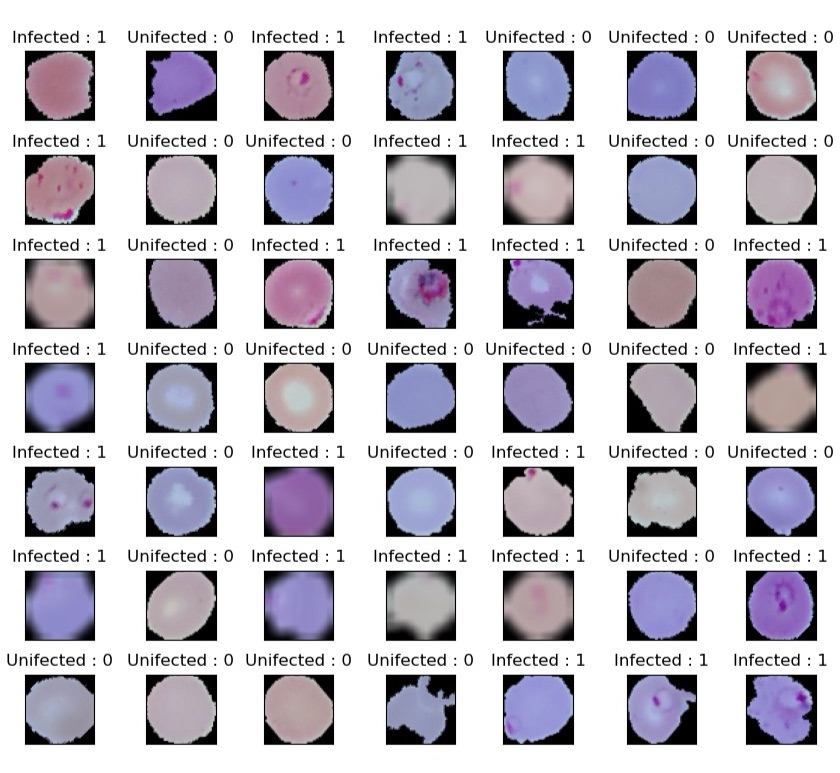
Figure 1. The cases of drawn images after randomly grab.
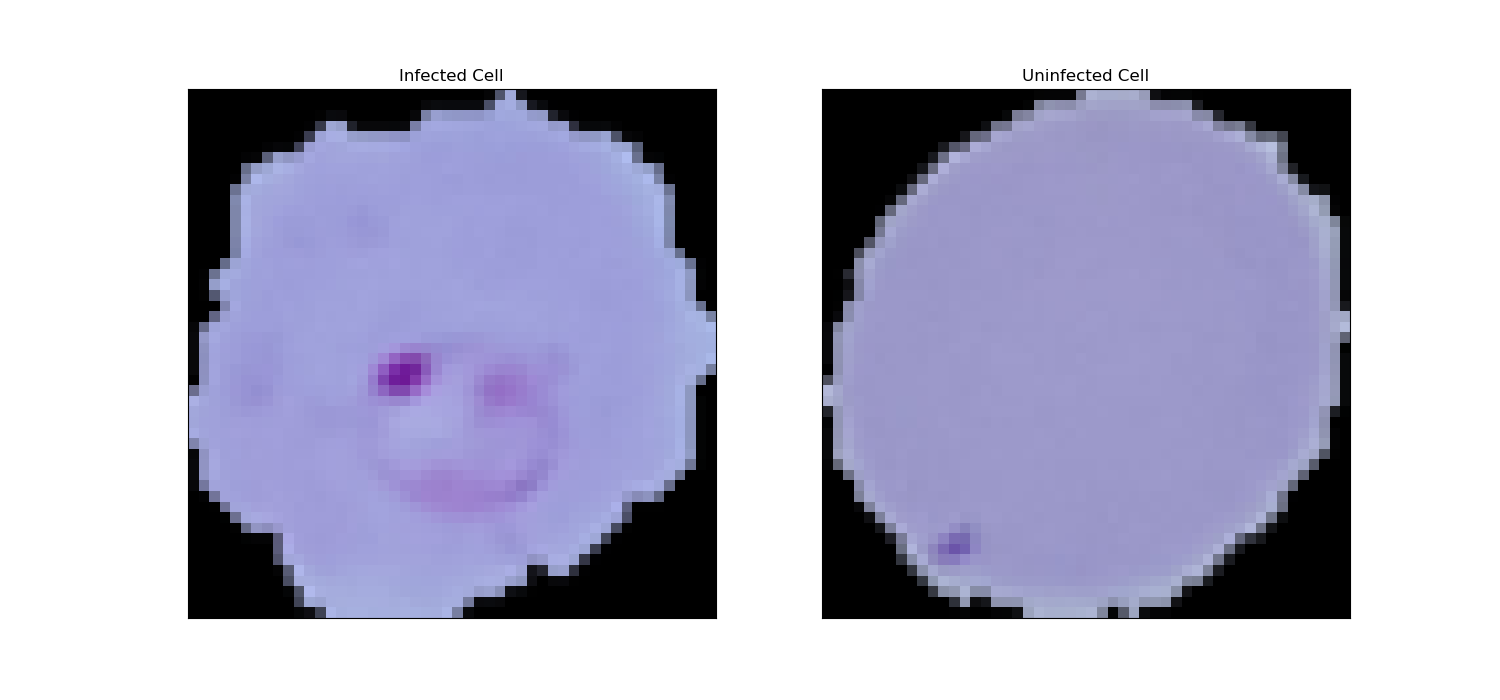
Figure 2. Images of "infected" and "uninfected" cells.
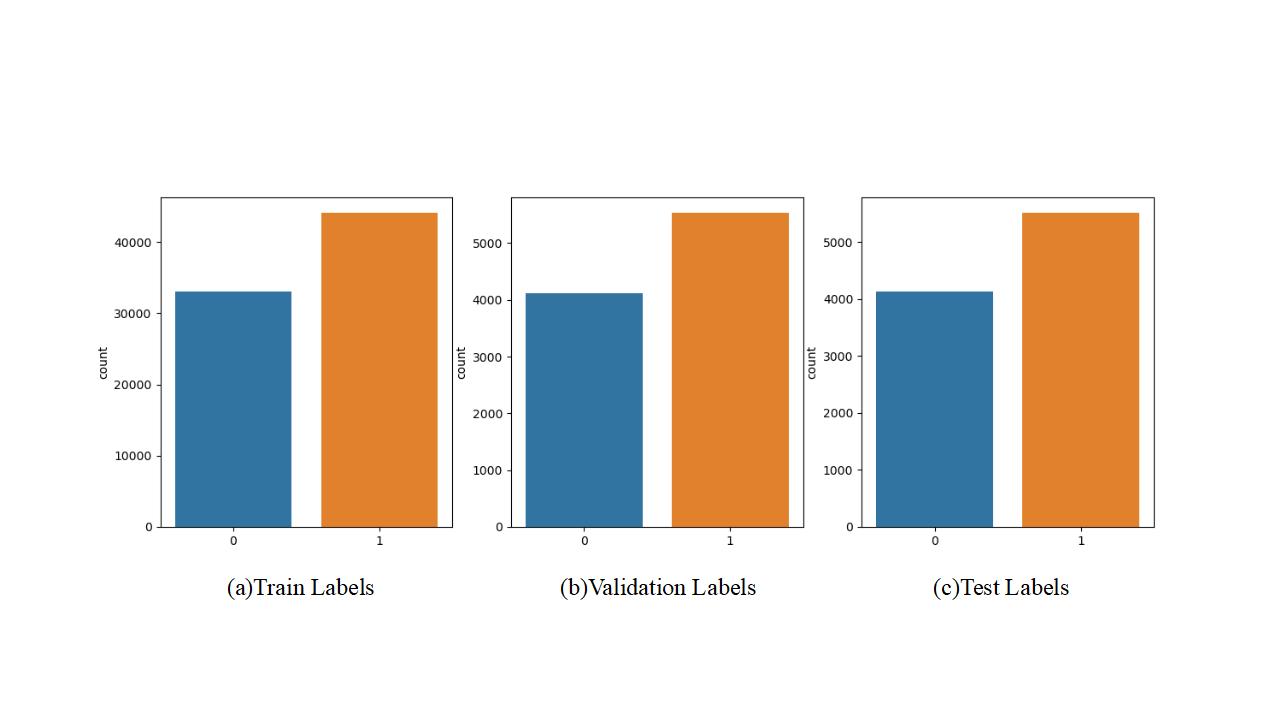
Figure 3. Comparison of sample size of training, validation and test sets.
Since the dataset used in this study is four-dimensional image data, the dataset needs to be first downscaled when individual models are applied for training. The labels of the training set were first reshaped into a two-dimensional array where each label is a separate row. This is done to ensure dimensionality matching for subsequent processing. Then the average_channel(image) and flatten_images_to_2d(images) functions are applied to convert the image data from the test and training sets into a 2D format that can be processed by the above model.
2.3. Convolutional Neural Network
In this study, three convolutional layers, three maximal pooling layers, and two fully connected layers were set up for the CNN. Firstly, a convolutional layer Conv1 with 32 2D convolutional kernels was designed, and the size of the convolutional kernels was set to 3×3 in order to introduce more nonlinearities. The model accepted inputs with the shape of 50×50×3, which is used to initially extract features from the input image. As the image information is cumbersome, a maximum pooling layer Maxpooling1 is then designed to downsample the input data and reduce the spatial size of the data. The size of the pooling window was 2×2 to reduce the complexity of the model and increased its robustness to spatial transformations. A second 2D convolutional layer, Conv2, was then designed with 64 convolutional kernels, each of which is still 3*3. Maxpooling2 was also designed to perform maximum pooling again, and the pooling window size was still 2×2. Finally, a Maxpooling3 again for maximum pooling with 128 convolutional kernels was designed and no change in the size of the convolutional kernels (Figure 4).
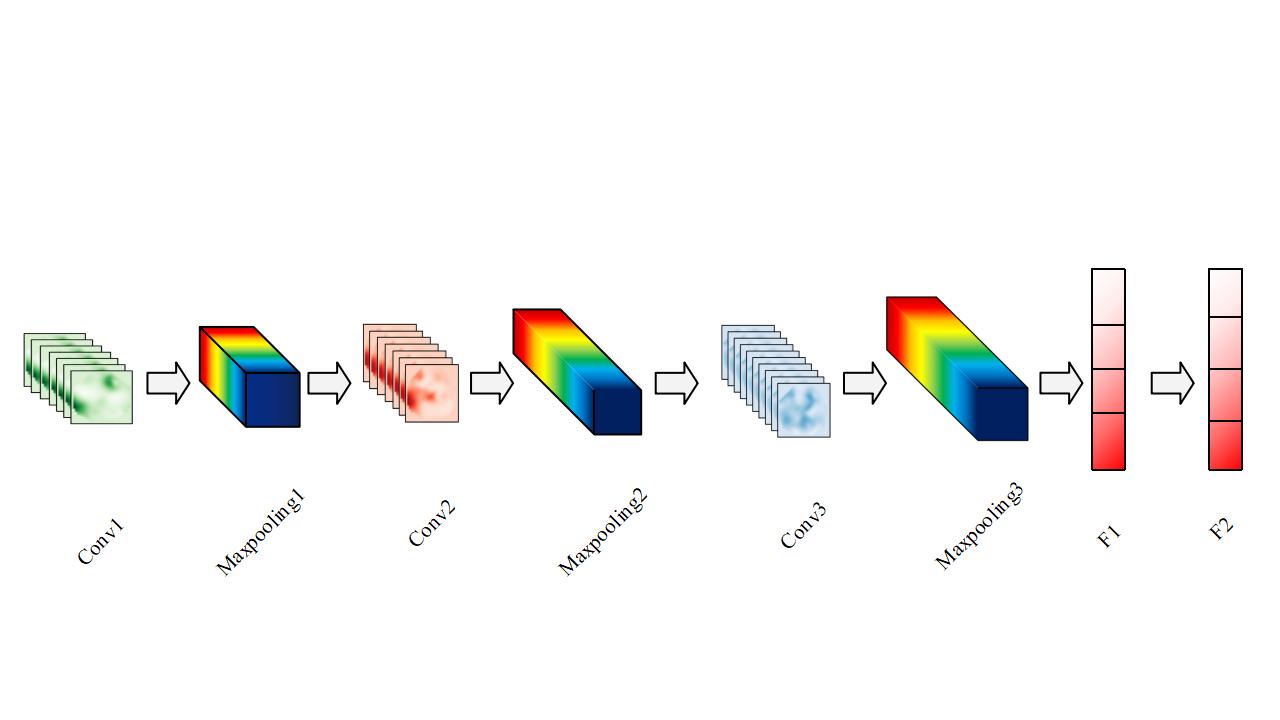
Figure 4. The basic model of convolutional neural network used in the study.
Then, the feature map after the previous convolution and pooling process will be spread into a long vector by applying the spreading layer in order to be input to the fully connected layer. In order to integrate the distributed feature representations extracted from the previous layers, two fully connected layers F1 and F2 were designed in this study, activated by Rectified Linear Units (ReLU) and Sigmoid functions, respectively, and the Flatten layer was used for articulation. Among them, the ReLU layer was used as the control layer of the activation function of the neural network, which can effectively reduce the training time and improve the overall algorithm performance, which helps to enhance the performance of the model. The output value of the Sigmoid function was limited to between 0 and 1, which can effectively curb the impact of the extreme values of the data on the network, and help the network to remain stable during the learning process.
2.4. CNN training process
This study was to build, compile, train and evaluate a CNN model using TensorFlow's Keras API where the epochs were set to 50 and the batch_size was 100.To optimise the model, the algorithm additionally adds the EarlyStopping early stopping function callback. The model stopped training when the validation loss no longer improves to prevent overfitting. This study also compared the experimental results of these two models.
2.5. Integrated Learning Models
In order to better validate the superiority of CNN models, this study also did the performance evaluation related to integrated learning models, including Decision Tree Model (DT), Random Forest Model (RF), Gradient Boosting Model (GB), Adaptive Boosting Model (Ada) and XGBoost Model (XGB).
2.6. Indicators for the assessment of models
The main assessment metrics used in this study were Accuracy (Acc), Loss Value (Loss), AUC (Area Under the Curve), Precision (P), Retrieval (R), and the reconciled mean of Precision and Recall (F1 Score).
This model was used for binary classification problems. Based on this, the accuracy is particularly important and it is used to measure the overall performance of the model. And the loss value can be used to measure the gap between the predicted and actual values of the model with the following formula.
\( Acc=\frac{TP+TN}{TP+FP+TN+FN} \) | (1) |
In the dichotomous classification task, true positive (TP), false positive (FP), true negative (TN) and false negative (FN) variables were calculated. The variables were calculated based on ground truth and predicted labels [7].
This study also provided specific data on the precision rate. In this study, it is the proportion of samples that are actually infected with malaria cells out of all samples predicted as malaria cells by the model. In addition, for specific disease diagnoses, the cost of missed detection is often higher than the cost of misdiagnosis, and therefore the detection rate is also an important measure of the performance of such classification models [5]. In this study, it was defined as the proportion of samples correctly predicted by the model to be malaria cells out of those actually infected with malaria cells. In summary, accuracy and detection rate each have their own focus in assessing the performance of classification models, and together they constitute a comprehensive system of metrics for assessing model performance. In order to synthesize the relevant performance, this study also gives the reconciled mean F1 value of the two, which is given in the following formula:
\( P=\frac{TP}{TP+FP} \) | (2) | |
\( R=\frac{TP}{TP+FN} \) | (3) | |
\( F1=\frac{2P*R}{P+R} \) | (4) |
In addition, Area Under the Curve (AUC), as a model performance assessment metric, is commonly used to measure the generalization ability of a model, which is obtained by calculating the area under the Receiver Operating Characteristic (ROC) curve [8]. The closer the AUC value is to 1, the better the model performance is.
3. Experimental results and discussion
The results obtained from the above CNN model are shown in Figure 5. It can be found that the difference between the loss curves of the training and test sets of the base CNN model was large, which is suspected of overfitting. And the optimised CNN model additionally added an early stop function, which avoids this very well. And the accuracy has been improved by a considerable margin. This study also provided the results of round robin training and evaluation of each integrated learning model (Figure 6).
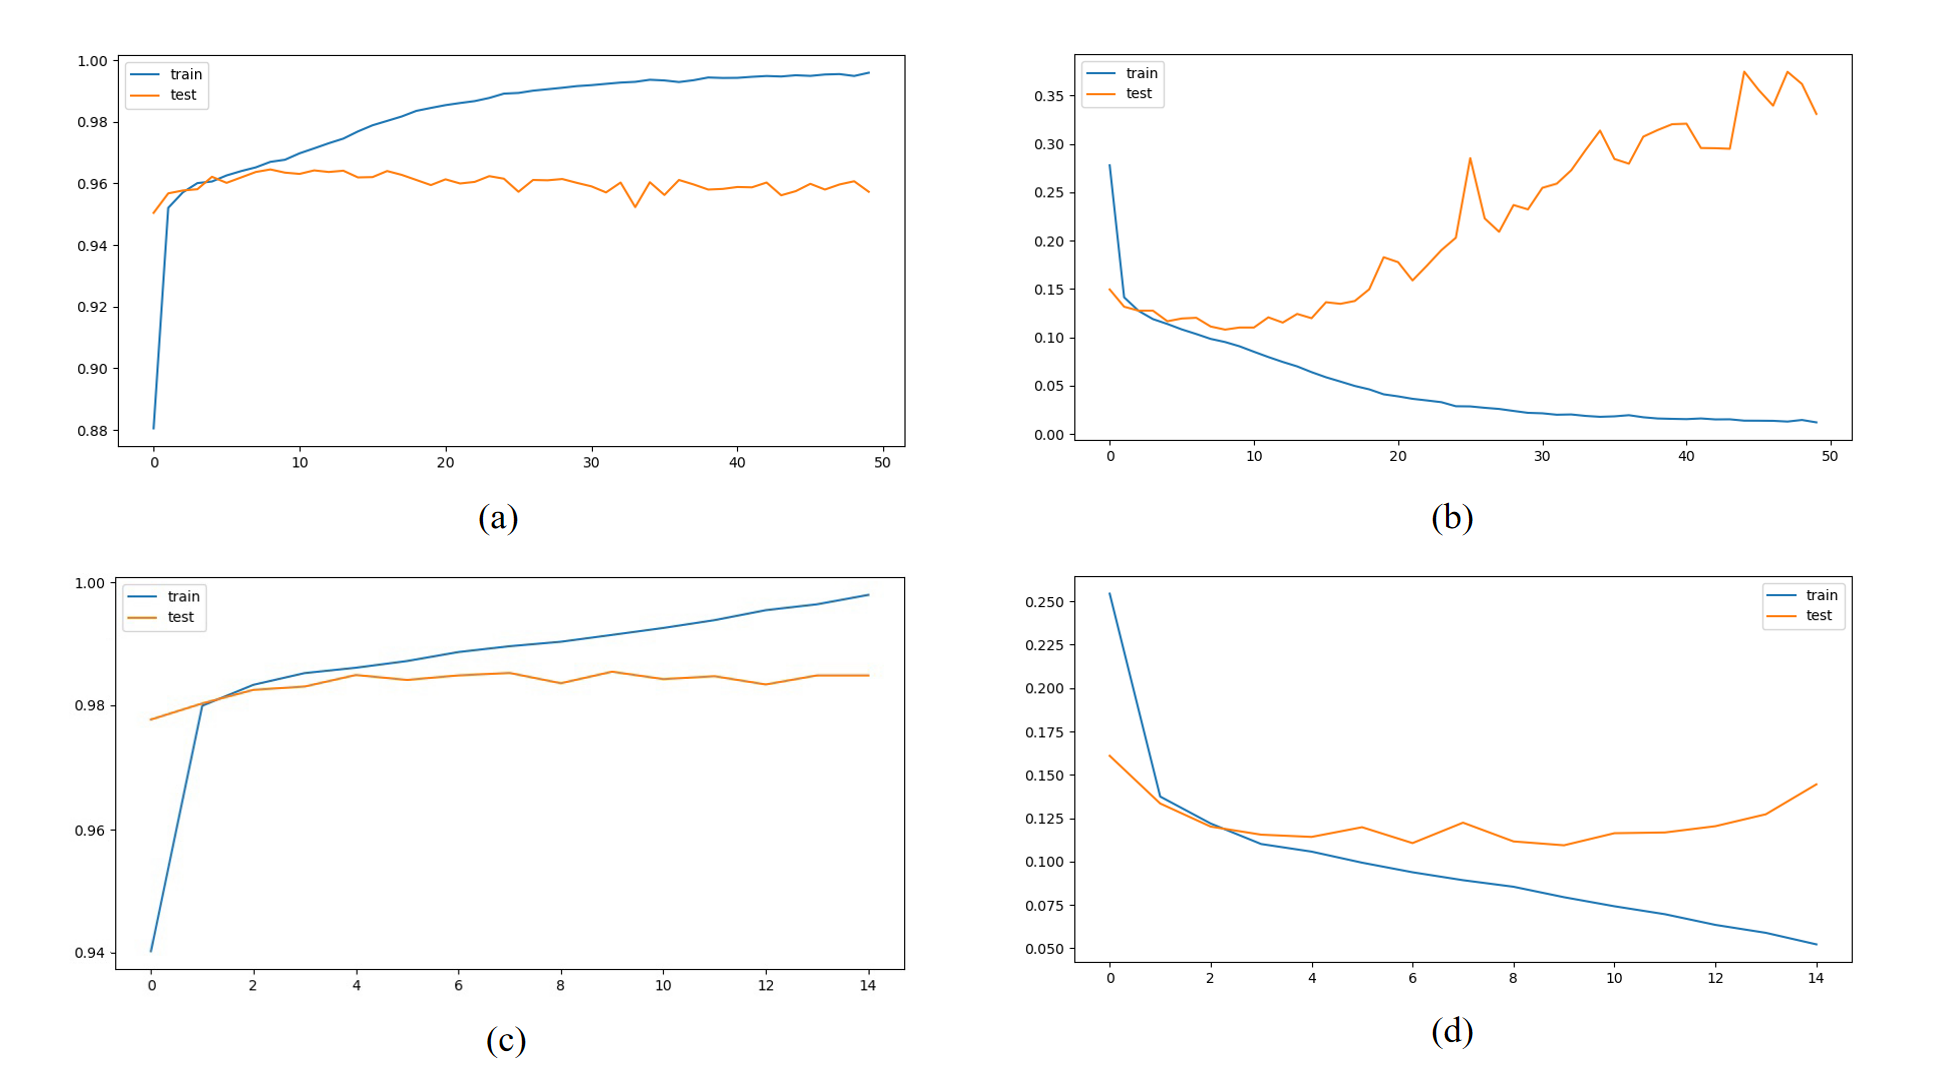
Figure 5. Accuracy and Loss curves for CNN models. (a) Basic CNN model Acc curve. (b) Basic CNN model Loss curve. (c) Optimised CNN model Acc curve. (d) Optimised CNN model Loss curve.
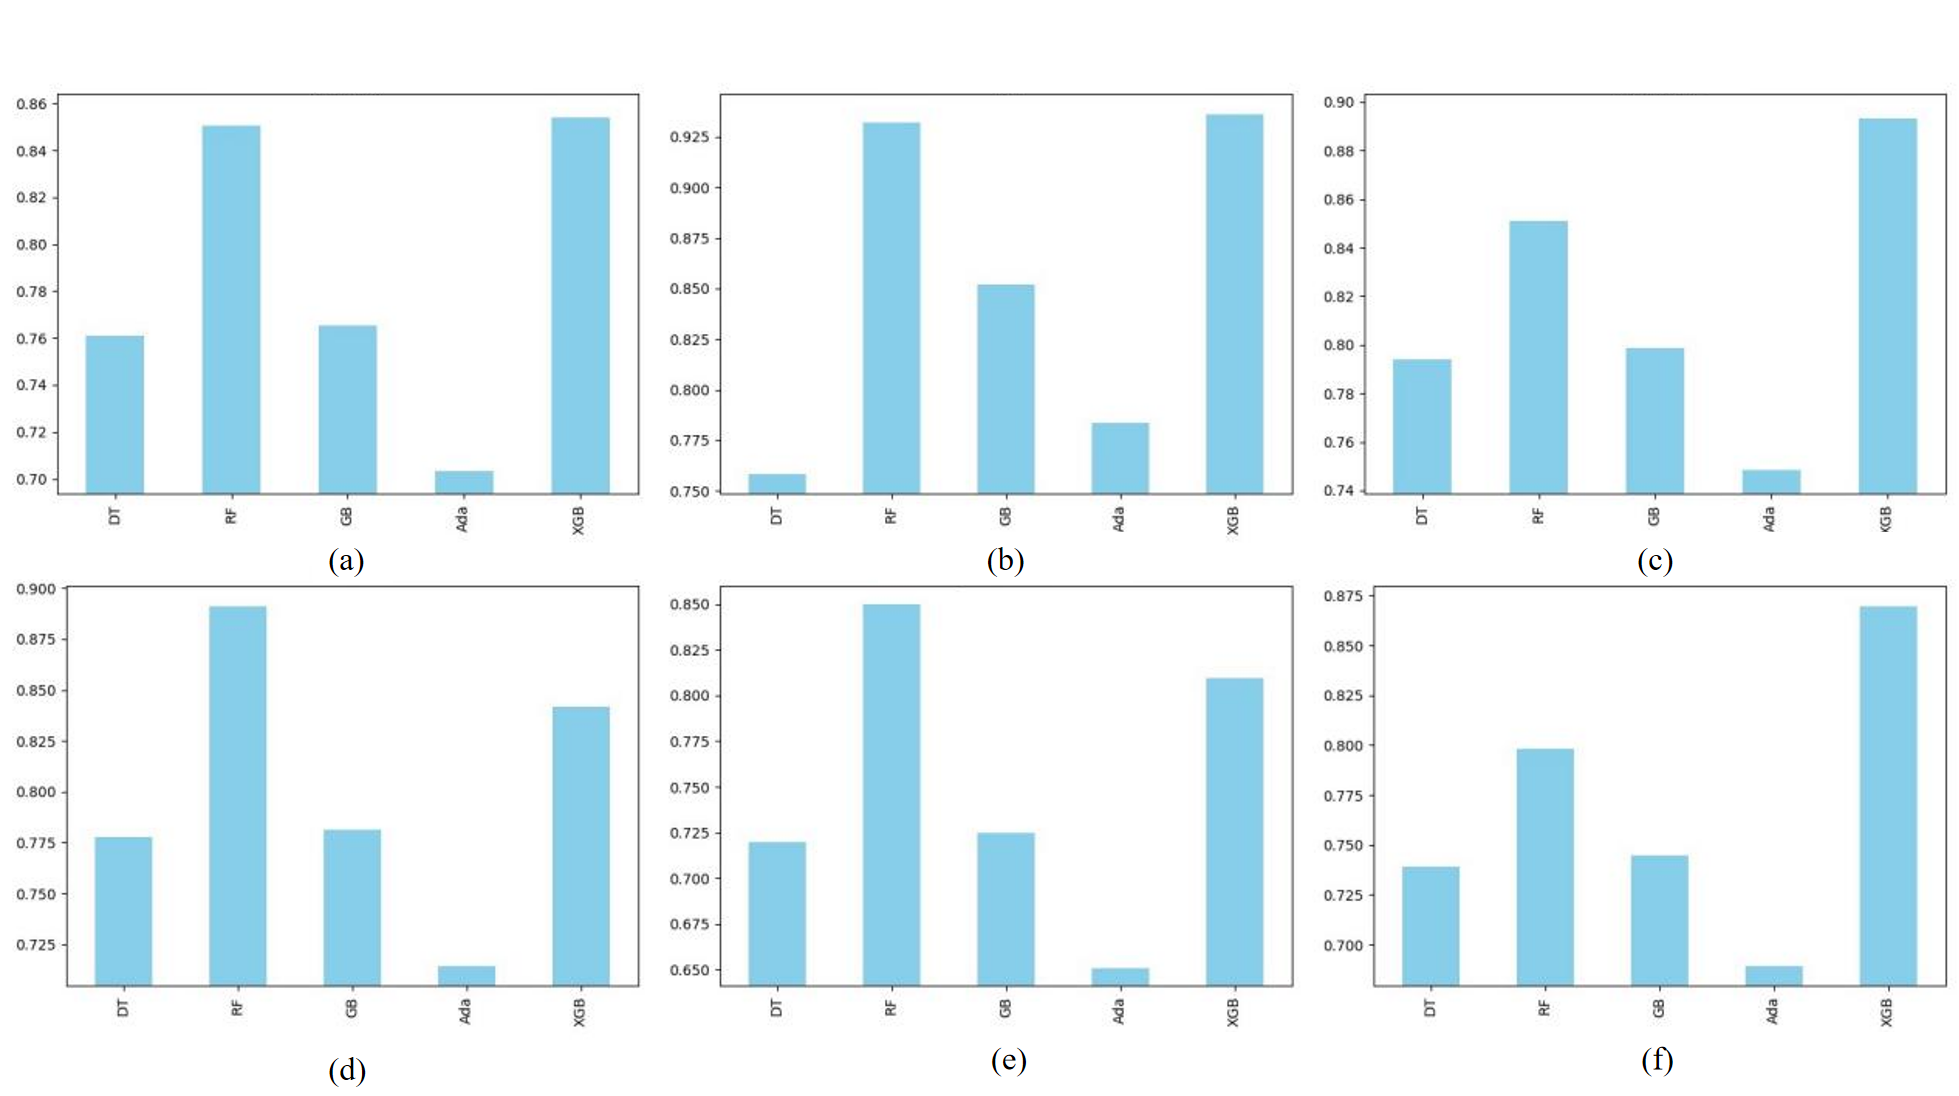
Figure 6. Integrated learning models metrics. (a)Accuracy of models. (b)AUC of models. (c)Precision_1 of models. (d)Recall_1 of models. (e) Precision_0 of models. (f) Recall_0 of models.
The traditional integrated learning model lags behind a considerable part of the CNN model in terms of its effectiveness on image data. On the other hand, the time cost of this model is higher than the CNN due to the fact that it is more expensive than the CNN in terms of the need to apply averaging channels to the dataset and spreading it to two dimensions (Figure 6).
Table 1. Comparison of experimental results.
Models | Acc/% | Loss | AUC/% | P1/% | R1/% | F1_1/% | P0/% | R0/% | F1_0/% |
DT | 76.09 | / | 75.84 | 79.42 | 77.78 | 78.59 | 71.99 | 73.91 | 72.93 |
RF | 85.05 | / | 93.21 | 85.10 | 89.10 | 87.06 | 84.98 | 79.80 | 82.31 |
GB | 76.54 | / | 85.19 | 79.86 | 78.11 | 78.98 | 72.45 | 74.50 | 73.46 |
Ada | 70.35 | / | 78.35 | 74.86 | 71.44 | 73.11 | 65.09 | 68.93 | 66.96 |
XGB | 85.39 | / | 93.60 | 89.32 | 84.18 | 86.67 | 80.94 | 86.96 | 83.84 |
Basic CNN model | 95.58 | 0.17 | 98.24 | 96.97 | 95.21 | 96.08 | 93.83 | 96.08 | 94.94 |
Optimised CNN model | 98.29 | 0.12 | 99.11 | 96.75 | 96.43 | 96.74 | 95.26 | 96.10 | 95.68 |
Table 1 details the evaluation metrics of each model, and it can be found that the optimised models basically have improved in each metric compared to either the integrated learning model or the base CNN model. In particular, compared with the integrated learning models, the models used in this study generally had higher accuracy, AUC, precision, recall and F1 score. The Acc of this study was 0.9829, which is a one percent improvement over the 0.9721 of previous studies [9]. And the AUC reaches 0.9911, which is close to 1. This indicates that the CNN-based method is able to identify malaria-infected erythrocytes more accurately. These metrics collectively indicate that the models converged better during training and were able to achieve more precision and more stable performance in predicting both positive and negative cases.
There are some limitations in the present study. The presentation of cells at various stages of Plasmodium infection varies, so, a large amount of relevant and multi-modality data with annotations are needed to test the algorithm and enrich its performance further.
4. Conclusion
Rapid and accurate diagnosis of malaria is still a big headache, this study proposed a CNN-based model for malaria cell detection, providing an algorithm that can automatically identify and detect the cells. It was found that the accuracy of the algorithm in the paper reached 96.29%, and the AUC was even as high as 99.11%, which can achieve a better performance with a lower risk of wrong and missed detection. The method was also more convenient and faster than manual work. It is worth mentioning that the threshold of the method provided by this study is also lower in the face of the uneven quality of field operators. It also reduces the requirements for the original image, which is of some practical significance.
References
[1]. World Health Organization 2023 World malaria report (Geneva)
[2]. Liu Q 2021 An improved algorithm for malaria blood smear detection based on Faster R-CNN Comput. Tech. Dev. 31 61-6
[3]. Pang Yanan, Zheng Bin and Lei Suwen 2022 Criteria Tracking Evaluation of Malaria Diagnosis (WS259-2015) Chn. Health Stand. Manag. 13 1-4
[4]. Mohanad M, Henry M, Bernard O and Murtada K E 2018 Using stacking ensemble for microarray-based cancer classification International Conference on Computer, Control, Electrical, and Electronics Engineering 1-8
[5]. Tan Y, Zhao Yand Zhao G 2021 Deep learning-based diagnosis of Parkinson's disease Comput. Eng. Design 42 2334-40
[6]. Yang F, Poostchi M, Yu H, Zhou Z, Silamut K, Yu J, Maude RJ, Jaeger S and Antani S 2024 Deep Learning for Smartphone-Based Malaria Parasite Detection in Thick Blood Smears IEEE J. Biomed. Health. Inform. 24 1427-38
[7]. Li B and Yan H 2024 Intrusion Detection Models Based on Integrated Learning J. N. Chn. Univ. Sci. Tech. 46 122-132
[8]. Luque-Fernandez M A, Daniel R S, Maringe C, et al 2019 Cauroc:Command to compute cross validated area under the curve for ROC analysis after predictive modeling for binary outcomes Stata J. 19 615-25
[9]. Jameela T, Athotha K, Singh N, Gunjan V K and Kahali S 2022 Deep Learning and Transfer Learning for Malaria Detection Comput. Intell. Neurosci. 2221728
Cite this article
Yu,X. (2024). Development and validation of a CNN-based model for Malaria Cell Detection. Applied and Computational Engineering,67,41-48.
Data availability
The datasets used and/or analyzed during the current study will be available from the authors upon reasonable request.
Disclaimer/Publisher's Note
The statements, opinions and data contained in all publications are solely those of the individual author(s) and contributor(s) and not of EWA Publishing and/or the editor(s). EWA Publishing and/or the editor(s) disclaim responsibility for any injury to people or property resulting from any ideas, methods, instructions or products referred to in the content.
About volume
Volume title: Proceedings of the 2nd International Conference on Software Engineering and Machine Learning
© 2024 by the author(s). Licensee EWA Publishing, Oxford, UK. This article is an open access article distributed under the terms and
conditions of the Creative Commons Attribution (CC BY) license. Authors who
publish this series agree to the following terms:
1. Authors retain copyright and grant the series right of first publication with the work simultaneously licensed under a Creative Commons
Attribution License that allows others to share the work with an acknowledgment of the work's authorship and initial publication in this
series.
2. Authors are able to enter into separate, additional contractual arrangements for the non-exclusive distribution of the series's published
version of the work (e.g., post it to an institutional repository or publish it in a book), with an acknowledgment of its initial
publication in this series.
3. Authors are permitted and encouraged to post their work online (e.g., in institutional repositories or on their website) prior to and
during the submission process, as it can lead to productive exchanges, as well as earlier and greater citation of published work (See
Open access policy for details).
References
[1]. World Health Organization 2023 World malaria report (Geneva)
[2]. Liu Q 2021 An improved algorithm for malaria blood smear detection based on Faster R-CNN Comput. Tech. Dev. 31 61-6
[3]. Pang Yanan, Zheng Bin and Lei Suwen 2022 Criteria Tracking Evaluation of Malaria Diagnosis (WS259-2015) Chn. Health Stand. Manag. 13 1-4
[4]. Mohanad M, Henry M, Bernard O and Murtada K E 2018 Using stacking ensemble for microarray-based cancer classification International Conference on Computer, Control, Electrical, and Electronics Engineering 1-8
[5]. Tan Y, Zhao Yand Zhao G 2021 Deep learning-based diagnosis of Parkinson's disease Comput. Eng. Design 42 2334-40
[6]. Yang F, Poostchi M, Yu H, Zhou Z, Silamut K, Yu J, Maude RJ, Jaeger S and Antani S 2024 Deep Learning for Smartphone-Based Malaria Parasite Detection in Thick Blood Smears IEEE J. Biomed. Health. Inform. 24 1427-38
[7]. Li B and Yan H 2024 Intrusion Detection Models Based on Integrated Learning J. N. Chn. Univ. Sci. Tech. 46 122-132
[8]. Luque-Fernandez M A, Daniel R S, Maringe C, et al 2019 Cauroc:Command to compute cross validated area under the curve for ROC analysis after predictive modeling for binary outcomes Stata J. 19 615-25
[9]. Jameela T, Athotha K, Singh N, Gunjan V K and Kahali S 2022 Deep Learning and Transfer Learning for Malaria Detection Comput. Intell. Neurosci. 2221728