


1. Introduction
The theory of the music recommendation system includes a series of algorithms, and the role of these algorithms is to predict users’ potential preferences for songs belonging to a specific field. After that, songs that are predicted from the existing knowledge of users’ potential preferences are recommended to users. The recommendation system is a filtering system. The purpose of it is to predict the preference that a user would give to a particular element, which, in this case, is a song [1]. These systems are the central component of streaming music applications such as Spotify and YouTube. The music recommendation system is based on the content (recommendations based on content similarity) or the users’ personality preferences. When using a streaming music service, users can add songs they like or dislike and create personal playlists. Content-based recommendation systems extract keywords from the user's favorite song descriptions and compare the keywords with other songs, finally recommending similar songs to users based on this information. It assumes that if user A and user B express similar preferences, similar songs can be recommended to them, meaning that if user A likes a particular song, it is likely that this song will also appeal to user B and vice versa [1].
The music recommendation system uses machine learning technology to recommend music to users in an intelligent way, thus meeting the personalized needs of users. The machine learning models behind these systems can make music recommendations based on information such as a user's history, musical characteristics, and more. Machine learning can capture user preferences and interest points by analyzing user playback history, search records, favorites, and song-cutting behaviors. This data allows the model to predict new songs or artists that users are likely to like. The collaborative filtering approach to recommendation algorithms involves collecting a “large amount of information on users’ behaviors, activities or preferences and predicting what users will like based on their similarity to other users” [2]. The content-based filtering approach differs from the collaborative filtering approach as it filters based on an analysis of both the item being recommended and the user [2].
This article introduces the basic principles and applications of principal component analysis (PCA) and K-means clustering, two machine learning technologies, and highlights the important role of machine learning in building a successful music recommendation system through the practical application of these two methods in music recommendation systems. The research question is to explore how these algorithms can assist in processing and simplifying complex Spotify data sets to more accurately match users to their preferred music. The significance of the research is that through the good application of PCA and K-means clustering, the recommendation system can more effectively identify the user's music preferences, optimize the content management of the music platform, and promote the user's personalized experience. Based on the important role of PCA and K-means clustering in modern digital music recommendation services, and looking forward to the combination of these technologies and large-scale data sets, the future music recommendation system will be fully improved and have the ability of sustainable development.
2. Overview of principal component analysis and K-means clustering
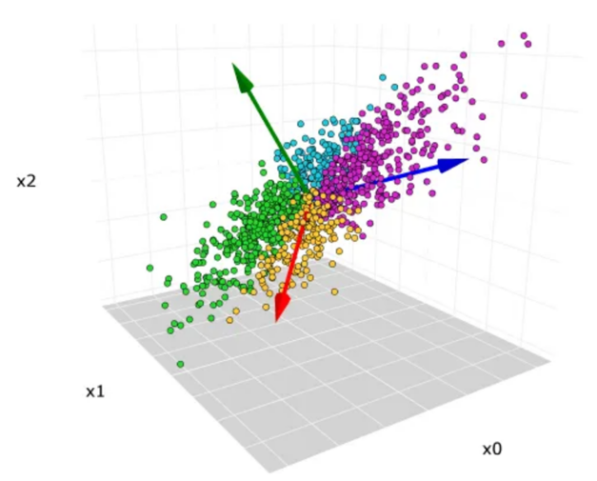
Principal component analysis (PCA) is a statistical technique used to find patterns in high-dimensional datasets and transform these datasets into a new coordinate system with maximum variance (see Figure 1). In short, if the characteristics of every dataset are distinct or the extent is huge, people usually need to standardize the datasets at first. The standardization of the datasets is set: the mean value of each feature is zero, and the variance is one. After that, the covariance matrix between every feature is calculated. The covariance matrix reveals the linear relationship between different characteristics. The positive covariance means the relationship between features is positive, the negative covariance means the relationship between features is negative, and zero covariance shows the independence between the features. Then, decompose the covariance matrix, and a group of eigenvalues and corresponding eigenvectors can be obtained. The raw data are reflected in the core component to produce a new set of features called the principal component score. These scores are represented by the new coordinates system. PCA technique reduces the number of variables of a data set while preserving as much information as possible [3].
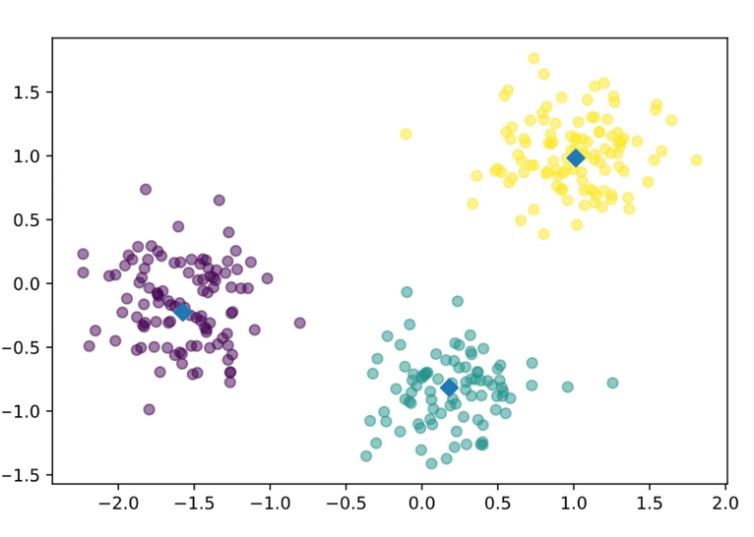
Different from the PCA technique, K-means clustering is a method for grouping observations into K clusters (see Figure 2). It can be understood as a group of users or groups of songs that have similar preferences based on certain musical characteristics. The recommendation system achieves its effect by analyzing users' listening history and preferences, and K-means can gather users with similar listening preferences together and recommend songs that other users in this group like to a certain group of users. K-means clustering uses vector quantization and aims to assign each observation to the cluster with the nearest mean or centroid, which serves as a prototype for the cluster [4]. K-means is a regular algorithm from the clustering method, it divides the data into different clusters (the number of clusters is decided) and the points inside the cluster are very similar. First, n data points are randomly selected as K as the initial cluster center (centroids), and then each data point is assigned to the nearest cluster center, that is, each data point is distributed to the cluster with the closest distance from the cluster center. Calculate the new center of each cluster, usually the average of all points inside the cluster, and this new point becomes the new center of the cluster. The allocation and update steps are repeated several times and stop until it meets a stop condition, like the change in the cluster center is less than a certain boundary, or a predetermined number of iterations is reached.
|
|
Figure 1. The PCA graph. | Figure 2. The K-means graph. |
3. Methodology
3.1. Dimensionality reduction (PCA)
The music recommendation system first uses principal component analysis (PCA) to reduce the dimensionality of the data set. Spotify tracks have a variety of characteristics, such as loudness, liveness, energy, and instrumentalness. Figure 3 shows the relationship between various variables and the dependent variable popularity.
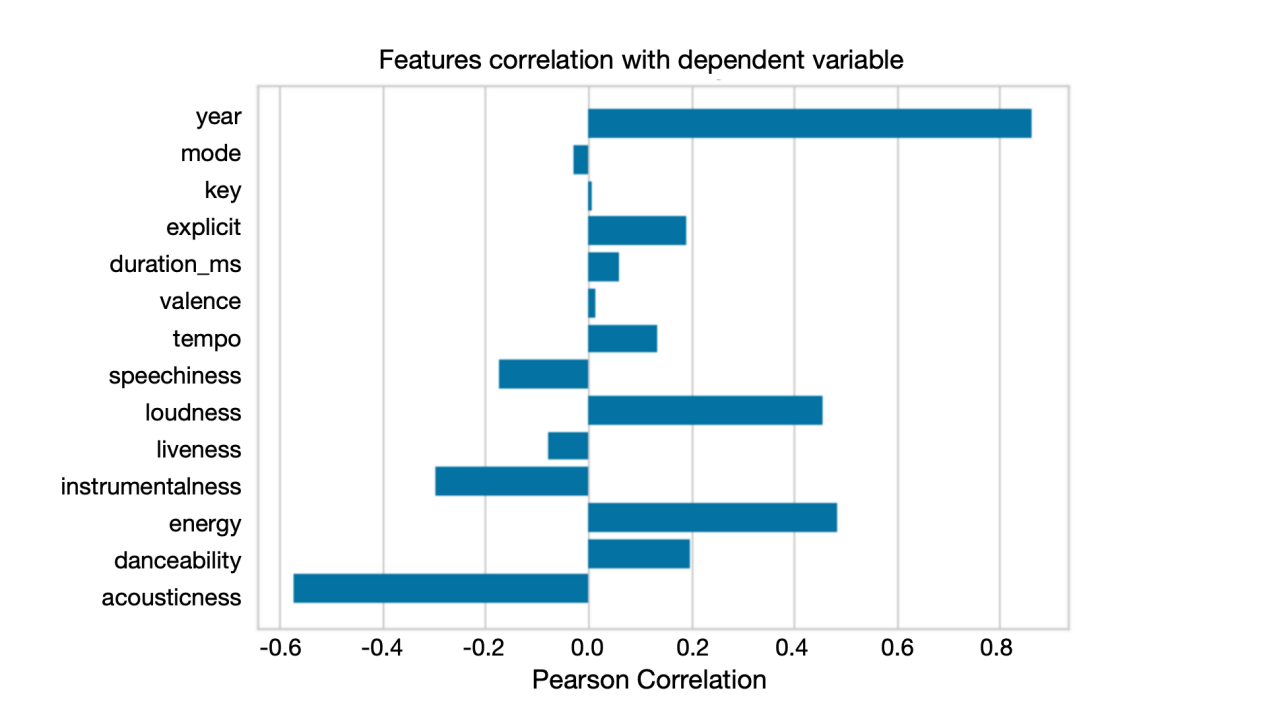
Figure 3. Feature correlation.
From Figure 3, the linear relationship strength between popularity and these variables can be simply understood. For example, for the variable energy, the bar image to the right indicates that energy has a positive relationship with the popularity of the song, and the relatively long bar length means that the correlation between the two variables is strong. While providing information, the model can be complicated due to their number and interrelationships. This is only a dependent variable between these variables and popularity. The data analysis involved in the music recommendation system is more complex and the data sets are difficult to process. Therefore, PCA is applied to reduce the dimension of the data set, retain most of the changes in all original variables, and retain the basic features of music tracks for data set simplification. By eliminating the least important components, PCA reduces noise in the data, leading to more robust and accurate models [5]. PCA tackles the issue of collinearity, where two or more features are highly correlated. It transforms the original features into orthogonal components, thereby improving the model's stability [5]. PCA allows data to be visualized in two dimensions, such as projecting data onto the most important variables, intuitively evaluating changes in the data set, and observing how different types of songs are positioned and distributed. In order to achieve this goal, there is a need to standardize the data set first, as mentioned in the PCA introduction, with mean value set to 0 and variance set to 1.
3.2. Cluster analysis (K-means)
The song groups with similar characteristics in K groups can be identified through k-means clustering and K cluster selection. However, choosing the proper value of k is not easy. The range of clusters is restricted to be small [6]. This also helps to recommend new tracks to users based on their listening history and personal preferences. For example, if a user regularly listens to songs from a particular cluster, the system can recommend other songs from the same cluster, enhancing the user's music experience on Spotify.
Code:
song_cluster_pipeline = Pipeline([('scaler', StandardScale()),
('kmeans', KMeans(n_clusters=20, verbose=False, n_jobs=4)) ], verbose=False)
X = data.select_dtypes(np.number)
number_cols = list(X.columns)
song_cluster_pipeline.fit(X)
song_cluster_labels = song_cluster_pipeline.predict(X)
data['cluster_label'] = song_cluster_labels
from sklearn.decomposition import PCA
pca_pipeline = Pipeline([('scaler', StandardScaler()), (' PCA', PCA(n_components=2))])
song_embedding = pca_pipeline.fit_transform(X)
projection = pd.DataFrame(columns=['x', 'y'], data=song_e mbedding)
projection['title'] = data['name']
projection['cluster'] = data['cluster_label']
The code is combined with PCA reduction and K-means clustering analysis so that the music recommendation system can effectively deal with the complexity of Spotify data sets and provide users with personalized song recommendations. When building the music recommendation system, the K-means clustering algorithm is used to segment the data sets into K groups of coherent groups with similar music characteristics. The pre-processing phase uses StandardAero to normalize the feature space, ensuring that each variable contributes equally to the distance calculation. Once the data set used is normalized, the k-means algorithm is called and the data set is divided into 20 different clusters (K=20 as we know from clusters=20 in the source code). The choice of the number of clusters expressed as K is a key parameter that assigns each song in the data set a cluster label indicating its group membership. The scatterplot generated after the analysis illustrates the data divided in a reduced two-dimensional space by PCA. As a preliminary step of dimensionality reduction data, PCA acquires the variance of the intrinsic structure of the data set. Songs are drawn according to two main components and color-coded according to assigned clusters for easy observation. The distribution of songs across clusters shows the validity of the clustering process. The K-means algorithm simplifies the complexity of multi-dimensional data and makes the recommendation match with the user's personal preference to realize the purpose of the music recommendation system. It can be seen that K-means cluster analysis is a critical step in a music analysis system that supports the goal of providing personalized music recommendations.
4. Outcome analysis
4.1. Interpretation of the image of clustering genres
The code in Figure 5 generates an image of Clustering Genres. The simple K-means clustering algorithm is used to divide the genres in this dataset into ten clusters based on the numerical audio features of each genre [7]. The code section creates a processing pipeline that first standardizes the music data set using StandardScaler. StandardScaler will transform each value in the column to range about the mean 0 and standard deviation 1, and each value will be normalized by subtracting the mean and dividing by the standard deviation [8]. The K-Means clustering algorithm was then applied to divide the data into 10 different clusters. The next part of the code is about visualizing the clustering results using the t-SNE (T-Distributed Stochastic Neighborhood Embedding) technique. t-SNE is an unsupervised non-linear dimensionality reduction technique for data exploration and visualizing high-dimensional data. Non-linear dimensionality reduction means that the algorithm allows us to separate data that cannot be separated by a straight line [9]. t-SNE is an effective technique for nonlinear dimensionality reduction, especially for mapping high-dimensional data into two-dimensional or three-dimensional space, so that data visualization can be done at the genres.
Code:
from sklearn.cluster import KMeans
from sklearn.preprocessing import StandardScaler
from sklearn.pipeline import Pipeline
cluster_pipeline = Pipeline([('scaler', StandardScaler()), ('kmeans', KMeans(n_clusters=10, n_jobs=-1))])
X = genre_data.select_dtypes(np.number)
cluster_pipeline.fit(X)
genre_data['cluster'] = cluster_pipeline.predict(X)
from sklearn.manifold import TSNE
tsne_pipeline = Pipeline([('scaler', StandardScaler()), ('tsne', TSNE(n_components=2, verbose=1))])
genre_embedding = tsne_pipeline.fit_transform(X)
projection = pd.DataFrame(columns=['x', 'y'], data=genre_embedding)
projection['genres'] = genre_data['genres']
projection['cluster'] = genre_data['cluster']
fig = px.scatter(
projection, x='x', y='y', color='cluster', hover_data=['x', 'y','genres'])
fig.show()
The t-SNE transformed data points that are represented in different colors according to the clustering results can be seen in the scatter plot shown in Figure 6. This visualization helps to visually show clusters and patterns in the data, and the aggregation of data points in the graph indicates that they are close to each other in a high-dimensional space. The color of each cluster represents a group of songs with similar characteristics, and users may receive a push of songs from the same cluster. For example, it can be observed that a particular music genre ("British indie rock "as shown in the pop-up message) is often located in a particular cluster, which represents similar musical characteristics or user preferences.
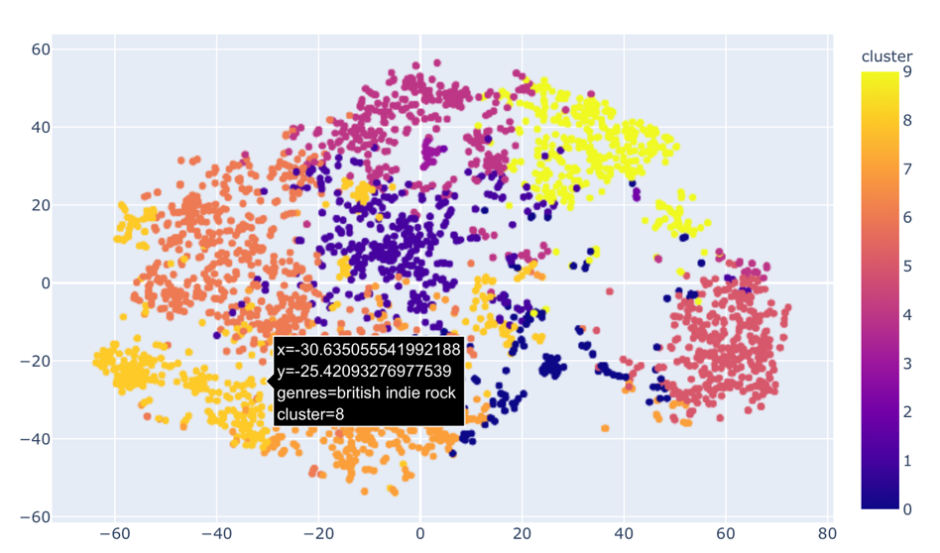
Figure 4. Clustering genres.
4.2. Interpretation of the image of clustering songs
The code shown in Figure 4 consists of two-step machine learning, which first normalizes the data and then applies the K-means algorithm for clustering. The K value chosen here is 20, meaning that the algorithm divides the data into 20 clusters. The code fits the data, each song is assigned a clustering label, and the song is categorized into one of 20 clusters. The visualization section shows the data points after dimensionality reduction with PCA.
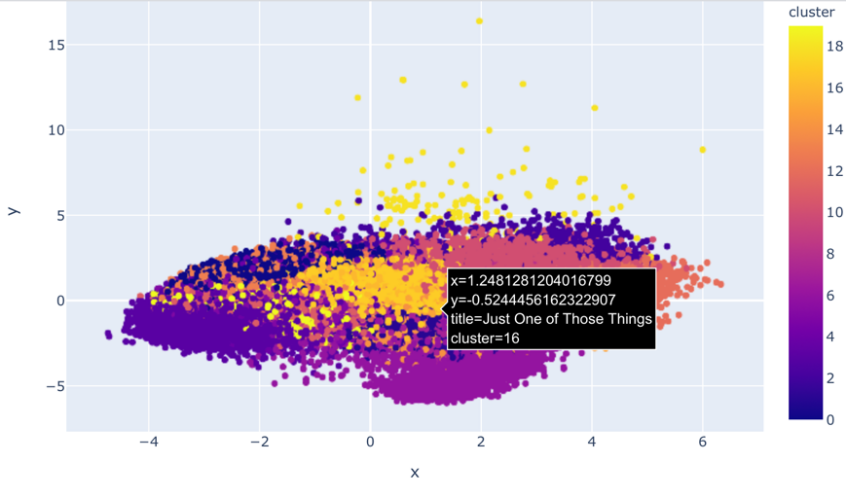
Figure 5. Clustering songs.
Figure 5 shows the results of clustering using the K-means algorithm after dimensionality reduction using PCA. Different colored dots represent songs assigned to different clusters. A concrete example is provided in the image: a song called "Just One of Those Things", located at coordinates (-2.548, 11.662), is grouped into cluster 16. In this scatter plot, the horizontal (x) and vertical (y) axes represent the two principal components transformed by PCA, which are the most important sources of variance in the original data. The depth of the color and the density of the points within the cluster can infer which songs are more similar in features. For example, dense areas represent collections of songs with very similar musical characteristics, and according to "Just One of Those Things," the color of the cluster where the song is located is dark blue, which represents similar rhythms, soundness, or other musical characteristics. The specific features can be referred to as the variables shown in Figure 3. If we know that a user likes a song in this cluster, then the music recommendation system will recommend other songs in this cluster to this user, because this is in line with the user's personal preferences of the song, which can be seen as an effective recommendation. Figure 3 helps to understand the relationship between user preferences and music characteristics and is an important part of the music recommendation system.
5. Conclusion
This paper explored the practical application of machine learning technology in the music recommendation system and demonstrated the relationship between the music recommendation system and machine learning technology by using the data set provided by Spotify and applying PCA and K-means clustering algorithms. In a music recommendation system, PCA, as a basic dimensionality reduction step, enables the K-means algorithm to perform efficiently, clustering songs into different groups with common musical characteristics and recommending them to users with corresponding interests. The combination of these two methods improves the prediction accuracy and recommendation relevance of the recommendation system. The generated visual image is used as an auxiliary tool to demonstrate the importance of the machine learning method in the music recommendation system. This study shows the mechanisms behind a complex music recommendation engine, highlighting the large role machine learning plays in building a successful music recommendation system. As time advances, the convergence of sophisticated machine learning algorithms and massive data sets like Spotify bodes well for the future of digital music recommendation systems or other services.
References
[1]. Serhii, R. and Hasiuk, N. (2022). Music Recommendation System: All You Need to Know. Eliftech. https://www.eliftech.com/insights/all-you-need-to-know-about-a-music-recommendation-system-with-a-step-by-step-guide-to-creating-it/.
[2]. Srebrenik, B. (2018). Introduction to Music Recommendation and Machine Learning. Medium. https://medium.com/@briansrebrenik/introduction-to-music-recommendation-and-machine-learning-310c4841b01d.
[3]. Jaadi, Z. (2021). A step-by-step explanation of principal component analysis (PCA). Retrieved June, 7(2021), 470.
[4]. Khandelwal, S. (2019). Comprehensive Guide on K-Means Clustering. Analytics Vidhya.
[5]. Terenceshin. (2020). PCA on a Random Forest Classifier with GridSearchCV. Kaggle.
[6]. Arthur, D.and Vassilvitskii, S. (2007). k-means++: The advantages of careful seeding. In Soda (7), 1027-1035.
[7]. Mavani, V. (2021). Music Recommendation System Using Spotify Dataset. Kaggle.
[8]. Lindon. (2018). Difference between Standard Scaler and MinMaxScaler. Stack Overflow.
[9]. Van der Maaten, L. and Hinton, G. (2008). Visualizing data using t-SNE. Journal of machine learning research, 9(11), 2579-2605.
Cite this article
Li,X. (2024). Analysis of machine learning-based music recommendation system using Spotify datasets. Applied and Computational Engineering,77,49-55.
Data availability
The datasets used and/or analyzed during the current study will be available from the authors upon reasonable request.
Disclaimer/Publisher's Note
The statements, opinions and data contained in all publications are solely those of the individual author(s) and contributor(s) and not of EWA Publishing and/or the editor(s). EWA Publishing and/or the editor(s) disclaim responsibility for any injury to people or property resulting from any ideas, methods, instructions or products referred to in the content.
About volume
Volume title: Proceedings of the 2nd International Conference on Software Engineering and Machine Learning
© 2024 by the author(s). Licensee EWA Publishing, Oxford, UK. This article is an open access article distributed under the terms and
conditions of the Creative Commons Attribution (CC BY) license. Authors who
publish this series agree to the following terms:
1. Authors retain copyright and grant the series right of first publication with the work simultaneously licensed under a Creative Commons
Attribution License that allows others to share the work with an acknowledgment of the work's authorship and initial publication in this
series.
2. Authors are able to enter into separate, additional contractual arrangements for the non-exclusive distribution of the series's published
version of the work (e.g., post it to an institutional repository or publish it in a book), with an acknowledgment of its initial
publication in this series.
3. Authors are permitted and encouraged to post their work online (e.g., in institutional repositories or on their website) prior to and
during the submission process, as it can lead to productive exchanges, as well as earlier and greater citation of published work (See
Open access policy for details).
References
[1]. Serhii, R. and Hasiuk, N. (2022). Music Recommendation System: All You Need to Know. Eliftech. https://www.eliftech.com/insights/all-you-need-to-know-about-a-music-recommendation-system-with-a-step-by-step-guide-to-creating-it/.
[2]. Srebrenik, B. (2018). Introduction to Music Recommendation and Machine Learning. Medium. https://medium.com/@briansrebrenik/introduction-to-music-recommendation-and-machine-learning-310c4841b01d.
[3]. Jaadi, Z. (2021). A step-by-step explanation of principal component analysis (PCA). Retrieved June, 7(2021), 470.
[4]. Khandelwal, S. (2019). Comprehensive Guide on K-Means Clustering. Analytics Vidhya.
[5]. Terenceshin. (2020). PCA on a Random Forest Classifier with GridSearchCV. Kaggle.
[6]. Arthur, D.and Vassilvitskii, S. (2007). k-means++: The advantages of careful seeding. In Soda (7), 1027-1035.
[7]. Mavani, V. (2021). Music Recommendation System Using Spotify Dataset. Kaggle.
[8]. Lindon. (2018). Difference between Standard Scaler and MinMaxScaler. Stack Overflow.
[9]. Van der Maaten, L. and Hinton, G. (2008). Visualizing data using t-SNE. Journal of machine learning research, 9(11), 2579-2605.