


1. Introduction
Customer churn is one of the challenges faced by enterprises for a long time, so the prediction and management of customer churn has been widely concerned. Data mining technology, as an effective tool, provides enterprises with the ability to analyze large-scale data and find signs of potential customer churn. This paper aims to use data mining technology to explore and analyze the data of customer churn in order to provide powerful decision support.
In this study, we first define the concept of customer churn, and comb the related research and theory. We then collected a real data set on customer churn and pre-processed and cleaned it to ensure accuracy and consistency.
Next, we use data mining techniques, including comparative analysis and factor analysis, to analyze the customer churn data. Through feature selection and model training, we successfully construct a customer churn prediction model, which can accurately predict whether customers will churn.
Finally, based on the analysis results of customer churn data, we put forward a series of business strategies and suggestions to help enterprises effectively manage customer churn. These strategies involve improving customer relationship management, providing personalized services and customized marketing activities, so as to reduce customer turnover and increase the profitability of enterprises.
Revised sentence: The primary challenge lies in distinguishing between temporarily idle customers and those who are defecting to competitors. “Historical data can be analyzed to identify distinct purchasing patterns among customers, such as frequency of shopping or seasonal buying habits” [3]. However, extended periods of inactivity may indicate potential churn and accurately predicting which customers are at risk is crucial for marketing teams seeking to boost business profits. “This study presents a practical survival framework that utilizes recurrent neural network parameters to generate individual-level survival models based solely on the behavior of each consumer, eliminating the need for time-consuming feature engineering during machine learning model training” [4].
In conclusion, this study demonstrates the potential of data mining in customer churn prediction and management, and provides a powerful decision-making basis for enterprises. Future research can further explore more data mining techniques and methods to improve the accuracy and practicability of customer churn prediction models.
2. Data mining
Data mining is a process of learning and extracting useful information from large data sets. Data mining focuses on discovering interesting structures or patterns hidden in large amounts of raw data, which may be used for activities such as user research, market analysis, and technology trend analysis.
The significance of data mining lies in exploring the hidden knowledge of data. The use of big data technology can automatically discover the patterns, trends, associations, and structures stored in the data, helping people develop effective data support applications. Data mining can help make more effective decisions, provide information and guidance, and thus improve decision-making and problem solving. The development of data mining technology will further strengthen the internal and external activities of enterprises, can better manage the enterprise process, and help managers better organize and run the enterprise and manage the performance of the team.
We will use the method of data mining to analyze the data set of customer churn. Data mining has some advantages and disadvantages. First, data mining can better manage customer relationships, which is one of the main advantages of data mining, and it can also help enterprises understand how to use different types of products to disengage different types of customers. This guarantees the sale of goods. Second, data mining can predict market trends, it can predict the products that customers are interested in, and help companies decide which types of products to bring to market. Then, data mining can help a company stay ahead of the competition, because they have the most information, which helps them win over their competitors in the information gap, and data mining has great advantages in product personalization. Finally, data mining can ensure the security of critical data, such as data anonymization, access control, and so on.
However, data mining also has many disadvantages. Data mining may violate the privacy of users, which is an unethical behavior. However, data mining will also lack accuracy and accuracy, and wrong processing will produce wrong data, which is harmful to the development of the company.
In the era of big data, it is not easy to find the data needed. Therefore, data mining is an excellent way to optimize and use relevant information. Of course, data mining also has certain limitations, but it is clear that the advantages of data mining outweigh the disadvantages. This is also the reason why this paper chooses to use data mining to analyze the data.
3. Contrastive analysis
The purpose of contrastive analysis is to study the difference between two groups of a certain variable. If the variable is a discrete variable, we only need to use cross tab and chi-square tests. If the variable is continuous, we should first determine whether the variable follows a normal distribution, if it is normally distributed, then use the T test; if it is not normally distributed, then use the non-parametric test.
Next, we will explore the relationship between subscription type and churn and the relationship between usage frequency and churn. Among them, the subscription type is a discrete variable, while the frequency of use is a continuous variable. So, for subscription types, we should use cross tabs and chi-square checks; For the frequency of use, we need to determine whether it is normally distributed and use T test or non-parametric test.
Table 1. Case Processing Summary
Valid | Missing | Total | ||||
N | Percent | N | Percent | N | Percent | |
Churn*SubscriptionType | 64374 | 100% | 0 | 0.0% | 64374 | 100% |
Table 2. Churn*SubscriptionType Crosstabulation
SubscriptionType
1 | 2 | 3 | Total | ||
Churn 0 | Count | 11095 | 11325 | 11461 | 33881 |
%within Churn | 32.7% | 33.4% | 33.8% | 100% | |
%within SubscriptionTyp | 51.7% | 52.7% | 53.5% | 52.6% | |
%of Total | 17.2% | 17.6% | 17.8% | 52.6% | |
1 | Count | 10356 | 10177 | 9960 | 30493 |
%within Churn | 34.0% | 33.4% | 32.7% | 100.0% | |
%within SubscriptionTyp | 48.3% | 47.3% | 46.5% | 47.4% | |
%of Total | 16.1% | 15.8% | 15.5% | 47.4% | |
Total | Count | 21451 | 21502 | 21421 | 64374 |
%within Churn | 33.3% | 33.4% | 33.3% | 100.0% | |
%within SubscriptionTyp | 100.0% | 100.0% | 100.0% | 100.0% | |
%of Total | 33.3% | 33.4% | 33.3% | 100.0% |
Table 3: Chi-square Tests
Value | df | Asymptotic Significance (2-sided) | |
Pearson Chi-Square | 13.6563 | 2 | .001 |
Likelihood Ratio | 13.656 | 2 | .001 |
Linear-by-Linear Association | 13.637 | 1 | <.001 |
N ofValid Cases | 64374 |
a.0 cells (0.0%) have expected countless than 5.
The minimum expected countis 10146.81.
As we can see from the first table, this dataset contains a total of 64,374 sets of data, and the missing data is 0. In Table 2, there is a Churn*Subscription Type Cross tabulation, 0 and 1 in Churn represent customers who lost and customers who did not lose respectively. In the Subscription Type, 1, 2, and 3 represent the basic, standard, and premium subscription categories respectively. So we know that of the customers who didn't lose, 11,095 customers subscribed to basic, 11,325 customers subscribed to standard, and 11,461 customers subscribed to premium. Of the lost customers, 10,356 subscribed to basic, 10,177 to standard, and 9,960 to premium. In total, 21,451 customers subscribed to basic, 21,502 to standard, and 21,421 to premium. In Table 3, we can take 0.05 as the boundary, if it is less than 0.05, there is a significant difference in the subscription categories of the customers who lost and the customers who did not lose. Returning to the Cross tabulation, we can see that when churn is zero, 32.7% of non-churn users subscribe to basic, 33.4% subscribe to standard, and 33.8% subscribe to premium. When churn is 1, 34.0 percent of churn subscribers subscribe to basic, 33.4 percent subscribe to standard and 32.7 percent subscribe to premium. Then we can see that among the customers who do not lose, more people choose to subscribe to the premium; And among the lost customers, more people are willing to subscribe to basic.
Table 4. Data Summary of users
Chun | Slatistic | Std. Error | |||
UsageFrequency | 0 | Mean | 16.04 | .046 | |
95% Confidence Interval for Mean | Lower Bound | 15.95 | |||
Upper Bound | 16.13 | ||||
5% Trimmed Mean | 16.09 | ||||
Medlan | 16.00 | ||||
Varilance | 70.642 | ||||
Std. Devlation | 8.405 | ||||
Minmum | 1 | ||||
Maximun | 30 | ||||
Range | 29 | ||||
Interquartile Range | 14 | ||||
Skewness | -.038 | .013 | |||
Kurtosis | -1.157 | .027 | |||
1 | Mean | 14.01 | .052 | ||
95% Confidence Interval for Mean | Lower Bound | 13.91 | |||
Upper Bound | 14.11 | ||||
5% Trimmed Mean | 13.87 | ||||
Medlan | 14.00 | ||||
Varilance | 83.435 | ||||
Std. Devlation | 9.134 | ||||
Minmum | 1 | ||||
Maximun | 30 | ||||
Range | 29 | ||||
Interquartile Range | 17 | ||||
Skewness | .159 | .014 | |||
Kurtosis | -1.290 | .028 | |||
This table tells us that the average usage frequency of non-churn customers was 16.04, while the average usage frequency of churn customers was 14.01. The mean difference is about 2, that is, users who do not churn have significantly higher frequency of use than those who churn, because their difference is greater than 0.05. The difference is mainly due to the fact that active customers subscribe more premium, while churn customers subscribe more basic.
There are certainly some extremes. For example, among non-churn customers, the lowest usage frequency of the customer is 1, while the highest usage frequency is 30. The minimum value of 1 May be because these customers like the product but do not have much time to use it. Among the lost customers, the lowest frequency of use of customers is also 1, and the highest frequency of use is 30. The maximum frequency of use is 30. What are the necessary reasons that may cause these customers to stop using the product.
Table 5. Tests of Normality
Kolmogorov-Smirnova
Churn | Statistic | df | Sig | |
UsageFrequency | 0 | .074 | 33881 | <.001 |
1 | .105 | 30493 | <.001 | |
a.Lilliefors Significance Correction | ||||
This table can determine whether it is a normal distribution by testing the significance of the loss group and the non-loss group. If it is greater than 0.05, the hypothesis of normal distribution is not rejected. If it is less than 0.05, the normal distribution hypothesis is rejected. So we can see that both of these significance reject the normal distribution hypothesis. Therefore, we need to do a non-parametric test.
Table 6. Hypothesis Test Summary
Nonparametric Tests
Hypothesis Test Summary | ||||
Null Hypothesis | Test | Sig.a.b | Decision | |
1 | The distribution of UsageFrequency is the same across categories of Churn. | Independent-Samples Mann-Whitney U Test | <.001 | Reject the null hypothesis. |
a.The significance level is .050. b.Asymptotic significance is displayed | ||||
In this table, the null hypothesis states that the distribution of user frequency is the same in the churn category. But its significance is small, that is, the decision rejects the null hypothesis. This means that churn customers and non-churn customers do not use the same frequency, and active users have higher usage rates.
Table 7. KMO and Bartlett's Test
Kaiser-Meyer-Olkin Measure ofSampling Adequacy. | .515 | |
Bartlett's Test of Sphericity | Approx. Chi-Square | 549.224 |
df | 6 | |
Sig. | <.001 | |
Table 8. Communalities
Initial | Extraction | |
CustomerlD | 1.000 | .481 |
Age | 1.000 | .419 |
UsageFrequency | 1.000 | .401 |
TotalSpend | 1.000 | .811 |
Extraction Method: Principal ComponentAnalysis. | ||
Table 9. Total Variance Explained
Initial Eigenvalues | Extraction Sums of Squared Loadings | |||||
Component | Total | % of Variance | Cumulative % | Total | % of Variance | Cumulative % |
1 | 1.101 | 27.536 | 27.536 | 1.101 | 27.536 | 27.536 |
2 | 1.011 | 25.278 | 52.814 | 1.011 | 25.278 | 52.814 |
3 | .962 | 24.040 | 76.854 | |||
4 | .926 | 23.146 | 100.000 | |||
Extraction Method: Principal ComponentAnalysis. | ||||||
Both of the methods in the Table 7 can be used to test whether the data is suitable for factor analysis. The KMO in is a kind of test named by Kaiser, Mayer and Olkin, which is used to determine whether there is a significant correlation between variables. Normally, it will give a feedback between 0 and 1, if the value is bigger than 0.5, the variables are correlated. When the value in Bartlett’s Test of Sphericity is less than 0.05, there is a relationship between variables. Therefore, the data is suitable for factor analysis. In the Table 8, it gives out the name of variable, they are respectively Customer ID, Age, Usage Frequency and Total spend. And the value in Extraction means the amount of retained information in each variables after they are compressed into two variables. In the Table 9, these four variables are rearranged according to the amount of information, and the variable which contains the most amount of data will ranked first. Additionally, the variables after rearranging is independent, which can retain as much information as possible. Besides, the % of Variance can be understood as the amount of information to describe a variable, and the Cumulative % accumulates the information of first two variables.
For total variance explained, in four different components, the total initial eigenvalues which in descending arrangement lead to different percentage of several factors.
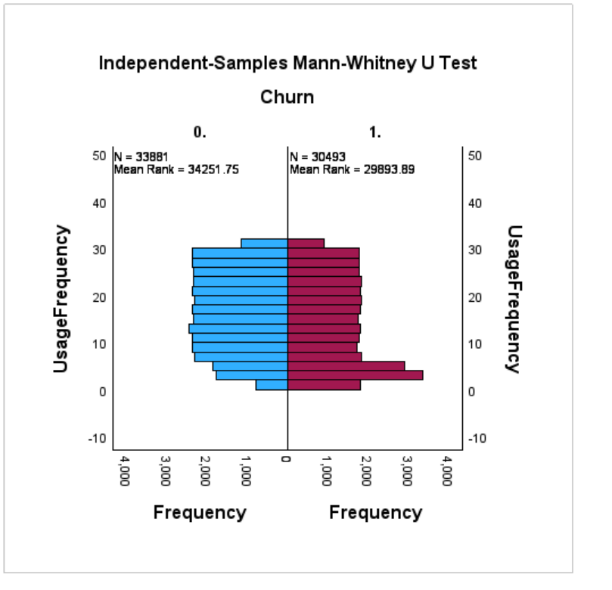
Figure 1. Independent-Samples Mann-Whitney U test
The usage frequency of lost and non-lost customers is visually displayed in the Independent Samples Mann-Whitney U Test. Among them, the blue bar graph represents the frequency of use of people who did not lose, while the red bar graph represents the frequency of use of people who lost. We can obviously see that the blue bar graph is much higher than the red bar graph, which means that the frequency of use for lost customers is generally higher than the frequency of use for lost customers. However, in the 0 to 10 usage frequency, there are more red than blue, meaning that there are more lost customers using the product during the 0 to 10 phase. Their loss may be due to the novelty of the product, and when the novelty has passed, they will no longer use the product.
Table 10. Component Matrix
Component Matrixa | ||
Component | ||
1 | 2 | |
CustomerlD | .665 | -.197 |
Age | .497 | .414 |
UsageFrequency | -.602 | -.195 |
TotalSpend | -.220 | .873 |
Extraction Method:Principal componentAnalysis. a.2 components extracted | ||
For the component matrix, this table illustrate several components of different factors. Firstly, the first two line show the factor which contain consumer id and ages. The consumer id and ages in components1 is 665 and 497, while in component 2 is 197 and 414. Moreover, the last two line give the information of usage frequency and total spend. They are also inequal in two components, 602 and 195 for usage frequency when 220 and 873 for total spend. For the whole table, it uses principle component analysis as the extraction method. The value for the whole chart is higher than zero.
4. Discussion
From the analysis in the above sections, it shows that using data mining on customer churn datasets is good for both the customer and the company. First of all, it can help the company better understand the preferences of customers, so that the company can produce more products that consumers like and get more profits. Secondly, these data can help companies improve marketing efficiency, because they can clearly know what consumers want and don't want through these data. For customers, data mining tells the company what they like, and the company is able to produce more of that type of product, so consumers have more choice in what to buy. At the same time, the mining of data allows companies to price goods at a more reasonable price, so that customers can buy the goods they need at a price they can accept.
5. Conclusion
In this paper, we study the methods and techniques of customer churn data mining. We first introduce the concept and importance of customer churn, and point out the negative impact of customer churn on enterprises. Then, we analyze the existing methods of customer churn data mining.
In this study, we chose to use SPSS (Statistical Package for the Social Sciences) as our research tool. In this process, we use contrastive analysis, factor analysis and other methods to analyze the loss of customers. Through empirical research on real enterprise data, we demonstrate the validity and accuracy of our proposed model in predicting and identifying customer churn.
In addition, we used data visualization tools to show the characteristics and patterns of losing customers. By analyzing these visualizations, we are able to gain insight into the root causes and influencing factors that lead to customer churn, also, interesting trends and insights can be aimed at helping businesses make better decisions to improve their operations and services[5]. This provides guidance for enterprises to develop effective customer retention strategies.
In conclusion, this paper provides an effective method for enterprises to identify and predict customer churn through the research of customer churn data mining. Our results show that using algorithms, it is possible to accurately predict customer churn and gain insight into its root causes. This provides an important reference and decision-making basis for enterprises to retain customers and improve customer loyalty.
References
[1]. Tang, Longhui. Customer Churn Warning Model Based on Data Mining Technology. 2013, https://doi.org/[1]10.3969%20/%20j.i%20SSN.%202095-6835.2011.05.070.
[2]. Muhammad shahid, azeem. “Customer Churn Dataset.” Www.kaggle.com, 2023, www.kaggle.com/datasets/muhammadshahidazeem/customer-churn-dataset.
[3]. Renjith, Shini. “An Integrated Framework to Recommend Personalized Retention Actions to Control B2C E-Commerce Customer Churn.” International Journal of Engineering Trends and Technology, vol. 27, no. 3, 25 Sept. 2015, pp. 152–157, https://doi.org/10.14445/22315381/ijett-v27p227.
[4]. Equihua, Juan Pablo, et al. “Modelling Customer Churn for the Retail Industry in a Deep Learning Based Sequential Framework.” ArXiv.org, 2 Apr. 2023, arxiv.org/abs/2304.00575. Accessed 8 Mar. 2024.
[5]. Yang, Poh Yee, et al. “EXPLORING CONSUMER BEHAVIOUR PATTERNS and MODELLING CHURN PREDICTION in the FOOD DELIVERY SERVICE INDUSTRY: A CASESTUDY.” MyBib,Sept.2023,www.researchgate.net/publication/374614083_EXPLORING_CONSUMER_BEHAVIOUR_PATTERNS_AND_MODELLING_CHURN_PREDICTION_IN_THE_FOOD_DELIVERY_SERVICE_INDUSTRY_A_CASE_STUDY.a b
Cite this article
Jiang,X. (2024). Customer churn data analysis using data mining. Applied and Computational Engineering,77,17-24.
Data availability
The datasets used and/or analyzed during the current study will be available from the authors upon reasonable request.
Disclaimer/Publisher's Note
The statements, opinions and data contained in all publications are solely those of the individual author(s) and contributor(s) and not of EWA Publishing and/or the editor(s). EWA Publishing and/or the editor(s) disclaim responsibility for any injury to people or property resulting from any ideas, methods, instructions or products referred to in the content.
About volume
Volume title: Proceedings of the 2nd International Conference on Software Engineering and Machine Learning
© 2024 by the author(s). Licensee EWA Publishing, Oxford, UK. This article is an open access article distributed under the terms and
conditions of the Creative Commons Attribution (CC BY) license. Authors who
publish this series agree to the following terms:
1. Authors retain copyright and grant the series right of first publication with the work simultaneously licensed under a Creative Commons
Attribution License that allows others to share the work with an acknowledgment of the work's authorship and initial publication in this
series.
2. Authors are able to enter into separate, additional contractual arrangements for the non-exclusive distribution of the series's published
version of the work (e.g., post it to an institutional repository or publish it in a book), with an acknowledgment of its initial
publication in this series.
3. Authors are permitted and encouraged to post their work online (e.g., in institutional repositories or on their website) prior to and
during the submission process, as it can lead to productive exchanges, as well as earlier and greater citation of published work (See
Open access policy for details).
References
[1]. Tang, Longhui. Customer Churn Warning Model Based on Data Mining Technology. 2013, https://doi.org/[1]10.3969%20/%20j.i%20SSN.%202095-6835.2011.05.070.
[2]. Muhammad shahid, azeem. “Customer Churn Dataset.” Www.kaggle.com, 2023, www.kaggle.com/datasets/muhammadshahidazeem/customer-churn-dataset.
[3]. Renjith, Shini. “An Integrated Framework to Recommend Personalized Retention Actions to Control B2C E-Commerce Customer Churn.” International Journal of Engineering Trends and Technology, vol. 27, no. 3, 25 Sept. 2015, pp. 152–157, https://doi.org/10.14445/22315381/ijett-v27p227.
[4]. Equihua, Juan Pablo, et al. “Modelling Customer Churn for the Retail Industry in a Deep Learning Based Sequential Framework.” ArXiv.org, 2 Apr. 2023, arxiv.org/abs/2304.00575. Accessed 8 Mar. 2024.
[5]. Yang, Poh Yee, et al. “EXPLORING CONSUMER BEHAVIOUR PATTERNS and MODELLING CHURN PREDICTION in the FOOD DELIVERY SERVICE INDUSTRY: A CASESTUDY.” MyBib,Sept.2023,www.researchgate.net/publication/374614083_EXPLORING_CONSUMER_BEHAVIOUR_PATTERNS_AND_MODELLING_CHURN_PREDICTION_IN_THE_FOOD_DELIVERY_SERVICE_INDUSTRY_A_CASE_STUDY.a b