


1. Introduction
1.1. Research Background
Over the past century, cities have been continuously developing. As a result, roads have become increasingly crisscrossed, and cars have gradually become a necessary part of citizens' daily lives. At present, a complicated transportation system has been established, with private cars being seen everywhere. However, this phenomenon leads to traffic congestion and frequent accidents, consequently resulting in huge personal and property losses. The economic losses caused by traffic accidents are about 30 billion dollars each year, equivalent to approximately 3% of the gross national product of countries around the world[1].Therefore, how to effectively reduce the occurrence of traffic accidents, how to respond quickly after a traffic accident occurs, and how to reduce losses in an accident have become significant issues.
1.2. literature review
In recent years, researchers have widely utilized big data to explore traffic accident data to find reasons and suggestions. This technology can provide new solutions efficiently in terms of exploring the causes behind accidents. In addition, it can help enrich existing accident analysis methods and avoid analytical bias due to the subjective experience of analysts[2].Many scholars have successfully analyzed the several causes of accidents using big data and have a certain degree of confidence in predicting occurrence of accidents. Luo Yulin built an accident diagnosis model by combining random forest, decision tree and generalized regression neural network, quantitatively estimated the influence of each factor, and output the severity rating of the accident. Finally, the latter had a higher prediction success rate and was supported by examples[2]. Zheng Lai et al. established a T-S fuzzy fault tree with major traffic accidents as the top event, people, vehicles, roads and environment as the intermediate events, and 24 sub-factors as the basic events. They converted it into a Bayesian network, and then bidirectionally inferred the importance and posterior probability of the basic events to determine the main causes. The accuracy and reliability of the cause analysis results of major traffic accidents were improved through forward and reverse reasoning[3]. Han Tianyuan et al. constructed a hierarchical model of the mechanism of serious and major road traffic accidents based on text mining. The results show that the contribution values of the network of causes of major road traffic accidents are illegal behavior, safety hazards and improper operation from large to small. The coupling of the direct causes of illegal behavior and improper operation and the indirect causes of safety hazards is the fundamental reason for the instability of the safety operation system of major accidents[4].
With regard to a certain technology of big data, spark is especially suitable for the transportation field because of its memory-based computing characteristics. Spark makes it fast in processing distributed data which is exactly the type of traffic accident data. Many researchers have used Spark to conduct research in the transportation field. Ebtesam Alomari et al. proposed a method to automatically detect road traffic-related events from Saudi dialect tweets using machine learning and big data[5]. A. Saraswathi et al. implemented a real-time traffic monitoring system based on Spark. In the article, the traffic volume is predicted using connected vehicles and real-time streaming data is processed using Apache spark and the traffic volume is displayed on a dashboard using springboot[6]. Guo Yuda et al. designed and implemented an efficient parallel algorithm based on the Spark computing framework for road network segmentation and kernel density calculation in road network kernel density estimation. Taking traffic accidents as an example, four groups of experiments were conducted for comparative analysis. The results show that the road network kernel density estimation parallel algorithm based on the Spark computing framework has high computational efficiency and good scalability[7].Spark can help process a large amount of traffic accident data in this experiment. This paper attempts to study traffic accidents based on causal inference on the Spark platform.
1.3. Research gaps
Admittedly, existing research has certainly analyzed the impact of various factors on traffic accidents and can obtain the weight ranking of each factor. However, most of the previous studies used traditional methods such as neural networks and regression analysis, which lacked in-depth discussion of causal relationships, making it difficult to identify the true causes of accidents among various factors. Meanwhile, many studies focused on the relationship between a single factor and traffic accidents, but the data dimension is limited and insufficient to reflect the overall situation. Furthermore, most or a large portion of current research utilized limited data samples, which may fail to accurately represent the overall situation. Existing research has not explored the potential for improvement through targeted interventions, which is a significant gap in the current literature. If causal inference is introduced to the research in traffic accident data and Bayesian networks (BN) are used to introduce external interventions, it can help define the causal effects of external interventions and describe the causal relationships between multiple variables related to accidents[8]. Consequently, it helps obtain conclusions on how much accident reduction can be achieved under certain intervention, thus effectively identifying the improvement priorities in accident prevention practice and guiding relevant activities.
Causal inference is a cutting-edge direction currently, and has not yet been applied in the field of traffic accident analysis and prediction. However, it has achieved success in fields such as medicine and education. Zhang Yu solved the self-selection bias in the field of education based on causal inference[9]. Li Shiyuan et al. studied the causal relationship between the participation of extracurricular tutoring and the generation of negative emotions of middle school students in mainland China based on two phases of data from the China Education Longitudinal Survey, and answered questions such as "whether participation in extracurricular tutoring causes depression" and "who is depressed" at a quantitative level[10]. Liu Xinhui et al. started with realistic data and used series of causal inference methods to screen health index indicators that have evidence-based causal relationships with health/disease outcomes, which can provide more practical and valuable real-world evidence for health/disease management[11].
1.4. Research Topic and method
In this study, the research steps are divided into two distinct components: the data processing phase, which involves preparing the data for analysis, and the causal inference phase, which involves identifying the causal relationships between variables.
This experiment uses the traffic accident data of the United States from 2005 to 2007 as the data set, and uses Pandas to process the relevant data. This data set has 33 dimensions. First, the irrelevant data of the traffic accident link is predicted to be cleared, and then the missing values will be cleared or filled. Afterwards, the object data type is indicated to be normalized, and finally a data set that can identify causal relationships is obtained.
After the above processing, the CasualModel of the Dowhy library is introduced for causal relationship identification, and Matplotlib is used for visualization to obtain the causal relationship diagram of the entire data set. Through these operations, which factor should be the cause, which factor ought to be the effect and the relationship of them could be revealed.
After analyzing the causal relationship from the obtained causal relationship diagram, this article will continue to discover the results of interventions. The variables are estimated in the obtained causal relationship to obtain the influence weight of each factor, thereby evaluating their intervention effects. Finally, in order to evaluate the accuracy and authenticity of the experiment, a refutation test is performed.
2. Experiment
2.1. data processing
This experiment utilizes a comprehensive dataset of traffic accidents in the United States, spanning from 2005 to 2007, which serves as the foundation for our analysis. This data set has many dimensions, covers a comprehensive range, and has a huge amount of data. The specific data types are shown in table 1.
Table 1. Unprocessed data types
Accident_Index | object | Location_Easting_OSGR | float |
Accident_Severity | int | Location_Northing_OSGR | float |
Number_of_Vehicles | int | Did_Police_Officer_Attend_Scene_of_Accident | object |
Number_of_Casualties | int | Local_Authority_(Highway) | object |
Light_Conditions | object | Pedestrian_Crossing-Human_Control | object |
Weather_Conditions | object | Pedestrian_Crossing-Physical_Facilities | object |
Carriageway_Hazards | object | Road_Surface_Conditions | object |
Urban_or_Rural_Area | int | Special_Conditions_at_Site | object |
Local_Authority_(District) | int | LSOA_of_Accident_Location | object |
Longitude | float | Police_Force | int |
Latitude | float | Day_of_Week | int |
Date | object | Road_Type | object |
Time | object | Speed_limit | int |
Year | int | Junction_Detail | float |
Junction_Control | object | 1st_Road_Number | int |
1st_Road_Class | int | 2nd_Road_Number | int |
2nd_Road_Class | int |
From the above table, the data dimension statistics are composed of 5 items of float type, 13 items of int type, and 15 items of object type. This data set includes factors, some of which are considered to be the causes affecting traffic accidents, such as human factors, pedestrians, environmental factors, weather, etc. Some other factors are traffic accident severity evaluation criteria, such as accident severity rating and number of injured victims. The data set contains a total of 570,000 traffic accident data. Therefore, the data set can meet the experimental requirements, and the final conclusion is also of reference value.
There are some irrelevant variables in this data set, such as the accident ID and the year of the accident, which are not very useful for studying the cause of the accident. Apart from these data, missing values are also a large part of the data set and need to be processed as well. This article uses the drop() method and dropna() method of Python's Pandas library to process the irrelevant variables and missing values.
Afterwards, since the Dowhy library used for causal inference cannot process the object type, an effective method must be used to convert object type data in the data set into integer or float type. The LabelEncoder method of the sklearn.preprocessing library can help. It uses a value between 0 and number of categories - 1 to encode the target label and convert non-numeric data into numeric data. This paper processes 15 object type data by this method. After the above series of data processing, the final data set consists of 18 dimensions and 315,000 traffic accident data. The processed data types are shown in table 2.
Table 2. Processed data types
Day_of_Week | int | Police_Force | int |
Accident_Severity | int | Time | float |
Number_of_Vehicles | int | Did_Police_Officer_Attend_Scene_of_Accident | int |
Number_of_Casualties | int | Speed_limit | int |
Light_Conditions | int | Pedestrian_Crossing-Human_Control | int |
Weather_Conditions | int | Pedestrian_Crossing-Physical_Facilities | int |
Carriageway_Hazards | int | Road_Surface_Conditions | int |
Urban_or_Rural_Area | int | Special_Conditions_at_Site | int |
Road_Type | int | Junction_Control | int |
2.2. causal relationships identification
Actually, there must be certain causal relationships between the variables that cause traffic accidents. However, it is difficult to construct a correct causal relationship graph based solely on prior knowledge. The causal inference library(Dowhy) can help with causal relationship discovery. PC and GES are widely used and fast causal discovery methods. Therefore, this paper attempts to discover the causal relationship graph by introducing the PC and GES methods, and visualize the causal graph through the GraphUtils library and the pyplot library.
There is a significant difference between the causal diagrams obtained by PC and GES methods. The PC algorithm was proposed by Peter Spirtes et al. It is an algorithm based on conditional independence testing. The core idea of the PC algorithm is to construct a causal graph by observing the variable pairs in the data to determine whether they are directly or indirectly related based on conditional independence tests. On the other hand, the GES algorithm assumes that there is no causal relationship between most variables and tries to find a sparse causal structure. When analyzing the relationship between the severity of traffic accidents and light conditions, GES believes that the severity of traffic accidents causes light conditions. Thus, comparing the causal graphs obtained by PC and GES, PC is more in line with prior knowledge and more correspond to the reality. However, according to prior knowledge, light conditions are objective conditions, and the causal relationship between the two should be that, potentially, light conditions cause traffic accidents to a certain extent. So there is a contradiction between the GES causal diagram and prior knowledge. While, the causal relationship analyzed by PC is consistent with prior knowledge. This paper analyzes the causal relationship obtained by the PC method.
The causal graph clearly illustrates 2 nodes, Pedestrian_Crossing-Physical_Facilities and Weather_Conditions, as the initial nodes, which are the root causes. The police force involved in the accident handling is Police_Force, and the accident severity is Accident_Severity, which are the final nodes and the final results of the entire cause-effect diagram.
The accident severity is directly affected by Special_Conditions_at_Site,Junction_Control, Number_of_Vehicles,Light_Conditions,Speed_limit,Number_of_Casualties,Urban_or_Rural_Area,Did_Police_Officer_Attend_Scene_of_Accident,Weather_Conditions and other variables, and is indirectly affected by other variables. It does prove that traffic accidents are the result of multiple factors.
The node Police_force is directly affected by some variables such as Pedestrian_Crossing-Physical_Facilities,Junction_Control,Road_Surface_Conditions,Urban_or_Rural_Area,Did_Police_Officer_Attend_Scene_of_Accident, and is also indirectly affected by some other variables. These relationships reveal that when the factors which result in traffic accidents are different, the police force dispatched will change accordingly.
Besides, the number of casualties, a variable that people pay attention to, is related to Road_Surface_Conditions,Speed_limit,Did_Police_Officer_Attend_Scene_of_Accident,Light_Conditions,Junction_Control,Number_of_Vehicles,Urban_or_Rural_Area. It shows that whether an accident will cause casualties is potentially related to the condition of the road surface, the speed limit, the presence of police, the lighting conditions, whether the traffic lights at the intersection are working properly, the volume of traffic, and whether it is in an urban area.
2.3. Estimation
If changing a variable lead to a change in the final dependent variable, then it can be defined that the variable will cause the dependent variable to occur. In this process, everything else remains unchanged. Therefore, in this step, this article identifies the causal relationship and effect to be estimated through the properties of the causal graph.
In this paper, all factors except Accident_Severity are estimated as intervention parameters. First, set the parameters treatment and outcome to the variable to be estimated and the dependent variable respectively, and establish a causal model for the variable to be estimated and the accident severity (Accident_Severity). Then utilize the identify_effect() method and estimate_effect() method of the causal model for estimation. This paper estimates the intervention of each factor through the backdoor criterion of structural causal model.
In the estimation step, the estimated values of other variables are shown in figure 1
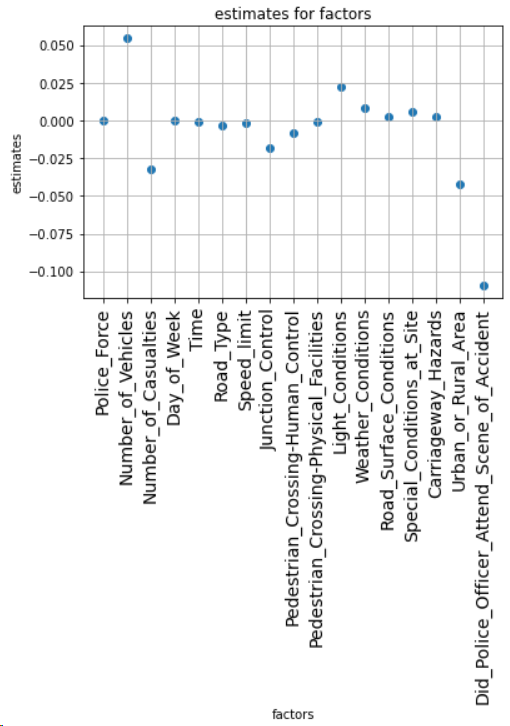
Figure 1. Estimated values.
Number_of_Vehicles,Number_of_Casualties,Did_Police_Officer_Attend_Scene_of_Accident,Urban_or_Rural_Area and Light_Conditions have significantly greater estimates of accident severity than other variables. It shows that the size of the traffic volume, the number of casualties, whether there are police on the scene, whether it is a urban area or a rural area, and the quality of lighting conditions have a significant causal relationship with the severity of traffic accidents. Other factors need to have an impact by acting on these five factors.
2.4. Refutation Test
In order to verify the reliability of the above causal estimation results, we conducted a refutation test. In fact, the causal relationship in the causal diagram obtained from the second step is only a hypothesis about various factors in this article. The refutation test is to verify whether this hypothesis is correct. The basic idea of the refutation test is using the random common cause method. Random common causes are random, non-specific causes that are prevalent in the observed data and affect multiple variables. These causes are often unpredictable and interfere with inferences about causal relationships. In this article, this method is used to eliminate the influence of these interferences. Its specific operation is adding random covariates to the data and rerun the analysis to see if the causal estimate changes. If the hypothesis is correct at the beginning, the causal estimate should not change much.
This paper uses statistical tools to evaluate the interference caused by this random variable. Among them, the P value is a key concept. P value is a parameter in statistics used to evaluate the significance of the difference between observed data and the null hypothesis. It represents the probability of observing the current sample or more extreme cases if the hypothesis is true. Assuming that this random common cause has no relationship with the causal relationship, after the refutation of this method, the obtained P values should be relatively large, thereby lending support to the original causal hypothesis.
However, it is important to note that a large p-value only indicates that the added random common cause has little influence on the causal estimate, but it cannot directly prove that the original hypothesis is correct, as there may be other unconsidered influencing factors.
After using the random common cause method, the new effect value is shown in figure 2, and the ratio of the original effect to the new effect is shown in figure 3.
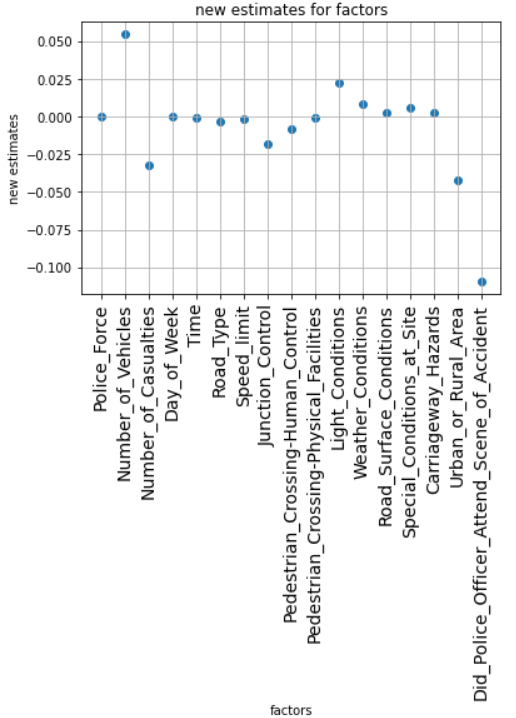
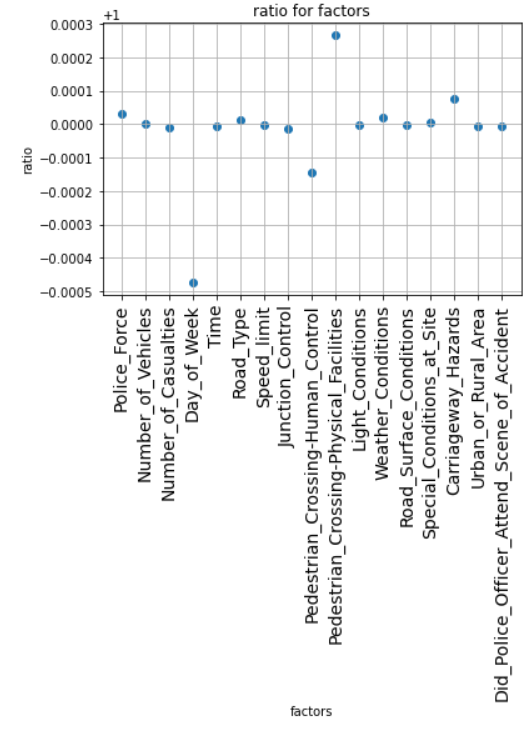
Figure 2. Re-estimated values. Figure 3. Ratio values.
The ratio of the original effect to the new effect is generally close to 1, which indicates that the causal estimate does not change much. It shows that the original hypothesis is correct.
The P value is shown in figure 4.
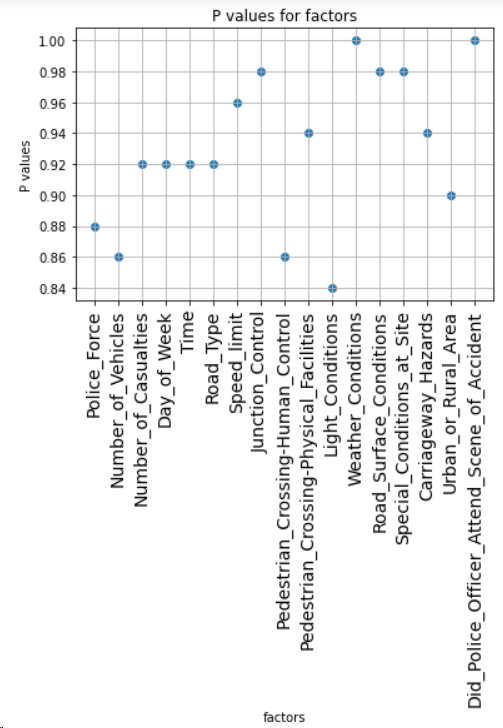
Figure 4. P values.
As shown in the data in the figure, the P values are generally high, and the P values of the two variables Did_Police_Officer_Attend_Scene_of_Accident and Weather_Conditions reach 1. This suggests that the addition of random common causes has almost no effect on the cause-effect relationships. Therefore, the causal relationships in the causal graph obtained in the second step are hardly affected by the covariates. Thus, it reflects that the credibility of the causal relationship between these seventeen factors and Accident_Severity is very high.
3. Conclusion
This study identifies the complex causal relationships between all factors, among which the physical conditions for pedestrian traffic and weather conditions are the root causes that lead to traffic accidents and the dispatch of police forces. In the estimation, this paper finds that intervening with traffic volume and presence of police has the large impacts on the severity of traffic accidents. In addition, this paper conducts a refutation test using the random common cause method and statistical methods, and the results shows that the above causal relationship is highly credible. Therefore, the results of the causal relationships mining and intervention experiment are of reference value for the actual situation. Controlling traffic flow and increasing police patrols can effectively help reduce the occurrence of traffic accidents.
This paper introduces causal inference into the field of traffic accident analysis for the first time. It not only conducts a causal relationship study to reveal the reasons that lead to the severity of the accident, but also, from the perspective of improvement, does research. This can provide future researchers with a new method to study traffic accidents. By analyzing the improvement of traffic accidents from the perspective of intervention, this study helps traffic management departments to identify improvement priorities and reduce the occurrence of traffic accidents.
This study relies on causal inference and only identifies the overall causal relationship of all factors. In the future, the specific causal relationships between each factor can also be studied, so as to show the causal relationships more deeply and specifically, and to use this to determine the root cause of the effect of the intervention.
References
[1]. X.G. Guo (2020). Research on prediction of road traffic accident severity based on Spark platform. Yunnan University.
[2]. Y.L. Luo (2020). Highway traffic risk prediction based on big data. Changsha University of Science and Technology.
[3]. L. Zheng, P. Gu and J. Lu (2021). A cause analysis of extraordinarily severe traffic crashes based on t-s fuzzy fault tree and bayesian network. Journal of Transport Information and Safety, 39(4): 43-51+59.
[4]. T.Y. Han, S. Tian, K.G. Lyu, X. Li, J.T. Zhang and L. Wei (2021). Network analysis on causes for serious traffic accidents based on text mining. China Safety Science Journal, 31(9): 150-6.
[5]. E. Alomari, R. Mehmood and I. Katib (2019). Road traffic event detection using twitter data, machine learning, and apache spark, 2019 IEEE SmartWorld, Ubiquitous Intelligence & Computing, Advanced & Trusted Computing, Scalable Computing & Communications, Cloud & Big Data Computing, Internet of People and Smart City Innovation (SmartWorld/SCALCOM/UIC/ATC/CBDCom/IOP/SCI), Leicester, UK, pp. 1888-95.
[6]. A. Saraswathi, A. Mummoorthy, A. Raman G.R. and K. P. Porkodi (2019). Real-time traffic monitoring system using spark, 2019 Int. Conf. on Emerging Trends in Science and Engineering (ICESE), Hyderabad, India, pp. 1-6.
[7]. Y.D. Guo, X.Y. Zhu, W. Guo and B. She (2020). Parallel algorithm for road network kernel density estimation based on spark computing framework. Geomatics and Information Science of Wuhan University, 45(2): 289-95.
[8]. Z.G. Ma, X.H. Xu and X.E. Liu (2022). Three analytical frameworks of causal inference and their applications. Chinese Journal of Engineering, 44(7): 1231-43.
[9]. Y. Zhang (2013). Causal inference model in quantitative evaluation of education policy and the implications of mixed methods. Tsinghua University Education Research, 2013(3):29-40.
[10]. S.Y. Li and A.Y. Liu (2022). “Melancholic children”: does cram school participation lead to negative emotions? causal inference based on chinese education panel survey (CEPS) data. Chinese Journal of Sociology, 42(2): 60-93.
[11]. X.H. Liu, H.K. Li, L.J. Wang, A.L. Liu, Y. Qi, S.S. Sun, L.F. Zhang, H.J. Ji, G.Y. Liu, H. Zhao, Y.N. Jiang, J.Y. Li, C.C. Song, X. Yu, L. Yang, J.C. Yu, H. Feng, F.J. Yang and F.Z. Xue (2022). Causal inference methodology for the screening of indicators for health indices. CHINESE JOURNAL OF DISEASE CONTROL & PREVENTION, 26(10): 1180-6.
Cite this article
liu,Q. (2024). Analysis of traffic accidents based on Spark and causal inference. Applied and Computational Engineering,87,118-126.
Data availability
The datasets used and/or analyzed during the current study will be available from the authors upon reasonable request.
Disclaimer/Publisher's Note
The statements, opinions and data contained in all publications are solely those of the individual author(s) and contributor(s) and not of EWA Publishing and/or the editor(s). EWA Publishing and/or the editor(s) disclaim responsibility for any injury to people or property resulting from any ideas, methods, instructions or products referred to in the content.
About volume
Volume title: Proceedings of the 6th International Conference on Computing and Data Science
© 2024 by the author(s). Licensee EWA Publishing, Oxford, UK. This article is an open access article distributed under the terms and
conditions of the Creative Commons Attribution (CC BY) license. Authors who
publish this series agree to the following terms:
1. Authors retain copyright and grant the series right of first publication with the work simultaneously licensed under a Creative Commons
Attribution License that allows others to share the work with an acknowledgment of the work's authorship and initial publication in this
series.
2. Authors are able to enter into separate, additional contractual arrangements for the non-exclusive distribution of the series's published
version of the work (e.g., post it to an institutional repository or publish it in a book), with an acknowledgment of its initial
publication in this series.
3. Authors are permitted and encouraged to post their work online (e.g., in institutional repositories or on their website) prior to and
during the submission process, as it can lead to productive exchanges, as well as earlier and greater citation of published work (See
Open access policy for details).
References
[1]. X.G. Guo (2020). Research on prediction of road traffic accident severity based on Spark platform. Yunnan University.
[2]. Y.L. Luo (2020). Highway traffic risk prediction based on big data. Changsha University of Science and Technology.
[3]. L. Zheng, P. Gu and J. Lu (2021). A cause analysis of extraordinarily severe traffic crashes based on t-s fuzzy fault tree and bayesian network. Journal of Transport Information and Safety, 39(4): 43-51+59.
[4]. T.Y. Han, S. Tian, K.G. Lyu, X. Li, J.T. Zhang and L. Wei (2021). Network analysis on causes for serious traffic accidents based on text mining. China Safety Science Journal, 31(9): 150-6.
[5]. E. Alomari, R. Mehmood and I. Katib (2019). Road traffic event detection using twitter data, machine learning, and apache spark, 2019 IEEE SmartWorld, Ubiquitous Intelligence & Computing, Advanced & Trusted Computing, Scalable Computing & Communications, Cloud & Big Data Computing, Internet of People and Smart City Innovation (SmartWorld/SCALCOM/UIC/ATC/CBDCom/IOP/SCI), Leicester, UK, pp. 1888-95.
[6]. A. Saraswathi, A. Mummoorthy, A. Raman G.R. and K. P. Porkodi (2019). Real-time traffic monitoring system using spark, 2019 Int. Conf. on Emerging Trends in Science and Engineering (ICESE), Hyderabad, India, pp. 1-6.
[7]. Y.D. Guo, X.Y. Zhu, W. Guo and B. She (2020). Parallel algorithm for road network kernel density estimation based on spark computing framework. Geomatics and Information Science of Wuhan University, 45(2): 289-95.
[8]. Z.G. Ma, X.H. Xu and X.E. Liu (2022). Three analytical frameworks of causal inference and their applications. Chinese Journal of Engineering, 44(7): 1231-43.
[9]. Y. Zhang (2013). Causal inference model in quantitative evaluation of education policy and the implications of mixed methods. Tsinghua University Education Research, 2013(3):29-40.
[10]. S.Y. Li and A.Y. Liu (2022). “Melancholic children”: does cram school participation lead to negative emotions? causal inference based on chinese education panel survey (CEPS) data. Chinese Journal of Sociology, 42(2): 60-93.
[11]. X.H. Liu, H.K. Li, L.J. Wang, A.L. Liu, Y. Qi, S.S. Sun, L.F. Zhang, H.J. Ji, G.Y. Liu, H. Zhao, Y.N. Jiang, J.Y. Li, C.C. Song, X. Yu, L. Yang, J.C. Yu, H. Feng, F.J. Yang and F.Z. Xue (2022). Causal inference methodology for the screening of indicators for health indices. CHINESE JOURNAL OF DISEASE CONTROL & PREVENTION, 26(10): 1180-6.