


1. Introduction
A healthy stock market is an important guarantee for the stable development of the national economy, and stock price fluctuations are one of the basic characteristics of the stock market. Investors can buy stocks when the stock price is low and sell the stock when the stock price is high, so as to achieve greater gains. The fluctuation of stock prices not only provides investors with profit opportunities, but also helps to realize the resource allocation function of the stock market. The huge and frequent volatility of the stock market not only affects the behavior of investors, but can also hinder the continued healthy development of the economy [1]. Therefore, studying the volatility of the stock market can help to better understand the operating laws and mechanisms of the stock market.
How to model and predict stock market volatility has become a hot issue for many scholars. For practitioners and regulators in the financial markets, it is essential to have accurate volatility forecasts. A large number of scholars have conducted in-depth research on this purpose, building a series of models to predict volatility. Accurate volatility forecasting not only helps investors avoid market risks, but also helps regulators maintain market stability [2]. Considering the impact of macroeconomic factors on the sustainability of stock market volatility in the model will help to capture the time-varying characteristics of volatility more accurately, thereby significantly improving the effectiveness of the model in in-sample data fitting and out-of-sample forecasting [3].
The stock market is an important part of the development of the national economy and has three major functions: first, the financing function, commercial enterprises can issue stocks to raise funds in order to achieve rapid development; the second is the investment function, where investors can invest by buying and selling stocks; The third is the function of optimal allocation of resources, which transfers scarce resources from poor-performing enterprises to better-performing enterprises to promote the rational allocation of resources [4]. Therefore, the stable and healthy development of the stock market is crucial to the sustained and healthy development of the economy.
Changes in macroeconomic conditions and macroeconomic policies have an impact on the stock market. Investors can avoid investment risks in the stock market in a timely manner by collecting information on macroeconomic changes; Regulators are also able to adjust policies in response to changes in economic conditions [5]. Therefore, the study of macroeconomic conditions and stock market volatility prediction is of great significance for risk management, decision-making, economic development and the healthy operation of the stock market [6].
For market investors, they can adjust the scale and direction of investment according to the operation of the macroeconomy, so as to reasonably avoid risks and obtain maximum returns. For listed companies, macroeconomic conditions can affect stock price fluctuations, which in turn affect the size of the company's assets. Accurate prediction of stock market volatility can also reduce the company's financing cost and promote the sustainable and healthy development of the company [7]. As far as government supervision departments are concerned, they can guard against stock market risks, rationally carry out macro-prudential supervision, standardize the operation of the stock market, and make the stock market develop steadily and healthily according to the operation of the macroeconomy. Therefore, it is necessary to study the persistence of macroeconomic conditions and stock market volatility [8].
2. Related Work
A large number of studies on stock market volatility have shown that macroeconomic conditions are the main source of stock market volatility. Li et al. [9] examined the impact of monetary policy on U.S. and Canadian stock prices. However, there is a common drawback of existing research methods, that is, the data must have the same sampling frequency. For stock market data, we can get daily data or even higher frequency data, while for many macroeconomic variable data, we can usually only get monthly or quarterly data, and GDP data can only be obtained on a quarterly or annual basis. Traditional metrology methods require that the sampling frequency of variables in the model be consistent. To address this issue, many scholars have chosen to reduce the sampling frequency of stock market data to align it with that of macroeconomic variables.
Subsequently, Kim and Nelson [10] divided the volatility of the stock market into two parts (CR), one related to the economic cycle and the other independent of the economic cycle, and the results showed that the economic cycle affects the volatility of the stock market, exploring the relationship between macroeconomic conditions and stock market volatility. However, this approach leads to the loss of high-frequency effective information in the stock market, which in turn leads to errors in parameter estimation and volatility forecasting, making it impossible to fully assess the impact of macroeconomic information on stock market volatility. Therefore, studying how to build effective models between data with different sampling frequencies is the key to fully understanding the impact of macroeconomic conditions on stock market volatility.
In order to include variables with different sampling frequencies in the same model, Ghysels et al. [11] proposed a mixed data sampling (MIDAS) method. This method can make full use of existing information, so it has been widely used by many scholars. Engle et al. [12] utilized the generalized autoregressive conditional heteroskedasticity (GARCH) model to divide volatility into long-term components and short-term components, and the long-term components are described by macroeconomic variables, so as to study the relationship between stock market volatility and macro fundamentals. The model not only solves the modeling problem of different frequency data, but also makes full use of the existing information to provide more accurate analysis results.
3. Methodologies
The relationship between macroeconomic indicators and stock market volatility is crucial for investors, policymakers, and economists. To analyze these complex relationships, we employ the Generalized Autoregressive Conditional Heteroskedasticity-Mixed Data Sampling (GARCH-MIDAS) model, which combines the advantages of the GARCH model in short-term volatility modeling and the advantages of mixed data sampling regression in integrating macroeconomic variables of different frequencies.
3.1. GARCH Model
The short-term volatility section uses the GARCH(1,1) model to capture the intraday volatility characteristics of the stock market. The GARCH (Generalized Autoregressive Conditional Heteroskedasticity) model is a model commonly used in financial time series analysis, which can effectively describe the phenomenon of volatility aggregation in financial markets. The calculation of the GARCH(1,1) model is shown in Equation 1.
\( σ_{t}^{2}={α_{0}}+{α_{1}}ϵ_{t-1}^{2}+{β_{1}}σ_{t-1}^{2}\ \ \ (1) \)
Where \( σ_{t}^{2} \) is the conditional variance, which means the volatility of \( t \) at the current moment given past information. This is what we want to estimate through the model, reflecting the current level of uncertainty in the market. \( {α_{0}} \) is a constant term. It indicates the fundamental level of volatility in the absence of other influencing factors. \( {α_{1}} \) is the coefficient of the lag square residual, which represents the effect of the square of the previous period residuals on the current volatility. Specifically, \( ϵ_{t-1}^{2} \) represents the square of the previous period residual, which captures the "shock effect" of volatility, which is how strongly the volatility reacts after a shock. \( {β_{1}} \) is a coefficient of the lag variance, which represents the effect of the previous period's conditional variance on the current volatility. This is used to capture the "persistence effect" of volatility, which is the persistence characteristic of market volatility. Generally speaking, the greater the \( {β_{1}} \) , the more persistent the volatility is.
The advantage of the GARCH(1,1) model is that it is able to dynamically adjust the current conditional variance through past residuals and past variance, thus capturing the dynamic nature of volatility in financial markets. Specifically, when the market experiences large price movements, the square term of the residuals increases, resulting in an increase in the conditional variance; When the market is relatively stable, the conditional variance is mainly determined by the past conditional variance, reflecting the persistence of market fluctuations.
Through the maximum likelihood estimation method, we can estimate the parameters \( {α_{0}},{α_{1}},{β_{1}} \) in the model to determine the dynamic change law of short-term volatility. Estimates of these parameters can help us understand the nature of market volatility and inform further volatility forecasting and risk management.
3.2. MIDAS Regression
The long-term volatility section is modeled using macroeconomic variables of varying frequencies. The mixed-frequency data sampling regression method allows us to introduce low-frequency macroeconomic variables into high-frequency financial time series models, so as to effectively capture the characteristics of long-term volatility changes. The calculation of the MIDAS regression model is shown in Equation 2:
\( {τ_{t}}={θ_{0}}+{θ_{1}}\sum _{k=0}^{K}{w_{k}}{X_{t-k}}\ \ \ (2) \)
Where \( {τ_{t}} \) is the long-term volatility component, which reflects the level of volatility affected by macroeconomic variables. \( {θ_{0}} \) and \( {θ_{1}} \) are parameters that need to be estimated. \( {w_{k}} \) is the weight coefficient and is usually modeled using the Beta function to ensure that the sum of the weights is 1. These weights determine the impact of different lagging macroeconomic variables on the current long-term volatility. \( {X_{t-k}} \) is a lagging macroeconomic variable that represents a macroeconomic indicator for the \( t-k \) period.
In order to ensure the non-negativity and normalization of the weight \( {w_{k}} \) , the Beta weight function is usually used for modeling, which is expressed as Equation 3.
\( {w_{k}}=\frac{{(\frac{k}{K})^{{α_{1}}-1}}{(\frac{1-k}{K})^{{α_{2}}-1}}}{\sum _{j=0}^{K}{(\frac{j}{K})^{{α_{1}}-1}}{(\frac{1-j}{K})^{{α_{2}}-1}}}\ \ \ (3) \)
where \( {α_{1}} \) and \( {α_{2}} \) are the shape parameters of the Beta distribution, which need to be determined by estimation.
The advantage of the MIDAS regression model is that it can synthesize data of different frequencies in one model, so as to make full use of the information of macroeconomic variables and capture the dynamic changes in long-term volatility. The total conditional variance is expressed as Equation 4.
\( σ_{t}^{2}={τ_{t}}×{g_{t}}\ \ \ (4) \)
Where \( σ_{t}^{2} \) is the total conditional variance. \( {τ_{t}} \) is the long-term volatility component and is modeled using MIDAS regression. \( {g_{t}} \) is the short-term volatility component and follows the GARCH process.
Combining the advantages of GARCH and MIDAS, we get the GARCH-MIDAS model. The core idea is to treat short-term volatility and long-term volatility separately and model them separately, thereby improving the accuracy and reliability of volatility forecasting.
4. Experiments
4.1. Experimental Setups
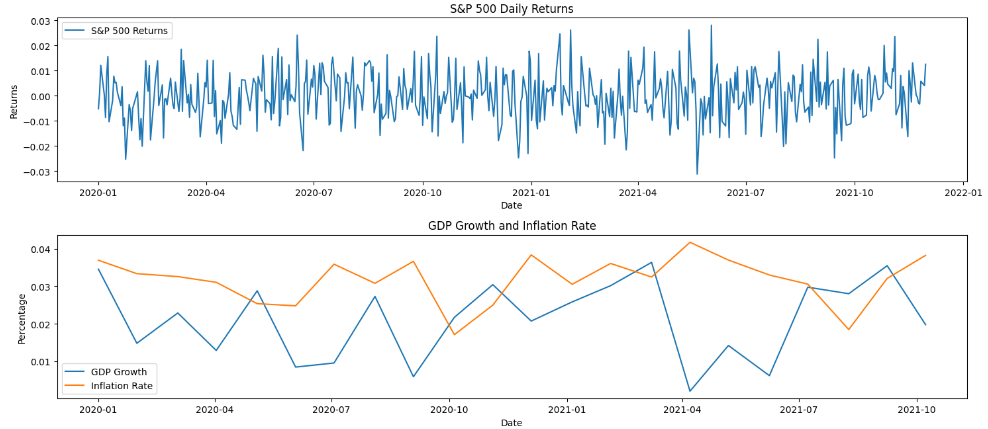
Using the S&P 500 daily return and a series of macroeconomic variables, this study uses the GARCH-MIDAS model to analyze the relationship between macroeconomic indicators and stock market volatility. We first use the GARCH(1,1) model to estimate the short-term volatility, then correlate the long-term volatility with low-frequency macroeconomic variables through MIDAS regression, and finally integrate the short-term and long-term volatility components to construct a total conditional variance model. Through both intra- and out-of-sample data validation, we evaluated the prediction accuracy and robustness of the model. Figure 1 shows the used dataset.
|
Figure 1. Illustration of Used Dataset. |
4.2. Experimental Analysis
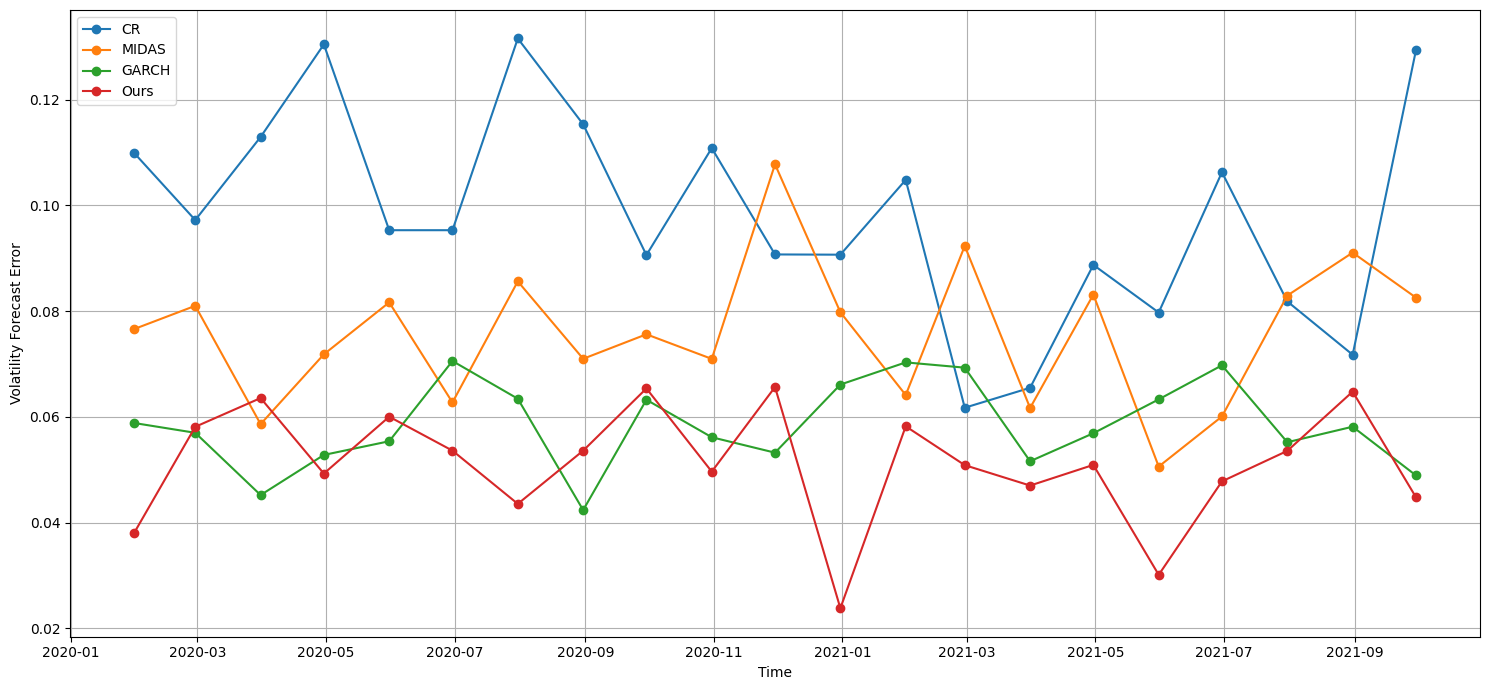
Volatility forecast error is used to assess the difference between the predicted volatility and the actual volatility. This metric measures the accuracy of a model in predicting market volatility. The smaller volatility prediction error indicates that the model is able to capture the volatility of the actual market more accurately, providing more reliable risk assessment and decision support. By calculating the error between the predicted volatility and the actual volatility, we can judge the prediction effect of the model and make corresponding improvements and optimizations. Figure 2 shows the volatility forecast error comparison results.
|
Figure 2. Volatility Forecast Error Comparison. |
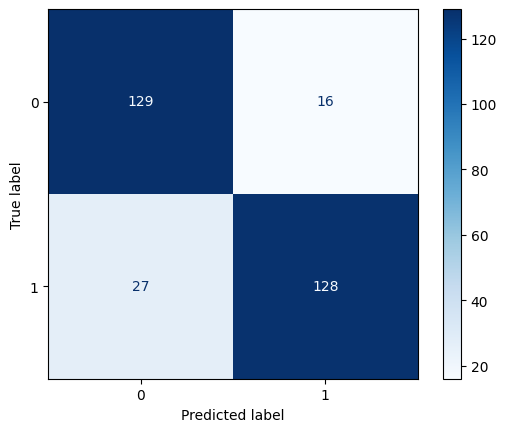
The confusion matrix is a tool used to evaluate the performance of a classification model, which shows in detail the performance of the model on each classification by comparing the predicted results with the actual results. The confusion matrix contains four key metrics: true positives, false positives, true negatives, and false negatives. Figure 3 shows the confusion matrix of our proposed model.
|
Figure 3. Confusion Matrix. |
5. Conclusion
In conclusion, the GARCH-MIDAS model, an advanced machine learning technology, is used to analyze the relationship between macroeconomic indicators and stock market volatility, which significantly improves the ability to capture short-term and long-term volatility dynamics. By effectively integrating high-frequency equity market data and low-frequency macroeconomic variables, our approach provides more accurate and reliable volatility forecasts. Experiments verify the superior performance of our method compared with the traditional model. This comprehensive analysis provides valuable insights for investors, policymakers, and economists, enhancing risk management and decision-making processes in financial markets.
References
[1]. Khan, Muhammad Kamran, et al. "Stock market reaction to macroeconomic variables: An assessment with dynamic autoregressive distributed lag simulations." International Journal of Finance & Economics 28.3 (2023): 2436-2448.
[2]. Chang, Bisharat Hussain, et al. "Macroeconomic variables and stock indices: an asymmetric evidence from quantile ARDL model." South Asian Journal of Business Studies 10.2 (2021): 242-264.
[3]. Hashmi, Shabir Mohsin, and Bisharat Hussain Chang. "Asymmetric effect of macroeconomic variables on the emerging stock indices: A quantile ARDL approach." International Journal of Finance & Economics 28.1 (2023): 1006-1024.
[4]. Boukhatem, Jamel, Zied Ftiti, and Jean Michel Sahut. "Bond market and macroeconomic stability in East Asia: a nonlinear causality analysis." Annals of Operations Research 297.1 (2021): 53-76.
[5]. Sun, Hongxiang, Zhongkai Yao, and Qingchun Miao. "Design of macroeconomic growth prediction algorithm based on data mining." Mobile Information Systems 2021.1 (2021): 2472373.
[6]. Ma, Yaming, Ziwei Wang, and Feng He. "How do economic policy uncertainties affect stock market volatility? Evidence from G7 countries." International Journal of Finance & Economics 27.2 (2022): 2303-2325.
[7]. Nagao, Ryoya, Yoshihiro Kondo, and Yoshiyuki Nakazono. "The macroeconomic effects of monetary policy: Evidence from Japan." Journal of the Japanese and International Economies 61 (2021): 101149.
[8]. Bhargava, Vivek, and Daniel Konku. "Impact of exchange rate fluctuations on US stock market returns." Managerial finance 49.10 (2023): 1535-1557.
[9]. Li, Yun Daisy, Talan B. İşcan, and Kuan Xu. "The impact of monetary policy shocks on stock prices: Evidence from Canada and the United States." Journal of international money and finance 29.5 (2010): 876-896.
[10]. Kim, Yunmi, and Charles R. Nelson. "Pricing stock market volatility: does it matter whether the volatility is related to the business cycle?." Journal of Financial Econometrics 12.2 (2013): 307-328.
[11]. Ghysels, Eric, Pedro Santa-Clara, and Rossen Valkanov. "The MIDAS touch: Mixed data sampling regression models." (2004).
[12]. Engle, Robert F., Eric Ghysels, and Bumjean Sohn. "Stock market volatility and macroeconomic fundamentals." Review of Economics and Statistics 95.3 (2013): 776-797.
Cite this article
Tian,H. (2024). Research on macroeconomic indicators and stock market correlation analysis based on machine learning. Applied and Computational Engineering,87,179-184.
Data availability
The datasets used and/or analyzed during the current study will be available from the authors upon reasonable request.
Disclaimer/Publisher's Note
The statements, opinions and data contained in all publications are solely those of the individual author(s) and contributor(s) and not of EWA Publishing and/or the editor(s). EWA Publishing and/or the editor(s) disclaim responsibility for any injury to people or property resulting from any ideas, methods, instructions or products referred to in the content.
About volume
Volume title: Proceedings of the 6th International Conference on Computing and Data Science
© 2024 by the author(s). Licensee EWA Publishing, Oxford, UK. This article is an open access article distributed under the terms and
conditions of the Creative Commons Attribution (CC BY) license. Authors who
publish this series agree to the following terms:
1. Authors retain copyright and grant the series right of first publication with the work simultaneously licensed under a Creative Commons
Attribution License that allows others to share the work with an acknowledgment of the work's authorship and initial publication in this
series.
2. Authors are able to enter into separate, additional contractual arrangements for the non-exclusive distribution of the series's published
version of the work (e.g., post it to an institutional repository or publish it in a book), with an acknowledgment of its initial
publication in this series.
3. Authors are permitted and encouraged to post their work online (e.g., in institutional repositories or on their website) prior to and
during the submission process, as it can lead to productive exchanges, as well as earlier and greater citation of published work (See
Open access policy for details).
References
[1]. Khan, Muhammad Kamran, et al. "Stock market reaction to macroeconomic variables: An assessment with dynamic autoregressive distributed lag simulations." International Journal of Finance & Economics 28.3 (2023): 2436-2448.
[2]. Chang, Bisharat Hussain, et al. "Macroeconomic variables and stock indices: an asymmetric evidence from quantile ARDL model." South Asian Journal of Business Studies 10.2 (2021): 242-264.
[3]. Hashmi, Shabir Mohsin, and Bisharat Hussain Chang. "Asymmetric effect of macroeconomic variables on the emerging stock indices: A quantile ARDL approach." International Journal of Finance & Economics 28.1 (2023): 1006-1024.
[4]. Boukhatem, Jamel, Zied Ftiti, and Jean Michel Sahut. "Bond market and macroeconomic stability in East Asia: a nonlinear causality analysis." Annals of Operations Research 297.1 (2021): 53-76.
[5]. Sun, Hongxiang, Zhongkai Yao, and Qingchun Miao. "Design of macroeconomic growth prediction algorithm based on data mining." Mobile Information Systems 2021.1 (2021): 2472373.
[6]. Ma, Yaming, Ziwei Wang, and Feng He. "How do economic policy uncertainties affect stock market volatility? Evidence from G7 countries." International Journal of Finance & Economics 27.2 (2022): 2303-2325.
[7]. Nagao, Ryoya, Yoshihiro Kondo, and Yoshiyuki Nakazono. "The macroeconomic effects of monetary policy: Evidence from Japan." Journal of the Japanese and International Economies 61 (2021): 101149.
[8]. Bhargava, Vivek, and Daniel Konku. "Impact of exchange rate fluctuations on US stock market returns." Managerial finance 49.10 (2023): 1535-1557.
[9]. Li, Yun Daisy, Talan B. İşcan, and Kuan Xu. "The impact of monetary policy shocks on stock prices: Evidence from Canada and the United States." Journal of international money and finance 29.5 (2010): 876-896.
[10]. Kim, Yunmi, and Charles R. Nelson. "Pricing stock market volatility: does it matter whether the volatility is related to the business cycle?." Journal of Financial Econometrics 12.2 (2013): 307-328.
[11]. Ghysels, Eric, Pedro Santa-Clara, and Rossen Valkanov. "The MIDAS touch: Mixed data sampling regression models." (2004).
[12]. Engle, Robert F., Eric Ghysels, and Bumjean Sohn. "Stock market volatility and macroeconomic fundamentals." Review of Economics and Statistics 95.3 (2013): 776-797.