


1. Introduction
Bike sharing, which is a new kind of patterns of shared vehicles, becomes increasingly popular during these years. Bike sharing is an oriented production service system (PSS) where the ownership of the bikes belongs to providers. Users can rent bike for a short time (e.g.10-20 minutes) [1]. In some aspects, shared bicycles also release the traffic congestion by making alternatives for cars [2]. In addition to providing convenience for citizens, shared bicycles make a big difference in environment enhancement, like the air pollution and the noise pollution [3].
There are lots of studies carried out to explore shared bicycles, which helped people get deeper information about the behavior of users. For example, Zhao et al. researched how the built environment could affect the reallocation of shared bicycles [4]. Except for the architectural impacts, Dell et al. also studied on how the docking stations which near popular destinations affected the pattern of usages [5].
A study made by Chen et al. suggested that the dockless bike-sharing systems could observably improve users' experiences at the end of their bike trips [6]. Users can instantly switch to a dockless shared bike without the responsibility of returning it back to a designated dock. This also raised related questions. For dockless shared bicycles, if users don’t park the bicycles in designated points, they will bring some difficulties when researchers want to explore the time-space problems. For most studies, ArcGIS was used for parsing the data onto the map. For instance, Zhang et al. used ArcGIS in learning more about bicycles’ trips [3]. After trying a lot of methods, this paper also used ArcGIS to match the latitudes and longitudes in data and the real map to see the most concentrated areas that were working as parking points for dockless shared bicycles in Shanghai. Furtherly, the areas should be classified in different levels in order to differentiate the size of the parking areas.
In reality, in spite of the existing researches, there was still an important problem in administration of shared bicycles, which was the unstable flow of different periods during a day. The prediction was one of the key researches and practical issues in bike sharing systems, which played an important role in various tasks such as bike rebalancing [7]. The purpose of this paper was to have a deeper knowledge into the flow of shared bicycles in Shanghai. Nowadays, most studies on flow analysis used clustering algorithm which had a wide application for data mining, image analysis, and bio-information. For example, Chen and Chen used unsupervised learning kernel density spatial clustering to study the differences between the flows by analysing shared bicycles’ check out points in different areas [8]. Etienne and Latifa also used a statistical model based on clustering method to automatically analyze the trip data of a bike sharing system [9]. Moreover, deep learning algorithm was also widely used in various areas of traffic analysis. Chai et al. creatively applied Multi-Graph Convolutional Networks to predict the bike flows, and proposed a novel multi-graph convolutional neural network model to utilize heterogeneous spatial correlations between stations for station-level bike flow predictions [10]. Li et al. tried to make a combination of Convolutional Neural Network (CNN) and Long Short-Term Memory (LSTM) named CLTFP in deep learning model to explore dockless shared bicycles’ patterns under different times and places, which they found CLTFP had better performance to capture spatiotemporal correlations [11]. Concerning that existing methods cannot predict the fine-grained bike flows to or from each station, He et al. proposed a new method of spatiotemporal graph attention convolutional neural network to solve this problem [12].
In urban planning, the allocation of shared bicycles in many places was inappropriate. This caused a problem of lack of shared bikes or over supply in some areas. This paper aimed to help rebalance the shared bicycles delivery based on DBSCAN method.
2. Methodology
2.1. Data source
There are totally 102,362 records in data which are originated from the usage of dockless shared bicycles in Shanghai. The data covers all times of a day dated from 2016.08.01 to 2016.08.31 from a brand called Mobike that runs dockless shared bicycle business.
2.2. Indicator selection and description
After deleting all the blank values and superfluous values, and the data that is out of the range of Shanghai (from 120 degrees 51’ east to 122 degrees 12’ east, from 30 degrees 40’ north to 31 degrees 53’ north), which accounts for all the information of variables in data (Table 1).
Table 1. Information and explanation of variables.
Column | Type | Explanation |
id | INT | Which automatically pop up |
Start_time | Object | The exact time that trip started |
Start_location_x | Float | The longitude of start location |
Start_location_y | Float | The latitude of start location |
Start_day | INT | The date that trip start |
Start_hour | INT | The hour when trip start |
Weekend | INT | If it is weekend or workday |
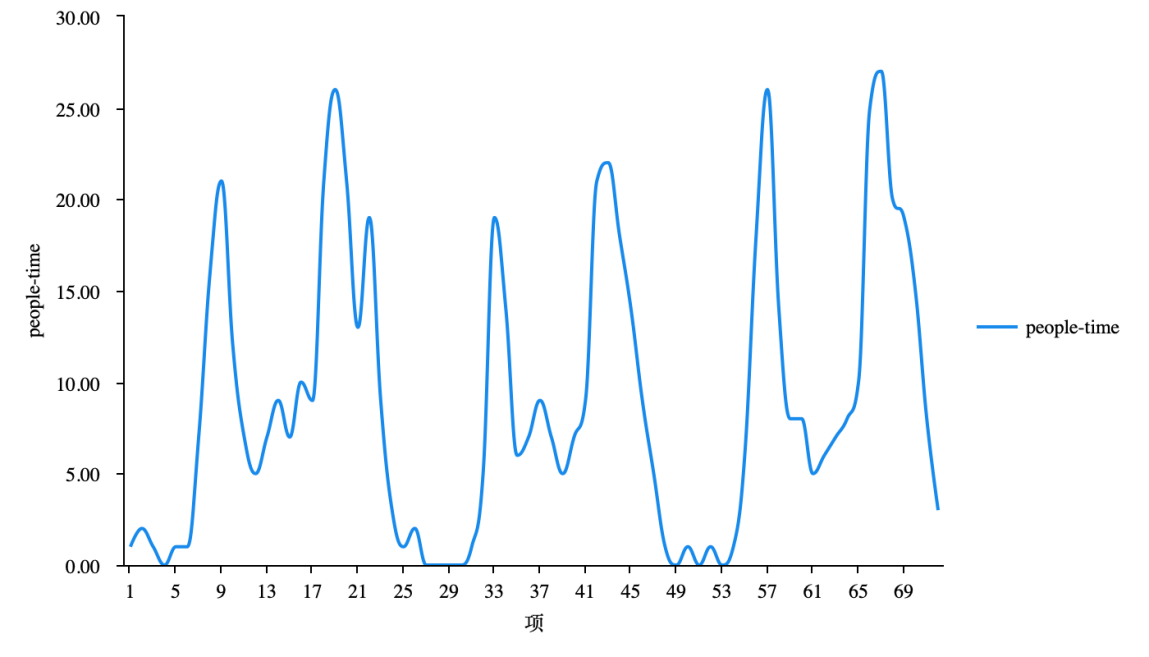
For pretreatment of the data, figure 1 illustrates how many times people used shared bikes in each time period. It shows that the usage of shared bicycles is concentrated on the rush hour which is from 7:00 to 9:00, and from 17:00 to 20:00.
|
Figure 1. Usage flow of three consecutive workdays. |
What’s more, the points where users usually rent and return the bicycles are also significant. Figure 2 is the thermal map of the usage in rush hours of 7:00-9:00 and 17:00-20:00. It depicts the points that most trip occurred in Yangpu and Hongkou District.
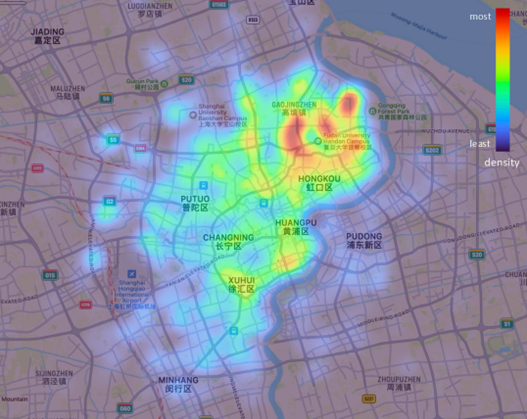
Figure 2. Thermal map of usage in rush hour.
2.3. Method introduction
DBSCAN is a representative clustering density-based algorithm, which is came up with Martin Ester, Hans-Peter Kriegel, Jörg Sander and Xiaowei Xu in 1996. Different from partition and hierarchical clustering algorithm, DBSCAN defines clusters as the largest set of density-connected points, divides regions with sufficient density into clusters, and finds clusters of random shapes in noisy spatial databases. There are 2 parameters included which need manual adjustment, epsilon and minPoints. The algorithm selects an unaccessed object p randomly. If the object's epsilon neighborhood contains at least minPoints objects, p will be labeled as noise point. If not, p will be labeled as core point and a new cluster C. Meanwhile, all objects in the epsilon neighbourhood of p are placed in the candidate set N. Figure 3 shows 3 estimated clusters after the process of data with certain minPoints and epsilon.
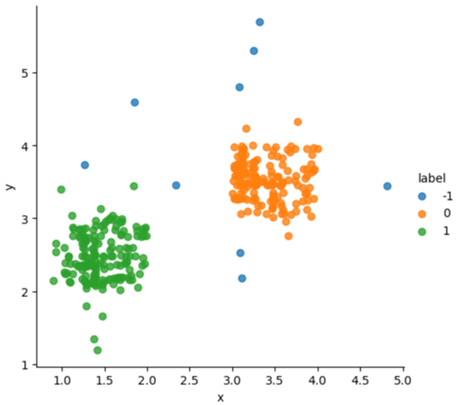
Figure 3. Demo of DBSCAN clustering algorithm.
3. Results and discussion
3.1. Analysis based on K-Means
Firstly, K-Means Algorithm was selected to cluster the points, as figure 4 illustrated. The result is that the range of so much noise point and point is too large and doesn’t conform to the request of point cluster in this essay. The data should be only clustered in few points, which might only include 100 records.
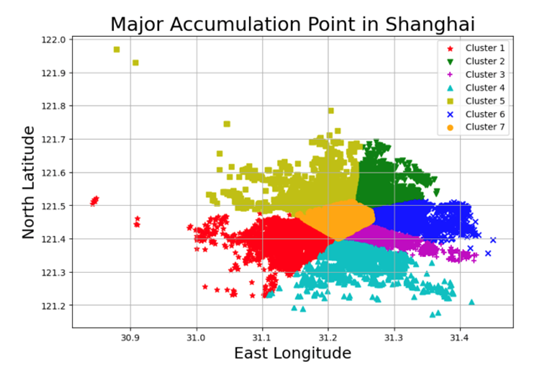
Figure 4. Clustering result of K-Means
3.2. Analysis based on DBSCAN
3.2.1. The most accumulated points. After trying a lot, in order to get proper and appropriate result, DBSCAN is chosen to be the final method to cluster the points. During the DBSCAN process, this paper set the minPoints is 500. This number of minPoints is more proper to be a threshold for being a core compared to the total 102362 records. Figure 5 illustrates the result of DBSCAN clustering, the noise point is identified as label=-1, and the other clusters are identified as label=0 or 1 or 2 or 3. Figure 5 gives the information about the points that dockless shared bicycles most parked.
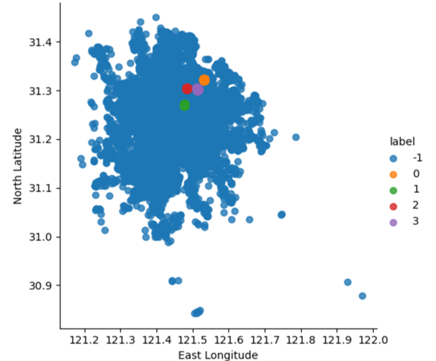
Figure 5. Clustering result of the most accumulated points using DBSCAN
Figure 6 illustrates the exact accumulated points in map. These points mainly concentrated in Yangpu district. To be more specifically, it’s near Jiangwan Stadium subway station, Shiguang Road subway station, Jiangwan Town subway station and Hongkou Football Stadium subway station. Both these points are near universities, which contain thousands of people, making the result more reliable.
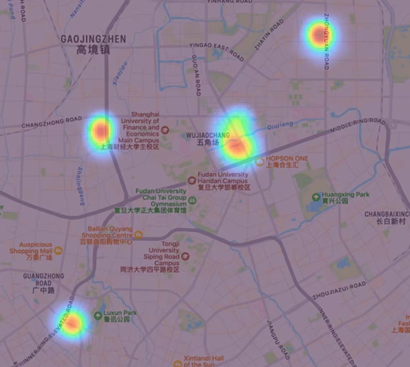
Figure 6. Corresponding result of the most accumulated points in map
3.2.2. The more accumulated points. Furthermore, changing the minPoints to 300 can obtain the clustering result of more accumulated points. In figure 7, it includes both the most and more accumulated points, whose sum is 13. But it only shows the 9 more accumulated points in figure 8. In conclusion, these oints are located in north part of Shanghai, including Gongkang Road subway station, Liziyuan Road subway station and so on.
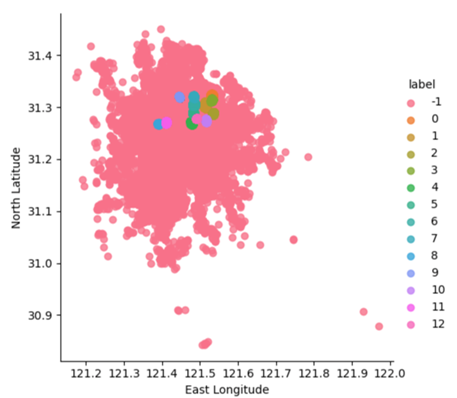
Figure 7. Clustering result of the most and more accumulated points
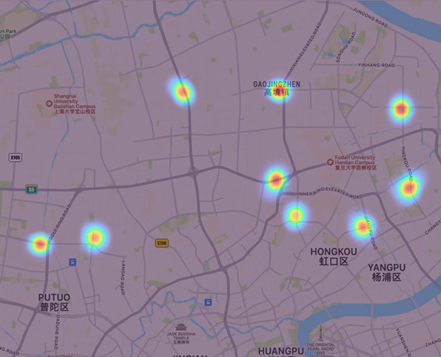
Figure 8. Corresponding result of the more accumulated points in map
3.2.3. The least accumulated points. For the sake of the relatively least accumulated points, this paper sets minPoints to 50 to get some points that people often park bicycles but not too much. There are totally 63 points in this level. Figure 9 shows that these points principally located in the outer ring of the city, such as Songhu Road subway station, Xinzhuang subway station and so on.
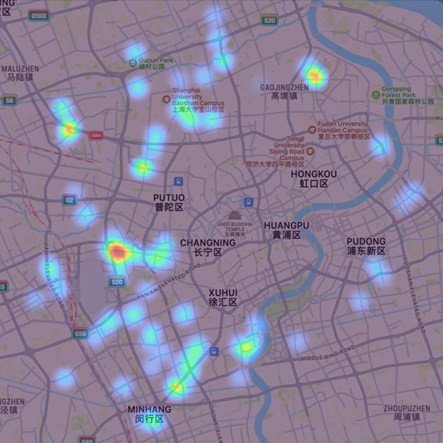
Figure 9. The exact relatively least accumulated points in map
4. Conclusion
In the results, it shows that almost all levels of accumulation points are concentrated on Yangpu, Putuo, and Minhang District, which implied that the company and staffs can allocate more devices and manpower in these areas. For most accumulated points, they mainly concentrated on areas of Yangpu District, where has a lot of companies and universities. Based on the reality, the result can be proved. The result shows that accumulated points were mostly in the outer ring of the city, which is also solid by considering that riding bicycles in center areas is prohibitive. Through the observation, the points additionally gathered in the end station of the subway like the Xinzhuang Station, Songhong Road Station and so on. These results suggested that the company can allocate more delivery in similar sites. For the center area of Shanghai, it needs delivery but maybe not too much. Overmuch bicycles sometimes made troubles for pedestrians in terms of the excessive space occupation. The companies can lower the delivery in more remote areas and more centered areas. This paper didn’t dig deeper into time-flow distinctions. In the future, maybe this essay will make dynamic time-flow distinctions in some specific areas to provide more concrete suggestions for the service providers.
Authors contribution
All the authors contributed equally and their names were listed in alphabetical order.
References
[1]. Annarelli A,Cinzia B and Fabio N2016 Product service system: A conceptual framework from a systematic review. Journal of cleaner production, 139, 1011-1032.
[2]. Caulfield B, et al. 2017 Examining usage patterns of a bike-sharing scheme in a medium sized city. Transportation research part A: policy and practice, 100, 152-161.
[3]. Zhang Y P and Mi Z F 2018 Environmental benefits of bike sharing: A big data-based analysis. Applied energy, 220, 296-301.
[4]. Zhao D, et al. 2019 Effect of built environment on shared bicycle reallocation: A case study on Nanjing, China. Transportation research part A: policy and practice, 128, 73-88.
[5]. Dell’Amico M, et al. 2018 The Bike Sharing Rebalancing Problem with Stochastic Demands. Transp. Res. Part B Methodol, 118, 362-380.
[6]. Chen Z Y, Dea Van L and Dick E 2020 Dockless bike-sharing systems: what are the implications. Transport reviews, 40, 333-353.
[7]. Chen L B, et al. 2016 Dynamic cluster-based over-demand prediction in bike sharing systems. Proceedings of the 2016 ACM International Joint Conference on Pervasive and Ubiquitous Computing.
[8]. Chen S Y and Chen T T 2020 Application of cluster analysis with unsupervised learning to dockless shared bicycle flow control and dispatching. Computer-Aided Design and Applications, 17, 1067-1083.
[9]. Etienne C and Oukhellou L 2014 Model-based count series clustering for bike sharing system usage mining: a case study with the Vélib’system of Paris. ACM Transactions on Intelligent Systems and Technology (TIST), 5, 1-21.
[10]. Chai D, et al. 2018 Bike flow prediction with multi-graph convolutional networks. Proceedings of the 26th ACM SIGSPATIAL international conference on advances in geographic information systems.
[11]. Li Y Y and Bin S 2020 Origin and destination forecasting on dockless shared bicycle in a hybrid deep-learning algorithms. Multimedia Tools and Applications, 79, 5269-5280.
[12]. He S N and Kang G S 2020 Towards fine-grained flow forecasting: A graph attention approach for bike sharing systems. Proceedings of The Web Conference 2020.
Cite this article
Leng,C.;Yin,J. (2024). Dockless shared bicycles accumulation point analysis based on DBSCAN. Applied and Computational Engineering,101,79-86.
Data availability
The datasets used and/or analyzed during the current study will be available from the authors upon reasonable request.
Disclaimer/Publisher's Note
The statements, opinions and data contained in all publications are solely those of the individual author(s) and contributor(s) and not of EWA Publishing and/or the editor(s). EWA Publishing and/or the editor(s) disclaim responsibility for any injury to people or property resulting from any ideas, methods, instructions or products referred to in the content.
About volume
Volume title: Proceedings of the 2nd International Conference on Machine Learning and Automation
© 2024 by the author(s). Licensee EWA Publishing, Oxford, UK. This article is an open access article distributed under the terms and
conditions of the Creative Commons Attribution (CC BY) license. Authors who
publish this series agree to the following terms:
1. Authors retain copyright and grant the series right of first publication with the work simultaneously licensed under a Creative Commons
Attribution License that allows others to share the work with an acknowledgment of the work's authorship and initial publication in this
series.
2. Authors are able to enter into separate, additional contractual arrangements for the non-exclusive distribution of the series's published
version of the work (e.g., post it to an institutional repository or publish it in a book), with an acknowledgment of its initial
publication in this series.
3. Authors are permitted and encouraged to post their work online (e.g., in institutional repositories or on their website) prior to and
during the submission process, as it can lead to productive exchanges, as well as earlier and greater citation of published work (See
Open access policy for details).
References
[1]. Annarelli A,Cinzia B and Fabio N2016 Product service system: A conceptual framework from a systematic review. Journal of cleaner production, 139, 1011-1032.
[2]. Caulfield B, et al. 2017 Examining usage patterns of a bike-sharing scheme in a medium sized city. Transportation research part A: policy and practice, 100, 152-161.
[3]. Zhang Y P and Mi Z F 2018 Environmental benefits of bike sharing: A big data-based analysis. Applied energy, 220, 296-301.
[4]. Zhao D, et al. 2019 Effect of built environment on shared bicycle reallocation: A case study on Nanjing, China. Transportation research part A: policy and practice, 128, 73-88.
[5]. Dell’Amico M, et al. 2018 The Bike Sharing Rebalancing Problem with Stochastic Demands. Transp. Res. Part B Methodol, 118, 362-380.
[6]. Chen Z Y, Dea Van L and Dick E 2020 Dockless bike-sharing systems: what are the implications. Transport reviews, 40, 333-353.
[7]. Chen L B, et al. 2016 Dynamic cluster-based over-demand prediction in bike sharing systems. Proceedings of the 2016 ACM International Joint Conference on Pervasive and Ubiquitous Computing.
[8]. Chen S Y and Chen T T 2020 Application of cluster analysis with unsupervised learning to dockless shared bicycle flow control and dispatching. Computer-Aided Design and Applications, 17, 1067-1083.
[9]. Etienne C and Oukhellou L 2014 Model-based count series clustering for bike sharing system usage mining: a case study with the Vélib’system of Paris. ACM Transactions on Intelligent Systems and Technology (TIST), 5, 1-21.
[10]. Chai D, et al. 2018 Bike flow prediction with multi-graph convolutional networks. Proceedings of the 26th ACM SIGSPATIAL international conference on advances in geographic information systems.
[11]. Li Y Y and Bin S 2020 Origin and destination forecasting on dockless shared bicycle in a hybrid deep-learning algorithms. Multimedia Tools and Applications, 79, 5269-5280.
[12]. He S N and Kang G S 2020 Towards fine-grained flow forecasting: A graph attention approach for bike sharing systems. Proceedings of The Web Conference 2020.