


1. Introduction
1.1. Research Background and Significance
The stock market, as a cornerstone of modern financial systems, plays a crucial role in resource allocation, corporate financing, and economic development. Fluctuations in stock prices not only reflect a company's operational status and market expectations but are also influenced by a complex interplay of factors such as macroeconomic conditions, regulatory policies, and industry competition. Accurate forecasting of stock price movements is essential for investors to formulate rational investment strategies, mitigate risks, and achieve asset appreciation. For financial institutions, precise stock price predictions can help optimize asset allocation, manage risk, and provide more valuable financial services.
However, predicting stock prices is an extremely challenging task due to the inherent complexity, uncertainty, and nonlinearity of stock markets. Traditional forecasting methods often fall short of delivering satisfactory results because of these characteristics. Fundamental analysis relies on financial statements and economic data, which may lack timeliness and fail to capture market sentiment effectively. Technical analysis primarily focuses on pattern recognition based on historical prices and trading volumes, which can be obscured by market noise and random fluctuations. Moreover, stock markets are influenced by numerous unpredictable factors such as unexpected events and sudden shifts in investor sentiment, further complicating the forecasting process[1].
1.2. Research Objectives and Issues
The primary objective of this research is to construct an efficient and accurate stock price prediction model to enhance the predictive capabilities of stock price trends, thereby providing more valuable decision support for investors and financial institutions. Current stock price prediction methods face several notable issues: Limited adaptability: Many traditional models perform well under specific market conditions or for particular stocks, but their predictive accuracy drops significantly when market environments change or when applied to different stocks.
This study aims to address the following key issues: leveraging deep learning technologies, particularly by combining the strengths of convolutional neural networks (CNNs) and long short-term memory (LSTM) networks, to better capture the nonlinearities and long-term dependencies present in stock price data; and through innovative feature engineering methods, extracting richer and more representative features from raw stock data to improve the quality of inputs for the prediction models.
2. Related Work
2.1. Traditional Stock Price Prediction Methods
Fundamental analysis evaluates a stock's intrinsic value and predicts its price trend by analyzing the company's financial condition, performance, and industry prospects. This approach is grounded in value investing theory, positing that stock prices eventually reflect the true worth of a company. However, fundamental analysis has limitations. Firstly, obtaining accurate and comprehensive financial information is challenging, and the information may not be timely. Secondly, valuing a company involves many complex factors and assumptions, introducing subjectivity and uncertainty. Additionally, changes in the macroeconomic environment and industry competition are difficult to predict accurately, potentially impacting the company's performance unexpectedly.
Technical analysis focuses on studying historical stock price and volume data through charts and various technical indicators to identify patterns and trends, thereby predicting future prices. Common tools include moving averages, the relative strength index (RSI), and Bollinger Bands[2]. The rationale behind technical analysis is the assumption that market behavior encompasses all known information, implying that stock price movements already reflect all available information. Nonetheless, its limitations are evident. Technical analysis heavily relies on the repetition of historical data patterns, yet markets are dynamic, and past patterns may not recur. Furthermore, technical indicators tend to lag, often generating misleading signals. Moreover, technical analysis is insensitive to market disruptions and significant changes in fundamentals.
2.2. Application of Machine Learning in Stock Forecasting
Decision tree algorithms construct a tree-like structure to make decisions based on different feature values, classifying or regressing stock prices. In stock forecasting, decision trees can determine whether stock prices will rise or fall based on multiple features in historical data. They are advantageous for their interpretability, but they are prone to overfitting and have limited predictive power for complex stock market data with a single decision tree model.
SVM finds an optimal hyperplane to classify or regress data[3]. In stock forecasting, it maps stock data to high-dimensional space and identifies the optimal classification boundary to predict price movements. SVM excels in handling small sample sizes and high-dimensional data, but it is computationally intensive and sensitive to kernel function selection.
CNNs demonstrate powerful feature extraction capabilities in stock forecasting. They can automatically extract local patterns and features from time series stock price data, such as short-term price fluctuation patterns. Some studies applying CNNs to stock price prediction have achieved better results than traditional methods[4]. However, CNNs are relatively weak at capturing long-term dependencies.
RNNs and their variant, LSTM networks, are adept at handling long-term dependencies in sequence data, making them suitable for predicting stock prices, which are time series data. LSTM introduces gating mechanisms to effectively address the vanishing and exploding gradient problems in RNNs[5], enabling better retention of long-term historical information. Studies show that LSTM-based models can capture long-term trends and cyclical changes in stock forecasting, improving predictive accuracy.
Despite significant progress in stock forecasting using deep learning, challenges remain. For example, training models requires substantial data and computational resources, and the models' interpretability is poor, making it difficult to understand the decision-making process and predictive basis[6].
3. Data Preparation and Preprocessing
3.1. Data Description
The stock data selected for this study encompass multiple industries and companies of varying sizes to ensure broad representativeness and applicability of the findings. The utilized stock data contain rich feature information, with key features including:
• Opening Price (Open): Reflecting the initial trading price at the start of the day, it represents market participants' initial assessment of the stock's value.
• Closing Price (Close): Representing the final trading price at the end of the day, it is considered one of the most important price indicators and significantly influences investors' decision-making.
• Highest Price (High): Recording the highest price reached during the day's trading session, it indicates the market's upward potential and resistance levels.
• Lowest Price (Low): Displaying the lowest price traded during the day, it reflects the market's downside support and risk level.
• Trading Volume (Volume): Indicating the quantity of stocks traded during the day, it reflects the market's trading activity and investor participation enthusiasm.
3.2. Data Cleaning and Handling Missing Values
During the data cleaning process, we identified and processed outliers. Outlier detection was based on statistical methods, such as the three-sigma rule. A data point deviating more than three standard deviations from the mean was classified as an outlier. These outliers were removed to avoid adverse effects on model training and predictions. This is because outliers may arise due to erroneous data recording or extreme market events and do not represent normal market behavior.
For missing values in the dataset, we adopted a strategy of mean imputation. The rationale behind this method lies in the inherent continuity and stability of stock data, where adjacent data points exhibit some degree of correlation. By calculating the mean of the column containing the missing value and filling it into the missing position, we maintained the integrity and continuity of the data while minimizing the introduction of additional bias. Although mean imputation can smooth out real fluctuations in the data, our comprehensive consideration and experimental validation demonstrated that it struck a good balance between preserving data characteristics and maintaining model performance.
3.3. Feature Engineering
To extract meaningful information from raw data, we conducted several feature engineering operations. Among these, we calculated moving averages, including 10-day, 50-day, and 100-day moving averages. Moving averages are computed by averaging closing prices over a specified number of days. They smooth price fluctuations and reflect the long-term trend of stock prices, aiding investors in identifying primary directions and support/resistance levels.
In terms of feature selection, we considered the relevance, importance, and interpretability of features. Through correlation analysis, we eliminated features with weak correlations to the target variable (such as closing price) to reduce redundancy and noise in the data. Based on domain knowledge and preliminary experimental results, we determined the features that had a significant impact on stock price prediction.
For dimensionality reduction, we employed methods such as principal component analysis (PCA). PCA projects high-dimensional data onto a lower-dimensional space while retaining the main variance information. Dimensionality reduction not only reduced computational load and improved model training efficiency but also mitigated the problem of overfitting and enhanced the model's generalizability.
4. Model Architecture and Methodology
4.1. Model Selection and Principles
Stock price time series data possess complex characteristics, encompassing both local short-term patterns and long-term dependencies. Convolutional neural networks (CNNs)[7] have excelled in image recognition and other domains, effectively capturing local features and patterns. When applied to stock price data, they can identify hidden patterns in short-term price movements, such as short-term trends and volatility clustering. However, CNNs have limitations in handling long-term dependencies.
CNNs consist of convolutional layers, pooling layers, and fully connected layers. Convolutional layers use multiple convolutional kernels to perform sliding convolutions across input data, extracting local features. Pooling layers reduce the dimensions of feature maps, decreasing the number of parameters and computations while preserving essential features. In the context of time series data, CNNs excel at automatically learning local spatiotemporal features from input data. For stock price data, they can capture short-term price fluctuation patterns, such as upward or downward trends over a few consecutive days, without requiring manual feature design.
When processing time series data, LSTMs efficiently manage long-term dependencies, circumventing issues like vanishing and exploding gradients encountered in traditional recurrent neural networks (RNNs)[9]. For stock price data, they can retain long-term historical price information, facilitating better future price predictions.
4.2. Model Structure Design
The hierarchical structure of the proposed model includes the following components:
• Convolutional Layers: Two convolutional layers are employed. The first convolutional layer uses 32 kernels of size 3 with a stride of 1 and a ReLU activation function. The second convolutional layer employs 64 kernels of size 3 with a stride of 1 and a ReLU activation function. These convolutional layers extract local features from the input stock price data.
• Pooling Layers: Following each convolutional layer, a max-pooling layer with a window size of 2 and a stride of 2 is used. The purpose of the pooling layers is to reduce the dimensionality of the feature maps, decrease the computational load, and preserve important features.
• LSTM Layers: Two bidirectional LSTM layers are set up, each containing 100 units. Bidirectional LSTMs consider both past and future information, enhancing the model's understanding of time series data.
• Fully Connected Layer: After the LSTM layers, a fully connected layer with 128 neurons and a ReLU activation function is connected, further integrating and transforming the features extracted by the LSTM layers.
The layers are sequentially connected. The convolutional and pooling layers first extract features and reduce dimensionality from the input data, then feed the extracted features into the LSTM layers for temporal sequence learning and memory. The fully connected layer integrates the outputs of the LSTM layers, and the final output layer produces the predicted stock prices.
4.3. Training Strategy and Optimization Algorithm
Stochastic gradient descent (SGD)[10] is adopted as the training algorithm, which iteratively updates the model parameters to minimize the loss function. In each iteration, a small batch of data (mini-batch) is randomly selected, and the gradients are computed based on this mini-batch to update the model parameters. Additionally, L2 regularization is employed to constrain the model parameters, thereby preventing overfitting by adding an L2 regularization term to the loss function, which encourages the model parameters to take on smaller values and reduces the model's complexity. Mean squared error (MSE)[11] serves as the loss function, calculating the average squared difference between the predicted and actual values, providing an effective measure of the deviation between the two.
5. Experiments and Results Analysis
The model's predictions on the test set indicated reasonable forecasts of stock price trends. Figure 1 illustrates the comparison between the predicted and actual price trends on the test set.
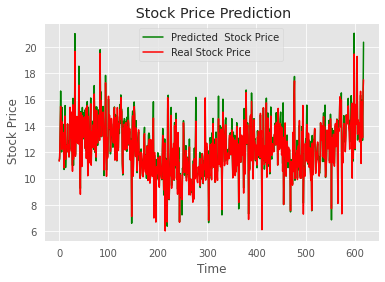
Figure 1. Comparison of Predicted and Actual Price Trends on the Test Set
The variance on the test set was 0.933, indicating that the model's predictions explained a significant portion of the variance in the actual values, demonstrating its strong explanatory power regarding data variability. The R-squared score of 0.933, close to 1, reflected a good fit of the model to the test data, implying a strong linear relationship between the predicted and actual values. The maximum error was 0.337, a relatively small value suggesting that the model's predictive deviation under the worst-case scenario was within an acceptable range. Collectively, these evaluation metrics indicated excellent performance on the test set, with high accuracy and reliability.
The proposed combination of CNN and LSTM models was compared with traditional linear regression, decision tree models, and standalone CNN or LSTM models. The results are summarized in Table 1.
Table 1. Comparison of Model Performance
Model | Variance | R2 Score | Max Error |
Linear Regression | 0.712 | 0.705 | 0.521 |
Decision Tree | 0.785 | 0.776 | 0.483 |
Random Forest | 0.851 | 0.842 | 0.426 |
Only CNN | 0.887 | 0.879 | 0.388 |
Only LSTM | 0.895 | 0.888 | 0.372 |
CNN and LSTM Combined Model | 0.933 | 0.933 | 0.337 |
The findings demonstrated a substantial improvement in performance. This enhancement primarily stemmed from the model's superior ability to capture complex features and long-term dependencies in stock price data. Traditional methods had limited capacity to handle non-linearities and long-term trends, while standalone CNN or LSTM models failed to simultaneously address local features and long-term memory. The combination model effectively addressed these limitations.
6. Conclusion
This study successfully employed a hybrid model based on Convolutional Neural Networks (CNNs) and Long Short-Term Memory networks (LSTMs) for stock price prediction. Through extensive training and validation on large datasets of historical stock prices, the model demonstrated exceptional performance and notable advantages. In terms of performance, the proposed model significantly outperformed traditional prediction methods and baseline models in terms of prediction accuracy. The model excelled in variance, R-squared scores, and other evaluation metrics, reflecting its strong explanatory power and ability to capture linear relationships in the data. The reduction in maximum error also highlighted the model's stability in extreme scenarios.
In summary, the stock price prediction model proposed in this study stands out in terms of performance and advantages, providing valuable insights and new directions for research in stock market prediction.
References
[1]. C.Y. and Marques, J.A.L., 2024. Stock market prediction using Artificial Intelligence: A systematic review of Systematic Reviews. Social Sciences & Humanities Open, 9, p.100864.
[2]. Lutey, M., 2022. Robust Testing for Bollinger Band, Moving Average and Relative Strength Index. Journal of Finance Issues, 20(1), pp.27-46.
[3]. Gunn, S.R., 1997. Support vector machines for classification and regression. Technical report, image speech and intelligent systems research group, University of Southampton.
[4]. Rezaei, H., Faaljou, H. and Mansourfar, G., 2021. Stock price prediction using deep learning and frequency decomposition. Expert Systems with Applications, 169, p.114332.
[5]. Turkoglu, M.O., D'Aronco, S., Wegner, J.D. and Schindler, K., 2021. Gating revisited: Deep multi-layer RNNs that can be trained. IEEE Transactions on Pattern Analysis and Machine Intelligence, 44(8), pp.4081-4092.
[6]. Linardatos, P., Papastefanopoulos, V. and Kotsiantis, S., 2020. Explainable ai: A review of machine learning interpretability methods. Entropy, 23(1), p.18.
[7]. Li, Z., Liu, F., Yang, W., Peng, S. and Zhou, J., 2021. A survey of convolutional neural networks: analysis, applications, and prospects. IEEE transactions on neural networks and learning systems, 33(12), pp.6999-7019.
[8]. Egan, S., Fedorko, W., Lister, A., Pearkes, J. and Gay, C., 2017. Long Short-Term Memory (LSTM) networks with jet constituents for boosted top tagging at the LHC. arXiv preprint arXiv:1711.09059.
[9]. Schmidt, R.M., 2019. Recurrent neural networks (rnns): A gentle introduction and overview. arXiv preprint arXiv:1912.05911.
[10]. Bottou, L., 2012. Stochastic gradient descent tricks. In Neural Networks: Tricks of the Trade: Second Edition (pp. 421-436). Berlin, Heidelberg: Springer Berlin Heidelberg.
[11]. Das, K., Jiang, J. and Rao, J.N.K., 2004. Mean squared error of empirical predictor.
Cite this article
Zhao,Q.;Hao,Y.;Li,X. (2024). Stock price prediction based on hybrid CNN-LSTM model. Applied and Computational Engineering,104,110-115.
Data availability
The datasets used and/or analyzed during the current study will be available from the authors upon reasonable request.
Disclaimer/Publisher's Note
The statements, opinions and data contained in all publications are solely those of the individual author(s) and contributor(s) and not of EWA Publishing and/or the editor(s). EWA Publishing and/or the editor(s) disclaim responsibility for any injury to people or property resulting from any ideas, methods, instructions or products referred to in the content.
About volume
Volume title: Proceedings of the 2nd International Conference on Machine Learning and Automation
© 2024 by the author(s). Licensee EWA Publishing, Oxford, UK. This article is an open access article distributed under the terms and
conditions of the Creative Commons Attribution (CC BY) license. Authors who
publish this series agree to the following terms:
1. Authors retain copyright and grant the series right of first publication with the work simultaneously licensed under a Creative Commons
Attribution License that allows others to share the work with an acknowledgment of the work's authorship and initial publication in this
series.
2. Authors are able to enter into separate, additional contractual arrangements for the non-exclusive distribution of the series's published
version of the work (e.g., post it to an institutional repository or publish it in a book), with an acknowledgment of its initial
publication in this series.
3. Authors are permitted and encouraged to post their work online (e.g., in institutional repositories or on their website) prior to and
during the submission process, as it can lead to productive exchanges, as well as earlier and greater citation of published work (See
Open access policy for details).
References
[1]. C.Y. and Marques, J.A.L., 2024. Stock market prediction using Artificial Intelligence: A systematic review of Systematic Reviews. Social Sciences & Humanities Open, 9, p.100864.
[2]. Lutey, M., 2022. Robust Testing for Bollinger Band, Moving Average and Relative Strength Index. Journal of Finance Issues, 20(1), pp.27-46.
[3]. Gunn, S.R., 1997. Support vector machines for classification and regression. Technical report, image speech and intelligent systems research group, University of Southampton.
[4]. Rezaei, H., Faaljou, H. and Mansourfar, G., 2021. Stock price prediction using deep learning and frequency decomposition. Expert Systems with Applications, 169, p.114332.
[5]. Turkoglu, M.O., D'Aronco, S., Wegner, J.D. and Schindler, K., 2021. Gating revisited: Deep multi-layer RNNs that can be trained. IEEE Transactions on Pattern Analysis and Machine Intelligence, 44(8), pp.4081-4092.
[6]. Linardatos, P., Papastefanopoulos, V. and Kotsiantis, S., 2020. Explainable ai: A review of machine learning interpretability methods. Entropy, 23(1), p.18.
[7]. Li, Z., Liu, F., Yang, W., Peng, S. and Zhou, J., 2021. A survey of convolutional neural networks: analysis, applications, and prospects. IEEE transactions on neural networks and learning systems, 33(12), pp.6999-7019.
[8]. Egan, S., Fedorko, W., Lister, A., Pearkes, J. and Gay, C., 2017. Long Short-Term Memory (LSTM) networks with jet constituents for boosted top tagging at the LHC. arXiv preprint arXiv:1711.09059.
[9]. Schmidt, R.M., 2019. Recurrent neural networks (rnns): A gentle introduction and overview. arXiv preprint arXiv:1912.05911.
[10]. Bottou, L., 2012. Stochastic gradient descent tricks. In Neural Networks: Tricks of the Trade: Second Edition (pp. 421-436). Berlin, Heidelberg: Springer Berlin Heidelberg.
[11]. Das, K., Jiang, J. and Rao, J.N.K., 2004. Mean squared error of empirical predictor.