


1. Introduction
The development of multilayer film structures has garnered significant attention in recent years, with multilayer glass emerging as a prominent application of this theory across various fields. In the construction industry, multilayer glass plays a crucial role in adjusting indoor light intensity and improving energy efficiency and comfort. The performance of multilayer glass is influenced by factors such as glass materials, the number of air cavity layers, and coating technologies [1]. By tailoring the thickness of multilayer glass to specific climate conditions, it is possible to effectively regulate sunlight transmission and maintain optimal indoor temperatures [2].
Previous research has explored various methods for optimizing multilayer glass design. For instance, Liu Yanyan et al. demonstrated that triple-glass double-cavity energy-saving glass is more effective at controlling solar radiation transmission compared to single-layer glass [3]. Shen Xiangdong et al. found that increasing the number of glass layers enhances the thermal insulation performance of windows with the same total thickness [4]. Other studies, such as those by Zhang Yuhong and Zhong Yuanling, have focused on the impact of glass thickness and shading coefficients on light transmittance and energy savings, respectively [5][6]. These studies provide a solid theoretical foundation for understanding the performance characteristics of multilayer glass.
However, most existing studies have concentrated on optimizing the glass itself or the interlayer materials, with limited attention given to the effects of varying glass thickness on light transmittance, particularly under specific lighting conditions. Addressing this gap, the present paper employs the Particle Swarm Optimization (PSO) algorithm to adjust the thickness of triple-layer glass, specifically for the cold winter climates in northern regions [7]. The goal is to achieve optimal transmission when incident light wavelengths range from 300 to 2000nm, maximizing sunlight transmittance. This study constructs an optical model, integrates it with the PSO algorithm, and utilizes MATLAB software to simulate and determine the best thickness combination, analyzing how different thicknesses influence overall light transmittance.
2. Research Methods
2.1. PSO theory
The Particle Swarm Optimization (PSO) algorithm is an intelligent optimization algorithm that simulates the foraging behavior of a flock of birds. The algorithm searches for the global optimal solution by continuously updating the position and velocity of particles. The PSO algorithm is simple and easy to implement, suitable for optimizing continuous nonlinear functions, and can quickly converge to the global optimal solution. In the PSO algorithm, each particle represents a potential solution, and its velocity and position are updated through a formula to update the population. In this study, the position of the particle reflects the thickness combination of the glass, and the fitness function represents the total transmittance under the corresponding thickness. During the iteration process, the particles will gradually converge to the glass thickness combination that can maximize the total transmittance [8].
2.2. Optical models
In order to optimize the total transmittance of multi-layer glass, an optical model based on multi-layer film theory needs to be established. Light is reflected and transmitted when incident on the glass surface. By adjusting the thickness of different layers of glass, the transmission conditions between each layer can be changed, thereby changing the overall transmittance [9].
For sunlight incident vertically from air to single-layer glass, the transmittance is calculated according to formula (1):
\( T= \frac{{I_{t}}}{{I_{i}}}= \frac{{(1-R)^{2}}}{{(1-R)^{2}}+4R{sin^{2}}(kL)} \) (1)
\( R= {(\frac{n-{n_{0}}}{n+{n_{0}}})^{2}} \) (2)
\( k= \frac{2πn}{λ} \) (3)
Where, \( T \) is the transmittance of the single-layer glass; \( {I_{i}} \) is the incident light intensity with a wavelength of \( λ \) ; \( {I_{t}} \) is the transmitted light intensity; R is the reflectivity, calculated according to formula (2); \( {n_{0}} \) is the refractive index of air, \( n \) is the refractive index of glass; k is the wave number, calculated according to formula (3); L is the thickness of the single-layer glass.
The incident light intensity \( {I_{i}} \) is calculated according to formula (4), that is,
\( {I_{i}}={I_{0}}exp(-\frac{{(λ-{λ_{0}})^{2}}}{{2σ^{2}}}) \) (4)
\( FWHM=2\sqrt[]{2ln{2}}σ \) (5)
Where \( {I_{0}} \) represents the intensity of sunlight; \( λ \) represents the wavelength of light; \( {λ_{0}} \) is the central wavelength, representing the maximum position of the spectral intensity; \( σ \) is the standard deviation; FWHM (Full Width at Half Maximum) reflects the width of the spectrum. Formula (4) makes the spectrum appear similar to a Gaussian distribution [10].
This paper only considers the case where sunlight is incident vertically on three glasses with the same refractive index. For each layer of glass, the transmittance can be calculated according to formula (1). The total transmittance of multiple layers of glass can be obtained by multiplying the transmittance of each layer of glass:
\( {T_{total}}= {T_{1}}×{T_{2}}×{T_{3}} \) (6)
Where, \( {T_{1}}{,T_{2}},{T_{3}} \) represent the transmittance of the three layers of glass respectively. Then the energy of light after passing through three layers of glass is:
\( Energy={I_{i}}× {T_{total}} \) (7)
The total transmittance can be reflected by the transmitted energy.
2.3. Optimization process
First, a group of particles are randomly generated. The initial position of each particle represents a combination of glass layer thicknesses. Then, the fitness of each particle is calculated through the optical model. The fitness represents the total transmittance of sunlight under this thickness combination. The algorithm optimizes by updating the speed and position of each particle. The speed is updated and the position of the particle is adjusted through the individual best position and the global best position. The calculation and update process is repeated continuously to optimize the thickness combination. It stops when the set number of iterations is reached. At this time, the optimal thickness combination can be found.
3. Experimental Parameter Setting
In this experiment, the wavelength range of the incident light is set to 300 nm-2000 nm to simulate the wavelength distribution of sunlight; the central wavelength is 580 nm, and the FWHM value is set to 500 nm; the thickness of the three glass sheets is L1, L2, and L3, and the thickness of each layer of glass ranges from 1 mm to 5 mm; the refractive index of air is 1.0, and the refractive index of the three glass sheets is the same, which is 1.5; the initial sunlight intensity is 1000. In the optimization algorithm program, the population size is set to 30, the number of iterations is set to 300, and the number of experiments is set to 100.
4. Experimental Results and Analysis
After using MATLAB software to conduct multiple experiments, the following results were obtained:
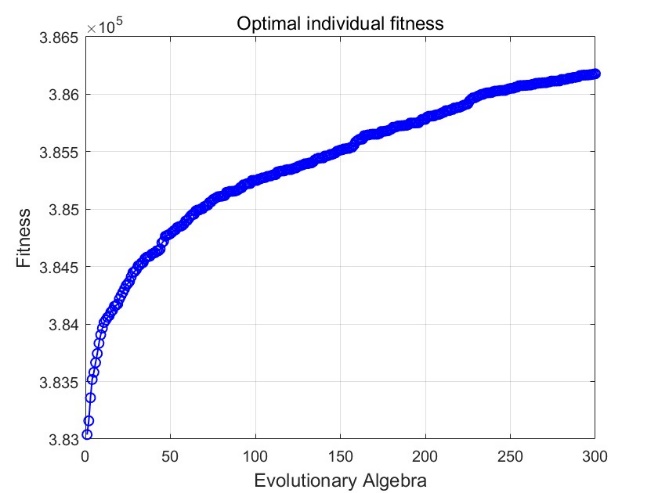
Figure 1. Fitness change curve (Photo credit: Original).
Figure 1 shows the change of the optimal individual fitness of the particle swarm optimization algorithm in the evolution. It can be seen from the figure that the fitness increases rapidly at the beginning, then the growth rate gradually slows down, and finally stabilizes and finally reaches a range of about 3.86e+05. This shows that the algorithm found a better solution in the first few iterations, and gradually converged to the global optimal solution in the subsequent iterations, and the optimization effect was good.
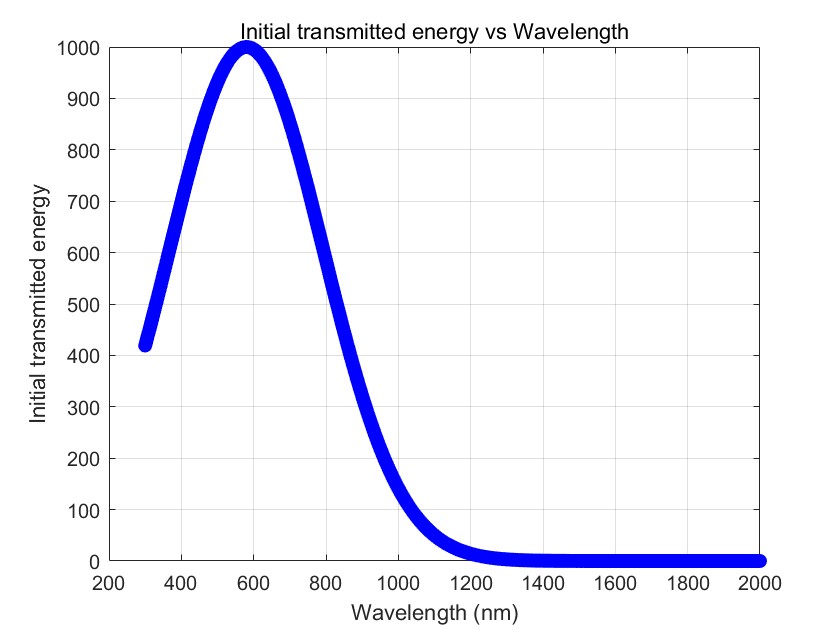
Figure 2. Initial light spectrum energy distribution (Photo credit: Original).
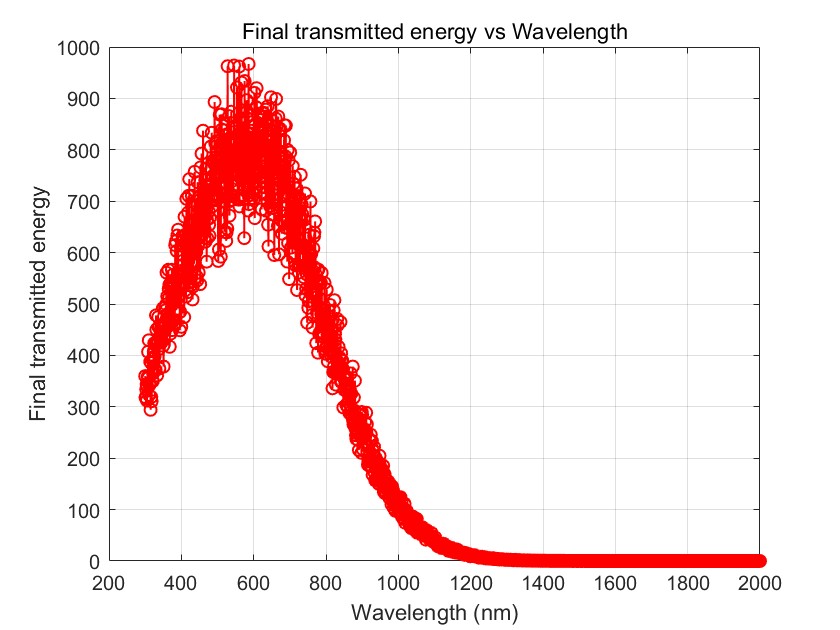
Figure 3. Transmitted light spectral energy distribution (Photo credit: Original).
Figure 2 shows the distribution of initial solar spectrum energy. It can be seen from the figure that at the wavelength of 580nm, the initial incident solar energy is the largest. Therefore, in order to maximize the incident energy, optimization should focus on increasing. The transmittance of sunlight with a wavelength near 580nm. Figure 3 shows the spectral energy distribution of incident light after passing through three layers of glass. It can be seen from the figure that when light passes through optimized triple-layer glass, its energy reaches a peak in the wavelength range of about 400nm-800nm, and the spectral energy reaches its maximum at a wavelength of 580nm, while sunlight has its maximum energy at a wavelength of 580nm, which shows that the glass thickness combination can significantly increase the light transmittance within a certain wavelength range after algorithm optimization. At the same time, the optimized glass combination can effectively utilize specific wavelength bands of sunlight and improve energy utilization.
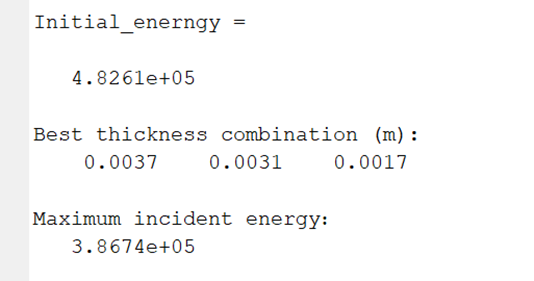
Figure 4. Optimized glass thickness and maximum transmission energy (Photo credit: Original).
As shown in Figure 4, the optimal thickness combination of triple-layer glass was obtained through the particle swarm optimization algorithm:
Table 1. Optimized Glass Thickness and Corresponding Maximum Transmission Energy
L1 (m) | L2 (m) | L3 (m) | Maximum incident energy | Initial maximum energy |
0.0037 | 0.0031 | 0.0017 | 3.8674e+05 | 4.8261e+05 |
Under this thickness combination, the maximum incident energy is 3.8631e+05. After calculation, the maximum intensity of light( \( {I_{i}} \) )when it does not pass through the glass is about 4.8261e+05. It can be seen that the optimized maximum transmission energy is close to the total incident energy. As shown in Table 1.
5. Conclusion
This study successfully employed the Particle Swarm Optimization (PSO) algorithm to optimize the thickness of triple-layer glass, significantly enhancing the transmittance of sunlight within a specific wavelength range, particularly between 400nm and 800nm. The optimized glass configuration not only improved the transmission efficiency of light, thereby enhancing natural lighting and warmth in buildings located in cold northern regions, but also demonstrated the potential of the PSO algorithm in optimizing multilayer glass designs for energy-efficient buildings. The study confirmed that adjusting the thickness of glass layers using an intelligent optimization algorithm like PSO can yield substantial benefits in terms of light transmittance and overall energy performance in architectural applications. Looking ahead, future research should focus on refining the PSO algorithm by introducing dynamic adjustment mechanisms for parameters such as inertia weight and learning factors, which could further enhance convergence speed and optimization accuracy. Additionally, combining PSO with other optimization algorithms may help overcome the limitations of a single algorithm and achieve even better results. Expanding this research to explore the optimization of multilayer glass in different climatic conditions and for various architectural requirements will further broaden the applicability and effectiveness of these findings. Such advancements will be crucial in developing more sustainable and energy-efficient building materials in the future.
References
[1]. Chen, Y. (2024). Analysis of the impact of exterior window glass on ultra-low energy consumption buildings. Shanghai Building Materials, (03), 22-24+28.
[2]. Garlisi, C., Trepci, E., Li, X., Al Sakkaf, R., Al-Ali, K., Pereira Nogueira, R., Zheng, L., Azar, E., & Palmisano, G. (2020). Multilayer thin film structures for multifunctional glass: Self-cleaning, antireflective and energy-saving properties. Applied Energy, 264, 114697.
[3]. Liu, Y., Weng, W., Wang, C., Fu, L., & Tang, Y. (2020). Experimental study on solar transmitted radiation of three-glass two-cavity energy-saving glass and single-layer ordinary glass. China Water Transport (Second Half of the Month), (03), 232-235.
[4]. Shen, X., Wang, W., Chen, L., & Zhang, Y. (2017). Research on the influence of glass layers on the thermal performance of windows. Building Energy Saving, (02), 61-65.
[5]. Zhang, Y., & Li, M. (2020). Research on the correlation between packaging glass thickness and transmittance for dual-glass modules. Glass, (02), 52-55.
[6]. Zhong, Y., & Li, M. (2018). Analysis of the energy-saving impact of exterior windows of residential buildings in the southern district of hot summer and warm winter areas. Green Building, (02), 36-38.
[7]. Zhang, J., & Liu, L. (2024). Research on high transmittance photovoltaic glass frit. Glass, (07), 30-36.
[8]. Jain, M., Saihjpal, V., Singh, N., & Singh, S. B. (2022). An overview of variants and advancements of PSO algorithm. Applied Sciences, 12(17), 8392.
[9]. Jelle, B. P. (2013). Solar radiation glazing factors for window panes, glass structures, and electrochromic windows in buildings—Measurement and calculation. Solar Energy Materials and Solar Cells, 116, 291-323.
[10]. Markevich, N., & Gertner, I. (1989). Comparison among methods for calculating FWHM. Nuclear Instruments and Methods in Physics Research Section A: Accelerators, Spectrometers, Detectors and Associated Equipment, 283(1), 72-77.
Cite this article
Xiao,H. (2024). Enhancing Multilayer Glass Transmittance through Particle Swarm Optimization: An Experimental Approach. Applied and Computational Engineering,94,176-181.
Data availability
The datasets used and/or analyzed during the current study will be available from the authors upon reasonable request.
Disclaimer/Publisher's Note
The statements, opinions and data contained in all publications are solely those of the individual author(s) and contributor(s) and not of EWA Publishing and/or the editor(s). EWA Publishing and/or the editor(s) disclaim responsibility for any injury to people or property resulting from any ideas, methods, instructions or products referred to in the content.
About volume
Volume title: Proceedings of CONF-MLA 2024 Workshop: Securing the Future: Empowering Cyber Defense with Machine Learning and Deep Learning
© 2024 by the author(s). Licensee EWA Publishing, Oxford, UK. This article is an open access article distributed under the terms and
conditions of the Creative Commons Attribution (CC BY) license. Authors who
publish this series agree to the following terms:
1. Authors retain copyright and grant the series right of first publication with the work simultaneously licensed under a Creative Commons
Attribution License that allows others to share the work with an acknowledgment of the work's authorship and initial publication in this
series.
2. Authors are able to enter into separate, additional contractual arrangements for the non-exclusive distribution of the series's published
version of the work (e.g., post it to an institutional repository or publish it in a book), with an acknowledgment of its initial
publication in this series.
3. Authors are permitted and encouraged to post their work online (e.g., in institutional repositories or on their website) prior to and
during the submission process, as it can lead to productive exchanges, as well as earlier and greater citation of published work (See
Open access policy for details).
References
[1]. Chen, Y. (2024). Analysis of the impact of exterior window glass on ultra-low energy consumption buildings. Shanghai Building Materials, (03), 22-24+28.
[2]. Garlisi, C., Trepci, E., Li, X., Al Sakkaf, R., Al-Ali, K., Pereira Nogueira, R., Zheng, L., Azar, E., & Palmisano, G. (2020). Multilayer thin film structures for multifunctional glass: Self-cleaning, antireflective and energy-saving properties. Applied Energy, 264, 114697.
[3]. Liu, Y., Weng, W., Wang, C., Fu, L., & Tang, Y. (2020). Experimental study on solar transmitted radiation of three-glass two-cavity energy-saving glass and single-layer ordinary glass. China Water Transport (Second Half of the Month), (03), 232-235.
[4]. Shen, X., Wang, W., Chen, L., & Zhang, Y. (2017). Research on the influence of glass layers on the thermal performance of windows. Building Energy Saving, (02), 61-65.
[5]. Zhang, Y., & Li, M. (2020). Research on the correlation between packaging glass thickness and transmittance for dual-glass modules. Glass, (02), 52-55.
[6]. Zhong, Y., & Li, M. (2018). Analysis of the energy-saving impact of exterior windows of residential buildings in the southern district of hot summer and warm winter areas. Green Building, (02), 36-38.
[7]. Zhang, J., & Liu, L. (2024). Research on high transmittance photovoltaic glass frit. Glass, (07), 30-36.
[8]. Jain, M., Saihjpal, V., Singh, N., & Singh, S. B. (2022). An overview of variants and advancements of PSO algorithm. Applied Sciences, 12(17), 8392.
[9]. Jelle, B. P. (2013). Solar radiation glazing factors for window panes, glass structures, and electrochromic windows in buildings—Measurement and calculation. Solar Energy Materials and Solar Cells, 116, 291-323.
[10]. Markevich, N., & Gertner, I. (1989). Comparison among methods for calculating FWHM. Nuclear Instruments and Methods in Physics Research Section A: Accelerators, Spectrometers, Detectors and Associated Equipment, 283(1), 72-77.