


1. Introduction
Machine learning algorithms have been incorporated into financial sector in the last decade, particularly in the era of big data. Financial datasets are of immense value to predict future events, make decisions, and forecast outcomes. For example, stock prices, corporate financial reports, transaction data, and economic indicators are being produced at an unprecedented pace and in large quantities. However, financial data is often huge, noisy, and heterogeneous in nature, rendering it difficult to discover meaningful patterns using traditional statistical methods. Machine learning is an effective tool that can model nonlinear patterns in data, handle higher volumes of data, and find connections between different variables. It has become increasingly popular in all subfields of finance, such as portfolio selection, credit scoring, market microstructure, fraud detection and trading. We focus on the specific role of machine learning in dealing with and analysing financial data, concentrating on the techniques used to optimise its performance. We describe the use of supervised learning algorithms, such as linear regression and logistic regression, to make predictions about financial data. In addition, we describe advanced models like RNNs and LSTMs for predicting outcomes on financial time series data [1]. We then discuss approaches taken to identify anomalies in financial data using unsupervised learning techniques. We also address the importance of ensemble learning in improving predictions, and describe the challenges of model optimisation (hyperparameter tuning and cross-validation), where the best model with minimal bias and variance is learned, in order to ensure that the models generalise well to data that are not used for training in a volatile financial environment.
2. Data Preprocessing Techniques
2.1. Data Cleaning in Financial Big Data
The first step of any financial data analysis pipeline is data cleaning. Given that financial datasets are often extremely noisy, incomplete and inconsistent, it is important to undertake rigorous data cleaning to prepare the data for modelling. Data collected from multiple sources (stock exchanges, news aggregators, corporate disclosures) might have missing values, duplicate entries and formatting issues. The success of machine learning models depends to a large extent on the quality of the input data. Data cleaning can be achieved by techniques such as outlier detection, imputation for missing values in the data, and normalising the data for consistency. For instance, in stock price data, there might be missing values for weekends and holidays, which can be filled in either by forward or backward filling. Outliers in the stock price data, caused by erroneous trades, can be detected by the interquartile range (IQR) or Z-score methods [2]. A typical example of data that needs duplicates to be cleaned up is high-frequency trading (HFT) data. Duplicate transaction records might lead to a significant overestimation of transaction volumes.
2.2. Feature Engineering for Financial Data
After the data is cleaned, the next critical step is feature engineering, which is the process of transforming raw data into meaningful features that can be passed on to machine learning models. In finance, raw data such as stock prices, corporate earnings reports, etc. doesn’t have predictive power on its own. But by extracting new variables such as moving averages, volatility indexes, or earnings per share growth rates, we could come up with several engineered features that capture the underlying trend and pattern in the raw data, which would make them more informative to machine learning models [3]. Feature selection methods such as correlation analysis, principal component analysis (PCA) and recursive feature elimination (RFE) are often used to make sure that only the relevant features are passed on to the model and computational burden is reduced, while the performance of the model is improved. In stock market prediction, technical indicators such as the Relative Strength Index (RSI) or Bollinger Bands could be useful features, while for corporate credit scoring, ratios such as debt-to-equity or return on assets (ROA) could be the most important variables. Table 1 below shows financial data collected from a mid-sized technology firm, with key variables such as stock prices, earnings per share, and debt-to-equity ratios, along with the feature-engineered metrics such as the 5-day moving average and the volatility index [4].
Table 1: Financial Data and Feature Engineering Metrics from a Mid-Sized Technology Firm
Stock_Price | Volume | Earnings_Per_Share | Debt_to_Equity | Return_on_Assets | 5_Day_Moving_Avg | Volatility_Index |
150.25 | 1000 | 2.5 | 0.45 | 0.08 | 2.674701437 | |
152.3 | 1500 | 2.55 | 0.5 | 0.085 | 2.674701437 | |
149.8 | 1200 | 2.52 | 0.48 | 0.082 | 2.674701437 | |
153.4 | 1300 | 2.58 | 0.46 | 0.087 | 2.674701437 | |
151 | 1400 | 2.53 | 0.47 | 0.084 | 151.35 | 2.674701437 |
150.9 | 1500 | 2.57 | 0.49 | 0.086 | 151.48 | 2.674701437 |
152.5 | 1600 | 2.61 | 0.51 | 0.088 | 151.52 | 2.674701437 |
155.3 | 1700 | 2.64 | 0.5 | 0.09 | 152.62 | 2.674701437 |
156 | 1650 | 2.66 | 0.52 | 0.091 | 153.14 | 2.674701437 |
157.8 | 1800 | 2.69 | 0.53 | 0.092 | 154.5 | 2.674701437 |
2.3. Dimensionality Reduction for Large Financial Datasets
Financial datasets are often high-dimensional, meaning they have many features (tens to hundreds or even thousands). As always, more is better when it comes to information, but increasing the number of features could lead to overfitting or increased computational costs. Dimensionality reduction is therefore important, and can be used for reducing the number of features without losing the most important patterns in the data. For example, a high-dimensional dataset can be mapped into a lower dimensional one via the PCA (or by using t-SNE, t-distributed stochastic neighbor embedding) without losing the most important variations [5]. This step is very important in high-frequency trading, where enormous amounts of data (hundreds of thousands of rows, each with tens of columns) are generated every second. Without diminishing the number of features, it would be too costly (in terms of computation time) for a trading model to process a dataset in real time when it is generated. Moreover, the risk of model overfitting would be huge if we used the raw high-dimensional dataset as it is.
3. Machine Learning Algorithms for Financial Data
3.1. Supervised Learning Models
Supervised learning models play a fundamental role in financial data analysis by using labeled data to predict future outcomes. One of the simplest models is linear regression, which is used to predict a continuous output based on a linear relationship between the input variables and the target variable. The general form of a linear regression model is represented as \( y={β_{0}}+{β_{1}}{x_{1}}+{β_{2}}{x_{2}}+⋯+{β_{n}}{x_{n}}+ϵ \) ,where \( y \) is the predicted financial metric (such as stock price), \( {x_{1}},{x_{2}},…,{x_{n}} \) are input features (like historical prices or market indicators), \( β \) values are the coefficients, and \( ϵ \) is the error term. Linear regression is commonly used for baseline tasks such as stock price forecasting or economic indicator predictions, but it struggles with nonlinear data patterns, which are prevalent in financial markets Logistic regression is another key supervised learning model, particularly suited for binary classification tasks [6]. It predicts the probability of a binary outcome, such as loan default (yes/no) or stock price movement (up/down) based on input features like credit score, income, or market volatility. The logistic regression model uses the sigmoid function, \( P(y=1|x)= \) \( \frac{1}{1+{e^{-({\overline{β}_{0}}+{\overline{β}_{1}}{x_{1}}+{\overline{β}_{2}}{x_{2}}+⋯+{\overline{β}_{n}}{x_{n}})}}} \) , where \( P(y=1|x) \) gives the probability of the positive class. This model is particularly valuable in credit scoring, where financial institutions use it to assess the likelihood of borrower defaults based on their financial history [7]. However, logistic regression has limitations when dealing with complex financial data, as it assumes a linear relationship between the input features and the log-odds of the outcome.
3.2. Unsupervised Learning for Anomaly Detection
Unsupervised learning models are crucial in financial data analysis especially when dealing with unlabeled datasets. These models help identify hidden structures in the data, such as clusters of similar behavior or anomalies, without needing predefined labels. One of the most populan unsupervised learning algorithms is K-means clustering, which groups data points into \( k \) clusters based on their similarity. The objective of K-means is to minimize the within-cluster variance, defined as \( J=\sum _{i}^{}={1^{k}}\sum _{x∈{C_{i}}}^{}x- \) \( {μ_{i}}{^{2}} \) ,where \( {C_{i}} \) represents the \( i \) -th cluster, and \( {μ_{i}} \) is the centroid of that cluster. In financial applications, K-means is used for segmenting customers based on transaction behaviors, clustering assets based on performance, or identifying outliers in trading data that may indicate fraudulent activities. Another widely used unsupervised learning technique in finance is Principal Component Analysis (PCA), which reduces the dimensionality of large financial datasets while preserving the most critical variance in the data. High-dimensional data, such as stock portfolios or high-frequency trading records, often contain correlated features, which increase computational complexity. PCA transforms the data into a new set of orthogonal components, which capture the maximum variance [8]. This transformation is represented as \( Z=XW \) ,where \( X \) is the original data matrix, and \( W \) is the matrix of principal components (eigenvectors). PCA is valuable in portfolid optimization, as it reduces the number of correlated assets to a smaller set of principal components, enabling more efficient analysis and better decision-making.
3.3. Deep Learning in Financial Forecasting
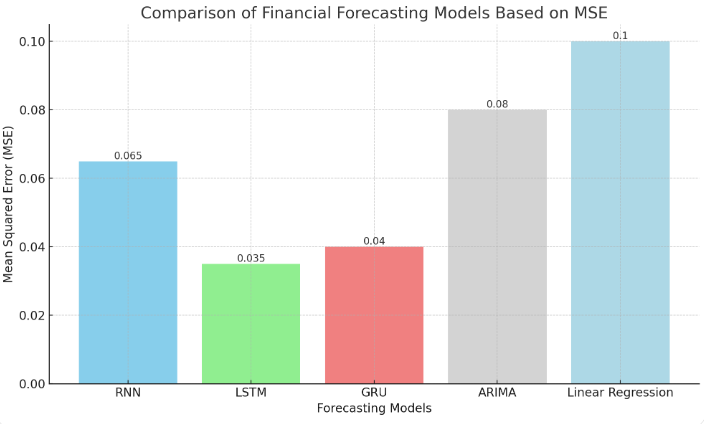 Figure 1: Comparison of Financial Forecasting Models Based on MSE
Deep learning, a subset of machine learning, has revolutionized financial data analysis, particularly in time series forecasting. Recurrent Neural Networks (RNN) and Long Short-Term Memory (LSTM) networks are especially effective in modeling sequential financial data, such as stock prices, currency exchange rates, or bond yields. RNNs are designed to capture temporal dependencies by maintaining a hidden state that evolves over time, with the update equations \( {h_{t}}=σ({W_{h}}{h_{t-1}}+{W_{x}}{x_{t}}+{b_{h}}) \) and \( {y_{t}}={W_{y}}{h_{t}}+{b_{y}} \) , where \( {h_{t}} \) represents the hidden state at time \( t \) ,and \( {x_{t}} \) is the input at time \( t. \) Despite their effectiveness in modeling short-term dependencies, RNNs face difficulties with long-term dependencies due to the vanishing gradient problem, making them less suitable for long-range financial forecasts. To overcome the limitations of RNNs, Long Short-Term Memory (LSTM) networks were developed. LSTM networks incorporate memory cells that can retain information over long periods, making them ideal for capturing both short-term and long-term dependencies in financial data. The LSTM architecture introduces gates (input gate, forget gate, and output gate) to control the flow of information. The update equations for LSTM are given by \( {f_{t}}=σ({W_{f}}\cdot [{h_{t-1}},{x_{t}}]+{b_{f}}),{i_{t}}=σ({W_{i}}\cdot [{h_{t-1}},{x_{t}}]+{b_{i}}),{C_{t}}={f_{t}}* \) \( {C_{t-1}}+{i_{t}}*tanh({W_{C}}\cdot [{h_{t-1}},{x_{t}}]+{b_{C}}) \) ,and \( {o_{t}}=σ({W_{o}}\cdot [{h_{t-1}},{x_{t}}]+{b_{o}}). \) These gates allow the LSTM to decide which information to retain, update or forget, making it highly effective for financial forecasting tasks, such as predicting stock prices over longer time horizons [9]. Figure 1 illustrates a comparison of financial forecasting models, including RNN, LSTM, GRU, ARIMA, and Linear Regression, based on their respective Mean Squared Error (MSE) values.
4. Model Optimization and Performance Evaluation
4.1. Hyperparameter Tuning in Financial Models
Tuning the hyperparameters can be the most crucial step in boosting the performance of machine learning models on financial data. It is particularly important in supervised learning, when an algorithm like a random forest, a support vector machine (SVM) or a deep learning model such as a Long Short-Term Memory (LSTM) network is overly sensitive to aspects such as its learning rates, the number of decision trees, or the depth of the neural network (ie, how many layers). Getting the hyperparameters right helps the model to generalise well to unseen data without overfitting it. To find the right combination of hyperparameters, you can try grid search, random search or adopt more advanced methods such as Bayesian optimisation. For instance, in stock price prediction for an LSTM network, the number of layers and the dropout rate, as well as the size of the batch or mini-batch, are hyperparameters that can significantly affect the model’s ability to capture long-term dependencies in a time series. Similarly, when it comes to credit scoring, we might be tuning the regularisation strength in logistic regression or the number of estimators in a random forest or alternatively the number of neurons in a neural network, again so that we can get the right trade-off between complexity (fitting the data too much) and accuracy of our predictions. In high-frequency trading, where an extra millisecond can mean winning or losing money, a slight improvement in hyperparameter selection can translate into a measurable performance gain on the algorithm.
4.2. Cross-Validation for Model Robustness
Cross-validation is the most common technique used to estimate the generalisation performance of machine learning models applied on financial data. The goal of cross-validation is to make sure that the model performs well on unseen data, avoiding overfitting to the training set. In k-fold cross-validation, the dataset is split into k subsets, and the model is trained with k-1 of these subsets, while the remaining subset is used to validate the model. The process is repeated k times, so that each subset is validated exactly once. Cross-validation is particularly relevant in financial applications, where datasets are often noisy, incomplete or imbalanced, as in credit risk assessment or fraud detection. For instance, when applying machine learning models to credit scoring problems, where the proportion of defaults is typically very low, stratified k-fold cross-validation is used to make sure that each fold contains the exact proportion of defaults of the original dataset. In financial forecasting applications, where time dependencies are often present, it is important to use time series cross-validation techniques, such as walk-forward validation, to avoid data leakage from future observations into the training set [10]. This is particularly relevant in financial forecasting, where the goal is to realistically estimate the performance of the model under real-world conditions, where data from the future is not available during the training process.
4.3. Ensemble Learning for Enhanced Predictive Power
Ensemble learning methods combine the predictions of multiple machine learning models to improve overall accuracy and robustness, making them particularly useful in financial data analysis. Techniques like bagging, boosting, and stacking are commonly applied in tasks like market risk prediction, portfolio optimization, and credit scoring. Bagging methods, such as random forests, reduce model variance by training multiple decision trees on bootstrapped samples of the data and averaging their predictions. This is particularly useful in noisy financial datasets, where individual models may overfit to noise, but ensemble methods provide a more stable and reliable prediction. Boosting techniques like XGBoost or AdaBoost work by sequentially training weak learners and focusing on correcting the errors made by previous models. In credit scoring, boosting can enhance the detection of risky borrowers by improving the classification of minority classes, such as defaulters, without compromising on the accuracy of non-default classifications. Stacking, another ensemble technique, involves training a meta-model on the predictions of multiple base models. In portfolio management, for instance, stacking allows the integration of predictions from various models, such as linear regression, neural networks, and SVMs, to optimize asset allocation. By leveraging the strengths of different models, ensemble learning significantly improves predictive performance in complex financial environments where individual models may fall short.
5. Conclusion
Machine learning has transformed the way financial data is understood and analysed. It provides the power for financial institutions to make accurate predictions regarding future events based on large, complex datasets. Preprocessing techniques like data cleaning and feature engineering are the first steps of model building. Then, by feeding financial time series data into the machine learning model, the software self-learns to make accurate predictions. Deep learning models, such as long-short term memory (LSTM) and recurrent neural networks (RNN), are commonly used, as they can capture temporal dependencies from the financial time series data, which can be challenging to do with traditional models. Also important for improving performance and avoiding overfitting is the use of data-driven hyperparameter tuning, cross-validation, and ensemble learning. Many opportunities remain to improve the machine learning models in finance, such as increasing the interpretability of the models and addressing the ethical implications of automated decision-making. Future research should aim to improve the trust and fairness of algorithmic finance while also exploring innovative ways to incorporate machine learning into our ever-evolving financial systems.
References
[1]. Eleimat, Dheifallah, et al. "The effect of big data on financial reporting quality." International Journal of Data and Network Science 7.4 (2023): 1775-1780.
[2]. Reddy, Surendranadha Reddy Byrapu, and Surendranadha Reddy. "Large Scale Data Influences Based on Financial Landscape Using Big Data." Tuijin Jishu/Journal of Propulsion Technology 44.4 (2023): 3862-3870.
[3]. Agostini, Marisa, Daria Arkhipova, and Chiara Mio. "Corporate accountability and big data analytics: is non-financial disclosure a missing link?." Sustainability Accounting, Management and Policy Journal 14.7 (2023): 62-89.
[4]. Blumenstock, Joshua E., and Nitin Kohli. "Big data privacy in emerging market fintech and financial services: A research agenda." arXiv preprint arXiv:2310.04970 (2023).
[5]. Nguyen, Duc Khuong, Georgios Sermpinis, and Charalampos Stasinakis. "Big data, artificial intelligence and machine learning: A transformative symbiosis in favour of financial technology." European Financial Management 29.2 (2023): 517-548.
[6]. Tomar, Manish, and Vathsala Periyasamy. "The role of reference data in financial data analysis: Challenges and opportunities." Journal of Knowledge Learning and Science Technology ISSN: 2959-6386 (online) 1.1 (2023): 90-99.
[7]. Alkhatib, Ramez, et al. "A brief review of machine learning algorithms in forest fires science." Applied Sciences 13.14 (2023): 8275.
[8]. Elbasi, Ersin, et al. "Crop prediction model using machine learning algorithms." Applied Sciences 13.16 (2023): 9288.
[9]. Musleh, Dhiaa, et al. "Intrusion detection system using feature extraction with machine learning algorithms in IoT." Journal of Sensor and Actuator Networks 12.2 (2023): 29.
[10]. Hoang, Daniel, and Kevin Wiegratz. "Machine learning methods in finance: Recent applications and prospects." European Financial Management 29.5 (2023): 1657-1701.
Cite this article
Zhang,D.;Tang,N.;Dong,W.;Zhao,L. (2024). Machine Learning-Based Financial Big Data Analysis and Forecasting: From Preprocessing to Deep Learning Models. Applied and Computational Engineering,116,79-85.
Data availability
The datasets used and/or analyzed during the current study will be available from the authors upon reasonable request.
Disclaimer/Publisher's Note
The statements, opinions and data contained in all publications are solely those of the individual author(s) and contributor(s) and not of EWA Publishing and/or the editor(s). EWA Publishing and/or the editor(s) disclaim responsibility for any injury to people or property resulting from any ideas, methods, instructions or products referred to in the content.
About volume
Volume title: Proceedings of the 5th International Conference on Signal Processing and Machine Learning
© 2024 by the author(s). Licensee EWA Publishing, Oxford, UK. This article is an open access article distributed under the terms and
conditions of the Creative Commons Attribution (CC BY) license. Authors who
publish this series agree to the following terms:
1. Authors retain copyright and grant the series right of first publication with the work simultaneously licensed under a Creative Commons
Attribution License that allows others to share the work with an acknowledgment of the work's authorship and initial publication in this
series.
2. Authors are able to enter into separate, additional contractual arrangements for the non-exclusive distribution of the series's published
version of the work (e.g., post it to an institutional repository or publish it in a book), with an acknowledgment of its initial
publication in this series.
3. Authors are permitted and encouraged to post their work online (e.g., in institutional repositories or on their website) prior to and
during the submission process, as it can lead to productive exchanges, as well as earlier and greater citation of published work (See
Open access policy for details).
References
[1]. Eleimat, Dheifallah, et al. "The effect of big data on financial reporting quality." International Journal of Data and Network Science 7.4 (2023): 1775-1780.
[2]. Reddy, Surendranadha Reddy Byrapu, and Surendranadha Reddy. "Large Scale Data Influences Based on Financial Landscape Using Big Data." Tuijin Jishu/Journal of Propulsion Technology 44.4 (2023): 3862-3870.
[3]. Agostini, Marisa, Daria Arkhipova, and Chiara Mio. "Corporate accountability and big data analytics: is non-financial disclosure a missing link?." Sustainability Accounting, Management and Policy Journal 14.7 (2023): 62-89.
[4]. Blumenstock, Joshua E., and Nitin Kohli. "Big data privacy in emerging market fintech and financial services: A research agenda." arXiv preprint arXiv:2310.04970 (2023).
[5]. Nguyen, Duc Khuong, Georgios Sermpinis, and Charalampos Stasinakis. "Big data, artificial intelligence and machine learning: A transformative symbiosis in favour of financial technology." European Financial Management 29.2 (2023): 517-548.
[6]. Tomar, Manish, and Vathsala Periyasamy. "The role of reference data in financial data analysis: Challenges and opportunities." Journal of Knowledge Learning and Science Technology ISSN: 2959-6386 (online) 1.1 (2023): 90-99.
[7]. Alkhatib, Ramez, et al. "A brief review of machine learning algorithms in forest fires science." Applied Sciences 13.14 (2023): 8275.
[8]. Elbasi, Ersin, et al. "Crop prediction model using machine learning algorithms." Applied Sciences 13.16 (2023): 9288.
[9]. Musleh, Dhiaa, et al. "Intrusion detection system using feature extraction with machine learning algorithms in IoT." Journal of Sensor and Actuator Networks 12.2 (2023): 29.
[10]. Hoang, Daniel, and Kevin Wiegratz. "Machine learning methods in finance: Recent applications and prospects." European Financial Management 29.5 (2023): 1657-1701.