


1. Introduction
Research Background: Anxiety is a pervasive emotional state characterized by feelings of unease, panic, apprehension, and worry, known to significantly impact cognitive processes and perceptual experiences [1]. Among the various perceptual phenomena influenced by anxiety is the spiral motion illusion (SMI), a visual illusion that induces the perception of motion through specific asymmetric patterns of illuminance levels, including colors such as white, light grey, black, and dark grey [2]. These patterns were optimized by Kitaoka in 2003, leading to the creation of the well-known "Rotating Snakes Illusion" and "Rotating Ad Lib Illusion," which evoke peripheral drift illusions as originally identified by Faubert and Herbert in 1999. Understanding the relationship between neural activities and visual stimuli, particularly in the context of anxiety, presents a unique research opportunity with potential implications for both alleviating anxiety and advancing our understanding of its neural underpinnings.
Development of the Research Area: In recent years, claims have surfaced online suggesting that viewing spiral motion illusion (SMI) images can serve as an indicator of an observer's anxiety levels or even exacerbate their anxiety. Despite these widespread assertions, the scientific exploration of the connection between anxiety and SMI remains limited. This study aims to fill this gap by systematically investigating the relationship between neural activities and visual stimuli associated with SMI, offering a more comprehensive understanding of how anxiety might influence or be influenced by such perceptual experiences.
This Work: This paper presents an experimental study designed to explore the connection between anxiety and the spiral motion illusion (SMI) by examining neural activities in response to visual stimuli. In a controlled environment, participants were exposed to a standardized set of SMI images, minimizing external variables and distractions to accurately assess anxiety levels and the occurrence of the illusion. The experiment utilized the TGAM (ThinkGear ASIC Module) to monitor participants' blinks and brain wave activity across various frequency bands, providing objective measurements of the illusion's perceptual impact. The paper is structured as follows: the literature review section explores current research on anxiety and visual perception, particularly SMI; the methodology section details the experimental design, participant selection, and TGAM usage; the results section presents the collected data, followed by a discussion of the findings; and finally, future expectations and the conclusion provide insights into the potential applications of SMI in anxiety management and other areas.
2. Methodology
This experiment investigated the impact of spiral motion illusions on anxiety levels. Thirty participants were exposed to various spiral motion illusion pictures in a controlled environment. The study measured changes in anxiety levels before and after exposure to the illusions, incorporated TGAM, and tested potential neural during the experiment correlates.
Independent Variable: Types of illusion (Rotating Snakes Illusion and Rotating Ad Lib Illusion with different color contrast ratios)
Dependent Variable: Levels of anxiety.
2.1. Experiment preparation
The preparation phase involved selecting appropriate materials, obtaining necessary equipment, recruiting participants, and meeting ethical considerations. The study setup included an iPad that used to let participants made multiple choices that appeared in the video (shown in Figure 2.), a TGAM headset that was used to recorded different brain waves, a silent room that let participants go one by one, a laptop that used to let participants watched videos and a camera that recorded experiment processes. Figure 1. shows ten self-created spiral motion illusion pictures with varying colors, shapes, and proportions that were prepared as stimuli. Additionally, two types of anxiety forms were used to test participants' before and after emotional status were developed for data collection.
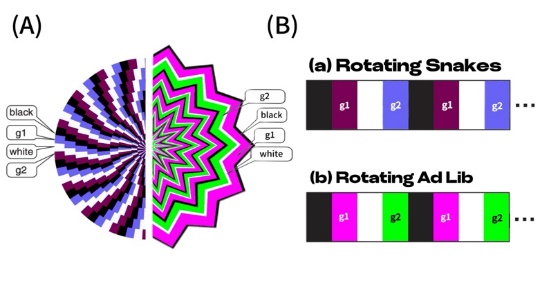
Figure 1. The Left half is one of the self-created rotating snakes illusion's pictures with two sets of contrast colors, black and white, g1, and g2 (#780055 and #6a64f6). The right half is one of the rotating Ad lib illusions with two sets of contrast colors, black and white, g1 and g2 (#fdoof8 and #00fe00). (B) Two sets of asymmetric sequences that can cause illusory motion from rotating snakes and rotating ad-lib illusions (Photo credit: Original).
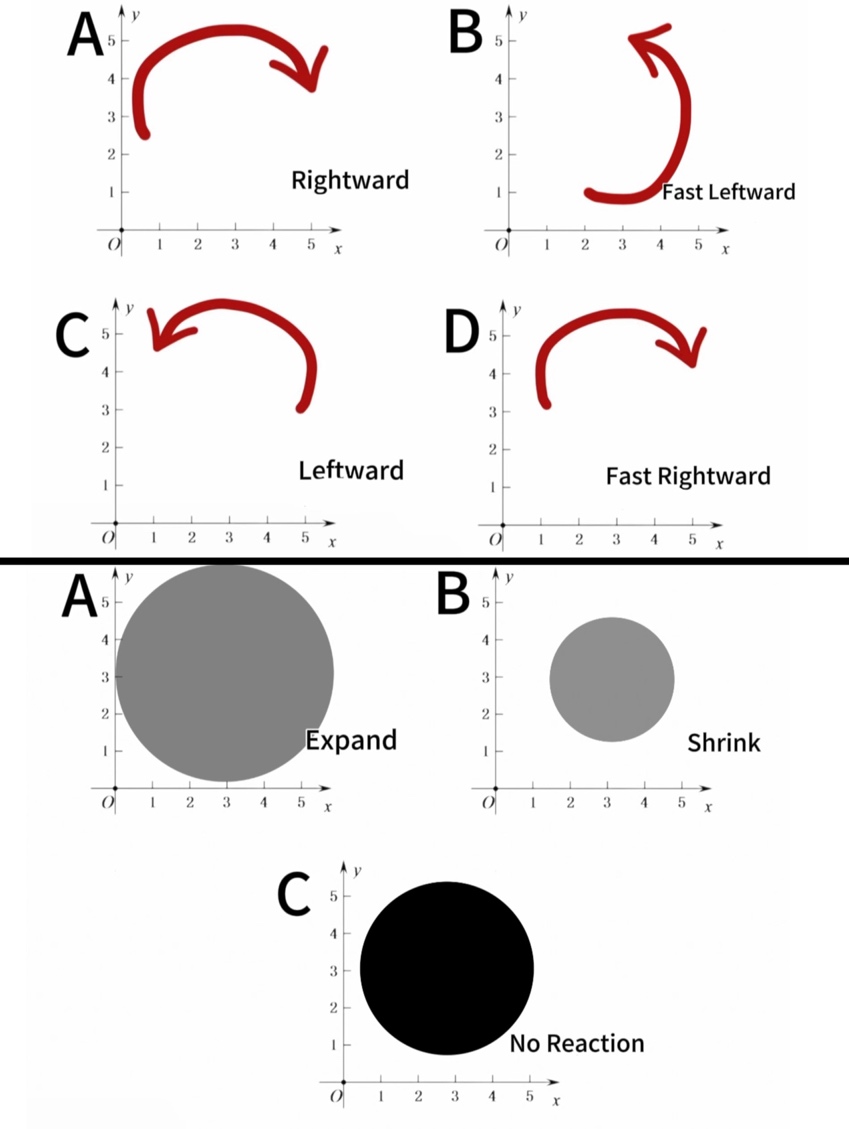
Figure 2. The top half of the picture shows four choices (Rotating Rightward, Rotating Fast leftward, Rotating Leftward, and Rotating Fast Rightward) that were shown in the experiment video to test participants' visual feelings of the five rotating snakes illusion pictures. The bottom half of the picture shows three choices (Expand, Shrink, and No Reaction) to test participants' visual feelings of five rotating ad-lib illusion pictures (Photo credit: Original).
Thirty volunteers aged 15-45 were in the experiment, balanced for gender. Individuals with severe visual impairments or diagnosed anxiety disorders were excluded. All participants were recruited in Shenghuazizhu International School, Shanghai. The experiment holded in Aug 6 and 7, 2024. Thrity -one participants joined the experiment.
2.2. Ethical consideration
Ethical considerations were rigorously followed to ensure the well-being and rights of the participants. All participants signed detailed informed consent forms explaining the procedure and potential risks: visual confusion, cognitive bias, perceptual misunderstanding, distraction, anxiety or discomfort, and cognitive load. Written consent was obtained from all participants. No video was publicized after the experiment.
2.3. Experiments procedure
Participants first completed a pre-exposure anxiety form assessing their current and weekly emotions and sleep status, followed by signing an informed consent form. Each participant entered a silent room individually and then viewed ten self-created spiral motion illusion pictures (rotating snakes and rotating ad-lib) for 10 seconds each. During this task, neural activity was recorded using TGAM headsets, and participants used an iPad and Apple Pencil to select motions resembling what they saw. After exposure, participants filled out a post-exposure form to assess any changes in anxiety and emotions. Lastly, follow-up interviews were conducted three to five hours later to gather qualitative data on their experiences.
3. Results and Discussions
3.1. Results
3.1.1. TGAM neural wave analysis. TGAM provided 15 valuable and precise raw data (Delta, Theta, Alpha, Beta, and Gamma) by continuously detecting participants' brain waves throughout the experiment. However, the raw data is not evenly distributed; there may be multiple points or only a few points at the same time point, and this version of the device has a frequency of around 500hz after calculation. Several pre-processes were undergone to eliminate noise and make the data more accurate: checking and handling NaN and infinite values, detrending, setting and applying band-pass filters, artifact detection, signal smoothing, and Z-Score standardization. Lastly, the improved data were visualized. As show in the figure 3 and figure 4.
For instance:
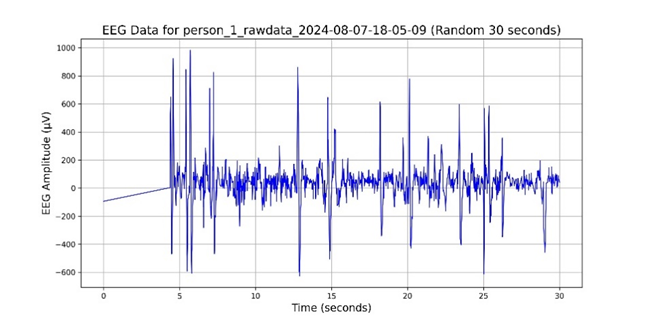
Figure 3. Raw data from one of the participants (Photo credit: Original).
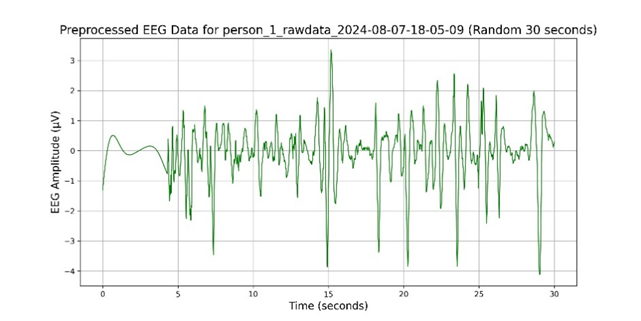
Figure 4. The processed data of the participants (Photo credit: Original).
Then the feature normalization, index calculation, result calculation, and result plotting begin. After completing all of the above steps, 15 different pieces of data were combined.
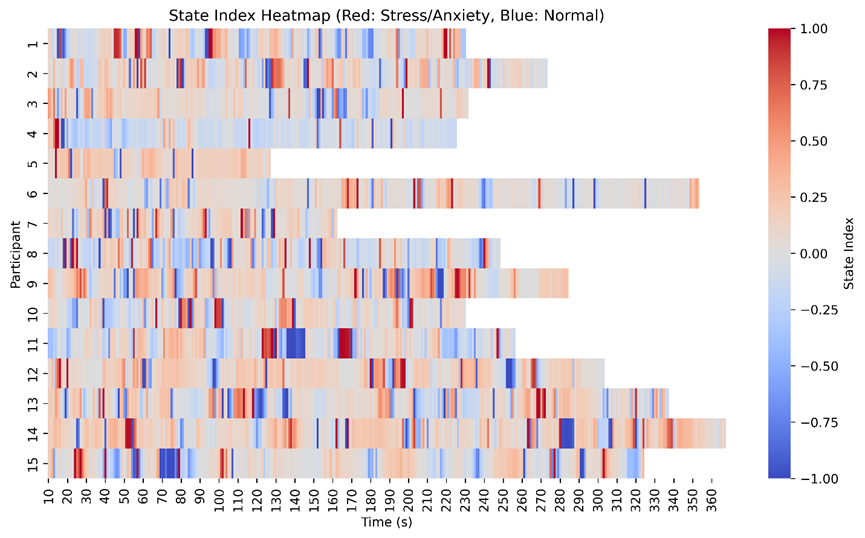
Figure 5. 15 representative data selected from all subjects. The horizontal axis is the time since the start of the test, in seconds, and the vertical axis is the number of people. Our sliding window capture is 10 seconds, which means the state starts at 10 seconds (Photo credit: Original).
As show in the figure 5. If the State Index is positive, the closer it is to 1, the redder the color, indicating that the attention state is dominant and the individual may be in a higher state of alertness, anxiety or concentration.
If the State Index is negative, the closer it is to -1, the bluer the color indicates that the relaxed state dominates and the individual may be more relaxed or rested.
When the State Index is close to zero, the color is gray, indicating that the individual's attention and relaxation are in balance.
Overall, the subjects exhibited a more or less alert concentration or anxiety state. But there were also a few cases, such as participants 3, 4, 6, and 15, who exhibited only mild (state index≤±0.50) anxiety levels throughout the experiment (about 78%, 85%, 84%, 89%) and were either relaxed or balanced most of the time. Others, like No. 8, switched frequently between being very (state index≥±0.50) calm and relaxed (about 7.2%) and very anxious and alert (about 6.4%) throughout the experiment, and maintained for a short time.
3.1.2. Video analysis [sophie]. An interesting topic in pre-historic surveys was the correspondence between pieces of information received by humans and the reaction after receiving them on the human face. There are several recent studies that found that facial signs and expressions can provide researchers with an analysis of stress or anxiety [3-5]. Eyes (gaze distribution, blinking rate, pupil size variation), the mouth (mouth activity, lip deformations), cheeks, the behavior of the head as a whole, strained face, facial pallor, and eyelid twitching are all human behaviors that can be speculated to anxiety [6]. In the experiment, researchers used the camera to capture the reactions while participants watched the video [7]. Researchers chose obvious behaviors to analyze, such as restless legs, eyeball defocusing, nail biting, eye dryness, body fatigue, and trembling. As show in the table 1, table 2 and figure 6.
Table 1. Rotating Snakes Illusion Recorded Video Analysis.
Contrast Colors | 100% | 20%-40% | 40%-60% | 13%-37% | 70%-95% | |
Restless Legs | 3 | 1 | 0 | 4 | 1 | |
Eye-ball Defocusing | 2 | 2 | 0 | 2 | 1 | |
Nail-biting | 0 | 1 | 1 | 1 | 2 | |
Eye Dryness | 3 | 3 | 2 | 4 | 0 | |
Body Fatigue | 0 | 1 | 3 | 3 | 0 | |
Trembling | 0 | 0 | 0 | 0 | 0 |
Table 2. Rotating Ad LIb Illusion Recorded Video Analysis.
Contrast Colors | #00ff00, #fd00f8 | #17669d, 08e714 | #1e00fe, #1efd00 | #73fe73, #fe73fe | #00fd11, #fe00f3 |
Restless Legs | 0 | 3 | 2 | 0 | 2 |
Eye-ball Defocusing | 2 | 2 | 0 | 1 | 6 |
Nail-biting | 1 | 1 | 1 | 3 | 4 |
Eye Dryness | 1 | 2 | 3 | 2 | 3 |
Body Fatigue | 1 | 1 | 2 | 0 | 2 |
Trembling | 0 | 0 | 0 | 0 | 0 |
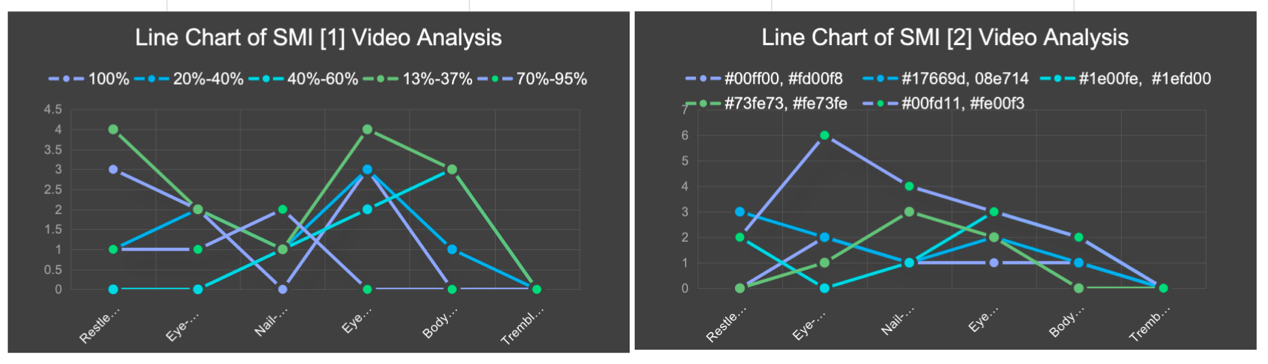
Figure 6. Two SMIs' Video Line Chart Analysis, including 31 participants' datas (Photo credit: Original).
According to the experiment recording videos, participants have different body language changes that indicate that their anxiety levels increase [8]. In 31 samples, 16 participants have restless leg movements with low attention rates, and significant alpha wave changes show that they tend to have high anxiety. Seven participants showed dry eyes when watching high-color contrasted rotating snakes. Also, when participants make multiple changes, their attention levels are relatively lower than when watching SMI pictures [9]. While watching the video, 23 participants had eyeball defocusing, and 15 of them had nail-biting, which means that their anxiety levels increased.
3.1.3. Questionnaire and interview analysis.
Table 3. Subject profile analysis.
name | Options | Frequency | Percentage (%) | Cumulative percentage (%) |
Your gender | female | 20 | 64.516 | 64.516 |
male | 11 | 35.484 | 100 | |
total | 31 | 100.000 | 100.000 | |
Your age | 17 | 6 | 19.355 | 19.355 |
18 | 6 | 19.355 | 38.71 | |
21 | 5 | 16.129 | 54.839 | |
22 | 3 | 9.677 | 64.516 | |
16 | 3 | 9.677 | 74.194 | |
23 | 2 | 6.452 | 80.645 | |
27 | 1 | 3.226 | 83.871 | |
30 | 1 | 3.226 | 87.097 | |
35 | 1 | 3.226 | 90.323 | |
20 | 1 | 3.226 | 93.548 | |
25 | 1 | 3.226 | 96.774 | |
19 | 1 | 3.226 | 100 | |
total | 31 | 100.000 | 100.000 | |
Your educational background | high school | 14 | 45.161 | 45.161 |
Undergraduate | 13 | 41.935 | 87.097 | |
master | 4 | 12.903 | 100 | |
total | 31 | 100.000 | 100.000 | |
Your astigmatism | 0-50 | 11 | 35.484 | 35.484 |
50-100 | 8 | 25.806 | 61.29 | |
100-150 | 7 | 22.581 | 83.871 | |
150-200 | 3 | 9.677 | 93.548 | |
200-250 | 2 | 6.452 | 100 | |
total | 31 | 100.000 | 100.000 | |
Your myopia degree | 200-250 | 7 | 22.581 | 22.581 |
300-350 | 4 | 12.903 | 35.484 | |
0-50 | 4 | 12.903 | 48.387 | |
400-450 | 4 | 12.903 | 61.29 | |
450-500 | 4 | 12.903 | 74.194 | |
50-100 | 3 | 9.677 | 83.871 | |
250-300 | 2 | 6.452 | 90.323 | |
350-400 | 2 | 6.452 | 96.774 | |
100-150 | 1 | 3.226 | 100 | |
total | 31 | 100.000 | 100.000 | |
Do you have eye discomfort or eye disease in your daily life? | no | 17 | 54.839 | 54.839 |
yes | 14 | 45.161 | 100 | |
total | 31 | 100.000 | 100.000 | |
Have you consumed caffeinated beverages frequently in the past week? | scarcely 2 | 11 | 35.484 | 35.484 |
not at all 1 | 8 | 25.806 | 61.29 | |
less 3 | 5 | 16.129 | 77.419 | |
every day 7 | 3 | 9.677 | 87.097 | |
more 5 | 2 | 6.452 | 93.548 | |
medium 4 | 1 | 3.226 | 96.774 | |
a lot of 6 | 1 | 3.226 | 100 | |
total | 31 | 100.000 | 100.000 | |
As show in the table 3 and table 4. In this study, we recruited 31 volunteers and let them participate in an online questionnaire. The sample included 20 women and 11 men. The sample included high school students (45%), undergraduates (42%), and masters (13%). Considering that the eye condition could be a variable affecting the experiment, we investigated the eye condition of the sample. We did not select samples with high myopia. Of the total samples, 13% had pre-myopia (0-50 degrees), and the rest, 87%, had low myopia (50-600 degrees). 60% of the samples had no or mild astigmatism, and the remaining 40% had moderate astigmatism [10]. 45% of the samples had eye disease or daily eye discomfort. The majority of the sample, 76%, did not regularly consume caffeinated beverages.
Table 4. Anxiety level measure (before experiment).
Variable Name | Sample size | Maximum | Minimum | average value | Standard Deviation | Median | variance | Kurtosis | Measure of Skewness | Coefficient of variation (CV) |
Have you felt stressed and anxious in the last week? | 31 | 7 | 1 | 3.806 | 1.515 | 4 | 2.295 | -0.286 | 0.351 | 0.398 |
Have you felt restless in the last week? | 31 | 7 | 1 | 3.161 | 1.753 | 3 | 3.073 | -0.485 | 0.451 | 0.555 |
Have you felt your heart beating fast in the past week? | 31 | 7 | 1 | 2.806 | 1.797 | 2 | 3.228 | 0.331 | 1.01 | 0.64 |
Did you feel during the last week that everything was fine and nothing bad was going to happen? | 31 | 7 | 1 | 4.097 | 1.739 | 4 | 3.024 | -0.954 | 0.167 | 0.424 |
Have you felt unable to control and stop worrying in the last week? | 31 | 7 | 1 | 3.419 | 1.785 | 3 | 3.185 | -1.264 | 0.141 | 0.522 |
Have you found it difficult to relax in the last week? | 31 | 7 | 1 | 3.419 | 1.608 | 3 | 2.585 | -0.603 | 0.233 | 0.47 |
Have you felt more irritable than usual in the last week? | 31 | 7 | 1 | 3.129 | 1.803 | 3 | 3.249 | -0.877 | 0.488 | 0.576 |
Have you felt tired or weak in the past week? | 31 | 7 | 1 | 4.161 | 1.393 | 4 | 1.94 | -0.285 | -0.307 | 0.335 |
Have you felt dizzy in the past week? | 31 | 6 | 1 | 2.548 | 1.567 | 2 | 2.456 | -0.222 | 0.877 | 0.615 |
Have you felt able to breathe easily and without obstruction in the past week? | 31 | 7 | 2 | 4.71 | 1.657 | 5 | 2.746 | -1.202 | -0.066 | 0.352 |
As show in the table 5. The Anxiety Scale used in this study refers to two Anxiety scales, Zung Self-Rating Anxiety Scale and General Anxiety Disorder 7. The minimum score is 1 and the maximum is 7. The graph above clearly show that most of the average value of those questions are around 3 to 4.
Table 5. Anxiety level scale (after experiment).
Variable Name | Sample size | Maximum | Minimum | average value | Standard Deviation | Median | variance | Kurtosis | Measure of Skewness | Coefficient of variation (CV) |
Do you feel nervous and anxious? | 31 | 6 | 1 | 3.032 | 1.581 | 3 | 2.499 | -0.85 | 0.485 | 0.521 |
Are you feeling restless? | 31 | 5 | 1 | 2.516 | 1.313 | 2 | 1.725 | -0.843 | 0.623 | 0.522 |
Do you feel your heart beating fast? | 31 | 5 | 1 | 2.871 | 1.455 | 3 | 2.116 | -1.451 | 0.1 | 0.507 |
Do you feel like everything is fine and nothing bad can happen? | 31 | 7 | 1 | 4.419 | 1.766 | 4 | 3.118 | -0.939 | -0.071 | 0.4 |
Do you feel like you can’t control and stop worrying? | 31 | 7 | 1 | 2.903 | 1.814 | 2 | 3.29 | -0.359 | 0.726 | 0.625 |
Do you find it difficult to relax? | 31 | 6 | 1 | 3.29 | 1.575 | 3 | 2.48 | -1.41 | -0.078 | 0.479 |
Are you feeling more irritable than usual? | 31 | 7 | 1 | 2.484 | 1.589 | 2 | 2.525 | 0.739 | 1.151 | 0.64 |
Do you feel tired or weak? | 31 | 5 | 1 | 3.194 | 1.447 | 3 | 2.095 | -1.323 | -0.149 | 0.453 |
Do you feel dizzy? | 31 | 7 | 1 | 3 | 1.77 | 3 | 3.133 | -0.297 | 0.655 | 0.59 |
Do you feel that you can breathe easily and without obstruction? | 31 | 7 | 1 | 3.645 | 2.009 | 4 | 4.037 | -1.207 | 0.181 | 0.551 |
The average value in this graph are relative lower than the value before experiment, most of them are around 2 to 3. The variance of the question “Do you feel that you can breathe easily and without obstruction?” is prominent. The possible reason is unclear description of options, error in subject understanding, and individual variation.
Option analysis.
In the experimental part of the study, participants were asked to record their choices with an iPad and Apple pencil while watching the video for the experiment. Ten questions were included in the video; participants were asked to choose the speed and direction of movement from a selection of options presented after the photo was displayed. The first five questions show five different pictures of the rotating snake illusion, and there are four options shown in Figure 1. The other five questions show five different pictures of the "ad lib" illusion, and three options were given (shown in Figure 1). We informed participants that they could skip the question if they did not feel any motion happening.
Table 6. Option Analysis.
name | Options | Frequency | Percentage (%) | Cumulative percentage (%) |
T1 | A | 10 | 32.258 | 32.258 |
E | 9 | 29.032 | 61.29 | |
C | 5 | 16.129 | 77.419 | |
D | 4 | 12.903 | 90.323 | |
B | 3 | 9.677 | 100 | |
total | 31 | 100.000 | 100.000 | |
2 | A | 20 | 64.516 | 64.516 |
E | 5 | 16.129 | 80.645 | |
C | 4 | 12.903 | 93.548 | |
B | 2 | 6.452 | 100 | |
total | 31 | 100.000 | 100.000 | |
3 | A | 14 | 45.161 | 45.161 |
C | 6 | 19.355 | 64.516 | |
E | 6 | 19.355 | 83.871 | |
B | 3 | 9.677 | 93.548 | |
D | 2 | 6.452 | 100 | |
total | 31 | 100.000 | 100.000 | |
4 | A | 15 | 48.387 | 48.387 |
E | 8 | 25.806 | 74.194 | |
B | 3 | 9.677 | 83.871 | |
D | 3 | 9.677 | 93.548 | |
C | 2 | 6.452 | 100 | |
total | 31 | 100.000 | 100.000 | |
5 | E | 18 | 58.065 | 58.065 |
B | 5 | 16.129 | 74.194 | |
A | 4 | 12.903 | 87.097 | |
D | 3 | 9.677 | 96.774 | |
C | 1 | 3.226 | 100 | |
total | 31 | 100.000 | 100.000 | |
6 | B | 29 | 93.548 | 93.548 |
C | 1 | 3.226 | 96.774 | |
A | 1 | 3.226 | 100 | |
total | 31 | 100.000 | 100.000 | |
7 | B | 23 | 74.194 | 74.194 |
C | 6 | 19.355 | 93.548 | |
A | 2 | 6.452 | 100 | |
total | 31 | 100.000 | 100.000 | |
8 | B | 20 | 64.516 | 64.516 |
C | 10 | 32.258 | 96.774 | |
A | 1 | 3.226 | 100 | |
total | 31 | 100.000 | 100.000 | |
9 | B | 26 | 83.871 | 83.871 |
C | 4 | 12.903 | 96.774 | |
A | 1 | 3.226 | 100 | |
total | 31 | 100.000 | 100.000 | |
10 | B | 24 | 77.419 | 77.419 |
C | 7 | 22.581 | 100 | |
total | 31 | 100.000 | 100.000 | |
As show in the table 6. In questions one through five, E represents the choice that no movement was observed. Theoretically, the motion observed in questions 1 to 5 should rotate to the right (option A or D), and the motion observed in questions 6 to 10 should shrink (option B). One or two questions are commonly answered without feeling any motion (Option E for the first five questions and Option C for the remaining question). This is also borne out by the frequency with which these options appear.
In summary, most of the subjects' choices were within the normal range, and the subjects' anxiety index changed after the experiment. Combining the specific choices and the anxiety scale data, people whose anxiety scores increased after the experiment were more likely to choose unusual options and not feel any motion many times.
3.2. Discussion comprehensive analysis from three perspectives
The conclusive results suggest that SMIs can elicit distinct anxiety responses and cognitive patterns, highlighting the potential impact of visual illusions on emotional well-being and cognitive functioning.
The results from the brain wave analysis, attention level fluctuations, and observational data suggest a clear correlation between exposure to spiral motion illusions and increased levels of anxiety. The significant changes in delta, low alpha, low beta, and theta waves during exposure periods indicate cognitive overload, stress, and anxiety. This is further supported by the participant's self-reported experiences of increased heart rate, dizziness, and general discomfort after viewing the SMIs.
Moreover, the participants' attention levels showed considerable volatility, with notable drops during periods of high anxiety and cognitive stress. This aligns with the expected psychological impact of SMIs, which are known to create a sense of motion from static images, potentially overwhelming the brain's processing capabilities and inducing stress and anxiety.
In summary, the anxiety of the subjects fluctuated greatly when watching SMI photos, and there were significant changes before and after. When they stopped looking at the photos, the subject's brain waves leveled off, and the body's motor performance temporarily stopped (such as the stagnation of shaking legs and the relaxation of hunching). At the same time, through the subjective information of the return visit, 22\31 subjects responded more to the photos of the Rotating Snakes Illusion but less to the photos of the Rotating Ad Lib. Within one to two hours of completing the experiment, five subjects reported walking with vertigo symptoms and mood swings (while not excluding other influencing factors). Two of the participants reported a slight decrease in sleep quality one day after the follow-up visit. From the perspective of option analysis, the standard deviation of photos with high-contrast Rotating Snakes is more significant, and the options of subjects with more colorful Rotating ad-lib also tend to be significantly different.
3.3. Validation and processing
Ethical standards are strictly observed at every research process step, from design to execution. We made sure that all participants signed an informed consent form before participating in the study. Special attention was paid to the protection of participants' privacy and data security. To lessen the influence of external factors, the experiment is processed in a controllable environment. We controlled factors such as light, sound, and temperature in the environment to ensure the environmental conditions were the same for all participants. In terms of the selection of the participants, we took a cautious approach. Individuals with pre-existing anxiety disorders or high myopia were excluded through questionnaires and interviews. We used sophisticated instruments to record participants' physiological and behavioral responses. Using electroencephalography (EEG) devices, we analyzed the brain wave activity of participants in detail while observing the motion illusion. We analyzed brain wave frequencies associated with perception and cognitive processing, such as alpha and beta waves. The researchers recorded the participants' non-verbal behaviors, such as facial expressions and body language, while watching SMIs.
4. Future Prospects
In future studies, we can use fMRI to go deeper and focus more on neuroscience, such as studying the MT and MST parts of people watching illusions. These regions play a crucial role in processing motion information, and we wanted to study their response during the perception of motion illusions using fMRI. Second, we can explore other types of SMI, such as static illusions or color-based illusions, to see if they have similar effects on anxiety levels. Third, we want to use VR technology from 3D models and study their effects in a more immersive environment. Based on the findings in the VR environment, therapeutic VR applications for anxiety management may be developed. These apps can simulate a relaxing environment or provide elements of cognitive behavioral therapy to help reduce anxiety levels.
5. Conclusion
This study aimed to explore the relationship between spiral motion illusions (SMIs) and anxiety levels, with contributions from all group members to various aspects of the project, including experiment design, data collection, analysis, and participant interactions. Yifei (Sophie) Hao, as the group leader, played a significant role in overseeing the project, creating the website, conducting modeling, and making experimental videos, among other tasks. Yuxuan (Yuki) Gui focused on creating visual stimuli, analyzing data, and ensuring ethical compliance through informed consent. Pengxu (Allen) Zhu contributed to image creation, experimental setup, data recording, and questionnaire design. Despite the comprehensive approach, several limitations were encountered, including potential biases due to experimental rewards, environmental inconsistencies, and the limitations of the TGAM device in accurately measuring brain waves. Additionally, the influence of the observer effect and technical limitations of the recording equipment may have introduced deviations in the results.
Future research should address the limitations identified in this study to enhance the accuracy and reliability of the findings. To mitigate the observer effect and environmental inconsistencies, stricter controls on the experimental environment and conditions should be implemented. Upgrading the experimental equipment, such as using fMRI instead of TGAM for more precise neural measurements, could significantly improve data accuracy. Additionally, reducing the time span of the experiment to a single day could help minimize external variables that might influence participant responses over an extended period. By refining these aspects, future studies could provide more robust insights into the relationship between SMIs and anxiety, potentially leading to better applications in psychological research and therapeutic interventions.
References
[1]. Feldborg M., Lee N. A., Hung K., Peng K., Sui J. Perceiving the Self and Emotions with an Anxious Mind: Evidence from an Implicit Perceptual Task. International Journal of Environmental Research and Public Health, 2021, 18(22): 12096. https://doi.org/10.3390/ ijerph182212096.
[2]. Kitaoka A., Ashida H. Retrieved March 28, 2022, from https://www.jstage.jst.go.jp/article/ vision/15/4/15_261/_pdf/-char/en.
[3]. Sharma N., Gedeon T. Objective measures, sensors and computational techniques for stress recognition and classification: A survey. Computer Methods and Programs in Biomedicine, 2012, 108(3): 1287–1301. https://doi.org/10.1016/j.cmpb.2012.07.003.
[4]. Zhu X., Huang Y., Wang X., Wang R. Emotion recognition based on brain-like multimodal hierarchical perception. Multimedia Tools and Applications, 2023, 1-19.
[5]. Sharma N., Gedeon T. Modeling observer stress for typical real environments. Expert Systems with Applications, 2014, 41(5): 2231–2238.
[6]. Dinges D. F., Rider R. L., Dorrian J., McGlinchey E. L., Rogers N. L., Cizman Z., Goldenstein S. K., Vogler C., Venkataraman S., Metaxas D. N. Optical Computer Recognition of Facial Expressions Associated with Stress Induced by Performance Demands. Ingentaconnect.com, 2024.
[7]. Wade N. J. A selective history of the study of visual motion aftereffects. Perception, 1994, 23(10): 1111-1134.
[8]. APA PsycNet. Optical computer recognition of facial expressions associated with stress induced by performance demands. Apa.org, 2024.
[9]. Andrievskaia P. The Influence of Stimulus Speed and Cognitive Factors on Cortical Responses to Vection-inducing Stimuli. Diss. Toronto Metropolitan University, 2023.
[10]. Geratowski L. Visual Anxiolytics: developing theory and design guidelines for abstract affective visualizations aimed at alleviating episodes of anxiety, 2020.
Cite this article
Gui,Y.;Hao,Y.;Zhu,P. (2024). A Study on the Relationship Between Spiral Motion Illusions and Anxiety Levels: A Comprehensive Analysis of Neural Activity and Visual Stimuli. Applied and Computational Engineering,103,220-232.
Data availability
The datasets used and/or analyzed during the current study will be available from the authors upon reasonable request.
Disclaimer/Publisher's Note
The statements, opinions and data contained in all publications are solely those of the individual author(s) and contributor(s) and not of EWA Publishing and/or the editor(s). EWA Publishing and/or the editor(s) disclaim responsibility for any injury to people or property resulting from any ideas, methods, instructions or products referred to in the content.
About volume
Volume title: Proceedings of the 2nd International Conference on Machine Learning and Automation
© 2024 by the author(s). Licensee EWA Publishing, Oxford, UK. This article is an open access article distributed under the terms and
conditions of the Creative Commons Attribution (CC BY) license. Authors who
publish this series agree to the following terms:
1. Authors retain copyright and grant the series right of first publication with the work simultaneously licensed under a Creative Commons
Attribution License that allows others to share the work with an acknowledgment of the work's authorship and initial publication in this
series.
2. Authors are able to enter into separate, additional contractual arrangements for the non-exclusive distribution of the series's published
version of the work (e.g., post it to an institutional repository or publish it in a book), with an acknowledgment of its initial
publication in this series.
3. Authors are permitted and encouraged to post their work online (e.g., in institutional repositories or on their website) prior to and
during the submission process, as it can lead to productive exchanges, as well as earlier and greater citation of published work (See
Open access policy for details).
References
[1]. Feldborg M., Lee N. A., Hung K., Peng K., Sui J. Perceiving the Self and Emotions with an Anxious Mind: Evidence from an Implicit Perceptual Task. International Journal of Environmental Research and Public Health, 2021, 18(22): 12096. https://doi.org/10.3390/ ijerph182212096.
[2]. Kitaoka A., Ashida H. Retrieved March 28, 2022, from https://www.jstage.jst.go.jp/article/ vision/15/4/15_261/_pdf/-char/en.
[3]. Sharma N., Gedeon T. Objective measures, sensors and computational techniques for stress recognition and classification: A survey. Computer Methods and Programs in Biomedicine, 2012, 108(3): 1287–1301. https://doi.org/10.1016/j.cmpb.2012.07.003.
[4]. Zhu X., Huang Y., Wang X., Wang R. Emotion recognition based on brain-like multimodal hierarchical perception. Multimedia Tools and Applications, 2023, 1-19.
[5]. Sharma N., Gedeon T. Modeling observer stress for typical real environments. Expert Systems with Applications, 2014, 41(5): 2231–2238.
[6]. Dinges D. F., Rider R. L., Dorrian J., McGlinchey E. L., Rogers N. L., Cizman Z., Goldenstein S. K., Vogler C., Venkataraman S., Metaxas D. N. Optical Computer Recognition of Facial Expressions Associated with Stress Induced by Performance Demands. Ingentaconnect.com, 2024.
[7]. Wade N. J. A selective history of the study of visual motion aftereffects. Perception, 1994, 23(10): 1111-1134.
[8]. APA PsycNet. Optical computer recognition of facial expressions associated with stress induced by performance demands. Apa.org, 2024.
[9]. Andrievskaia P. The Influence of Stimulus Speed and Cognitive Factors on Cortical Responses to Vection-inducing Stimuli. Diss. Toronto Metropolitan University, 2023.
[10]. Geratowski L. Visual Anxiolytics: developing theory and design guidelines for abstract affective visualizations aimed at alleviating episodes of anxiety, 2020.