


1. Introduction
As an important part of the modern entertainment industry, the game type, content and experience are constantly enriched and enhanced, and its market scale and influence grow year by year. In this paper, through data analysis, in-depth excavation of player behaviour, market demand and other information for game development and sales to provide a basis for decision-making, and through predictive analysis, to help enterprises better grasp the market dynamics and layout in advance, which can help enterprises to reasonably plan their resources, reduce the market risk, and improve their economic efficiency [1]. At the same time, it can also help enterprises better meet the needs of players and enhance user satisfaction.
In terms of market trends, scholars today are committed to predicting the future development of the video game market through historical data and the current market situation [2]. As an illustration, relevant reports point out that China's game market is steadily growing in terms of both revenue and user size, with mobile games becoming a major source of revenue. Such research helps industry players to formulate more effective market strategies. As for the research on user behaviour, scholars focus on players' motivations, preferences, participation styles and the impact of game experience. The players' favourite game genres and game platforms are selected. These studies help improve game design and enhance users’ experience [3,4].
Currently, KNeighborsRegressork (KNN), Random Forest, Support Vector Machine (SVM), Decision Tree and other research methods are commonly used to predict the market of video games globally. Vikas Ukani used the Random forest model to analyse the relationship between time and global sales in his article "Video Game Sales EDA, Visualizations, ML Models"; JuHyeon_ in his article "Video Game Sales EDA, Visualizations, ML Models". Video Game Sales EDA, Visualizations, ML Models", Vikas Ukani in his article "Video Game Sales EDA, Visualizations, ML Models" used a Random forest model to analyse the link between time and global sales; JuHyeon_ in his article "Video game sales EDA&ML Classification", JuHyeon_ used Decision Tree model to analyse the relationship between time and game type, and Yonatan Rabinovich compared the relationship between time and game type in his "Video games sales Yonatan Rabinovich in "Video games sales regression techniques" compares K-Nearest Neighbors, Linear Regression, and Decision Tree models and concludes that K-Nearest Neighbor is the best [5,6].
Based on the in-depth study of the above literature, this paper aims to provide a more effective and accurate predictive analysis of the future market of video games by using multiple models to predict. By selecting appropriate datasets from the Kaggle website, data analysis and data clarity are carried out, followed by data visualization, which links the prediction of the video game market with specifics such as game genres, game publishers, etc. Then the dataset is predicted and interpreted by multiple regression models, and the one with the best accuracy and interpretation ability is selected.
2. Data pre-processing and data cleaning
The dataset for this paper is video game sales data. The data was obtained from the Kaggle webpage (https://www.kaggle.com/datasets/gregorut/videogamesales). This dataset contains the sales data of video games released from 1980 to 2020, with 16598 observations and 11 fields. the specific dataset variables and contents are as follows Table 1.
Table 1. Data set variables and types
serial number | variable name | Specific measurements | typology |
1 | Name | Video Game Name | string (computer science) |
2 | Year | Year the video game was released | floating point type |
3 | Genre | Types or categories of video games | string (computer science) |
4 | Publisher | Companies responsible for publishing video games | string (computer science) |
5 | Platform | Gaming platforms where you can play video games | string (computer science) |
6 | NA_Sales | Video game sales in North America (in millions) | floating point type |
7 | EU_Sales | Sales of video games in Europe (in millions) | floating point type |
8 | JP_Sales | Video game sales in Japan (in millions) | floating point type |
9 | Other_Sales | Video game sales in other regions (in millions) | floating point type |
10 | Global_Sales | Total global sales of video games (in millions) | floating point type |
In this paper, by importing the data and then searching carefully, it is found that there are column fields that are useful and need not be deleted. In addition, the column fields are converted into Chinese form to increase readability. In the missing value processing process, we can find that the total number of rows of the data set is 16598, of which the total number of null values is 307, the year of issue and the issuer of missing values, due to the missing data for the non-numerical type, can not be used to the average, median and other data cleaning methods to make up for the percentage of 1.8%, so choose to delete the missing value, delete the missing value, there is no significant change in the overall after deleting the missing value 17,8t data type. There is no abnormal data in this dataset, so the outlier processing is not required [7,8]. Eventually, the cleaned data is exported to CSV format, which is convenient for visual analysis by Power BI [9,10].
3. Results
In this research, this paper uses several different models for prediction, namely Linear Regression, KNeighborsRegressor, Support Vector Machine, Random Forest Regression, and Neural Networks.
3.1. Linear regression model
In the linear regression model, the data points in Figure 1 are mainly clustered around a straight line, which indicates that there is a strong linear relationship between actual sales and predicted sales. This further confirms the effectiveness of the linear regression model in predicting sales. Although some data points show large errors, most data points have small deviations. This may be because of some external factors or outliers. In order to improve the prediction accuracy, one may consider correcting for these outliers or using a more sophisticated model for prediction.
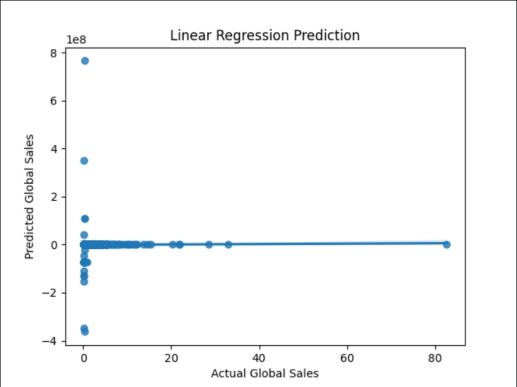
Figure 1. Linear regression model
3.2. A k-nearest neighbour regression model
As shown in Figure 2, in the k-nearest-neighbour regression model, the solid blue line runs through all the data points, showing a clear upward trend. This line represents the result of the regression analysis of the prediction model based on the data from the k nearest neighbours. It can be seen that as the predicted values increase, the actual sales have an increasing trend.
The dotted line represents the margin of error between the predicted and actual values. As can be seen from the figure, most of the data points are located on both sides of the dotted line, indicating that the difference between the predicted and actual values is relatively small. This further proves the accuracy and reliability of the K nearest neighbour regression model.
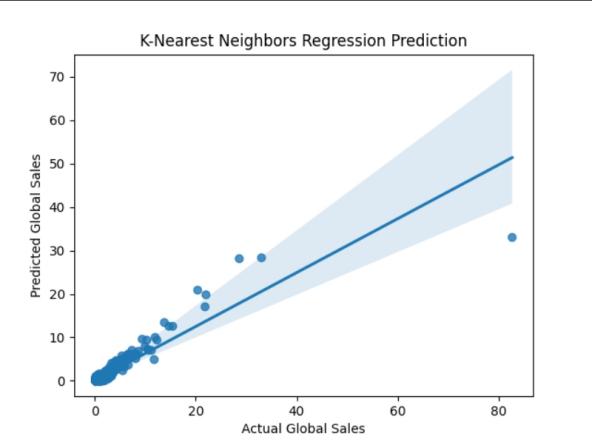
Figure 2. K-nearest neighbour regression model diagram
3.3. SVM
In the SVM model, Figure 3 shows how the SVM regression model improves its prediction accuracy as actual global sales increase. The blue dotted line represents the predicted value, while the light blue area represents the 95% confidence interval. It can be seen that as sales increase, the predicted values gradually approach the actual values, which indicates that the SVM regression model has a good fitting ability.
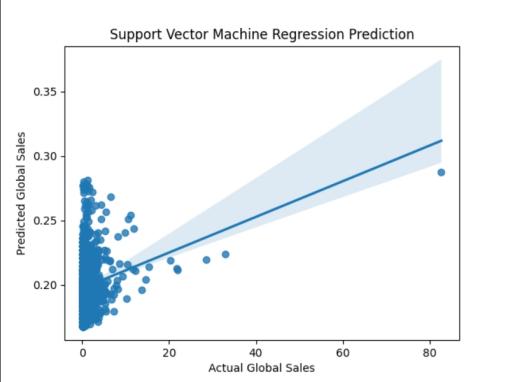
Figure 3. Support vector machine model
3.4. Random Forest Regression Model
Similar to SVM regression, the below graph shows the prediction accuracy of the Random Forest Regression Model improves as actual global sales increase (Figure 4). However, because Random Forest uses multiple decision trees for integrated learning, its predictions may be more accurate than a single SVM.
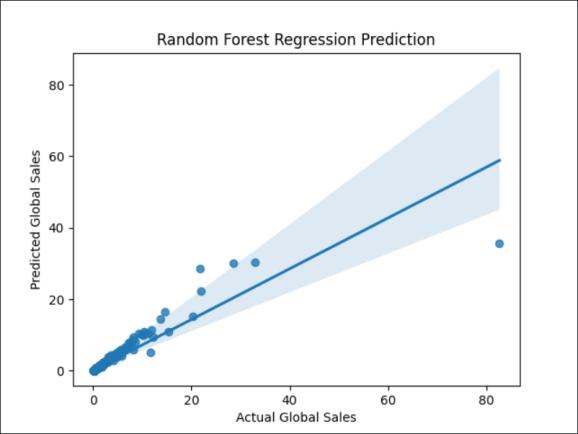
Figure 4. Random forest regression model
3.5. Decision Tree Regression Models
In the decision tree regression model, the predicted values are progressively closer to the actual values as the actual global sales increase (Figure 5). However, decision tree regression may not be as accurate as other models in interpreting forecasts.
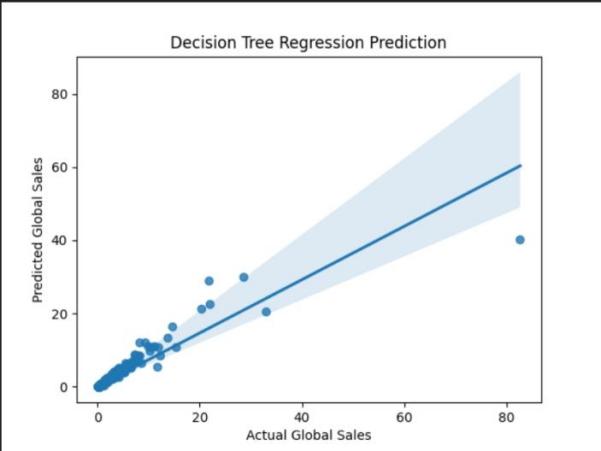
Figure 5. Decision tree regression model
3.6. Neural network prediction model
In the neural network forecasting model, a clear linear trend can be observed, i.e., as the actual global sales increase, the predicted global sales also increase. This indicates that the neural network model can capture the trend of sales better.
In Figure 6, it can be seen that there is a certain deviation between the predicted and actual values, but overall a better fit is presented.
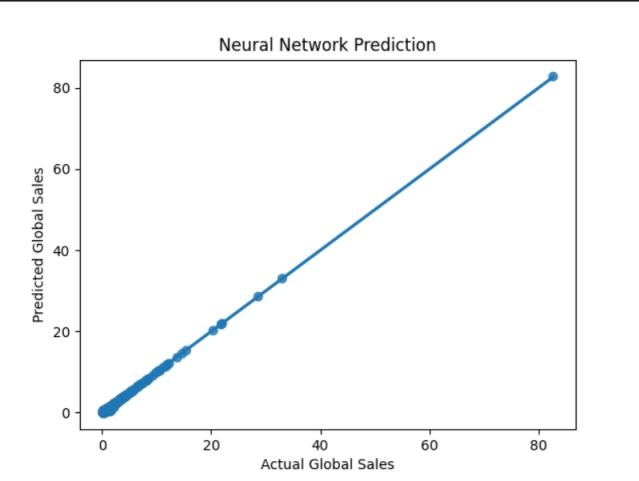
Figure 6. Neural network prediction model
4. Model comparison and analysis
This paper compares and analyses the results of the above models in terms of mean square error and R-squared. The linear regression model performs best in mean square error but has lower R-squared. The decision tree model has a higher mean square error but also a higher R-squared compared with linear regression. The Support Vector Machine model had a higher mean square error and R-squared, indicating that the model may be overfitting.
The K Nearest Neighbour model has a mean square error and R-squared close to zero, suggesting that the model may not fit the data well. The random forest model had the lowest mean square error but the highest R-squared, suggesting that the model may have good explanatory power. To summarize, the linear regression model performed best in terms of mean square error while the random forest model performed best in terms of R-squared. This implies that the linear regression model outperformed the other models in terms of predictive accuracy while the random forest model outperformed the other models in terms of explanatory power.
5. Conclusion
This paper uses a linear regression model for video game sales analysis and forecasting In conclusion, this EDA will help us gain insight into the video game sales dataset. By exploring the data and visualizing the relationships between different variables, we can understand patterns and trends in the gaming industry. In addition, building machine learning models will allow us to predict global sales with great features. The Video Game Sales dataset provides valuable information about video games, including their sales in different regions, genres, publishers, platforms, release years, and global sales. By exploring and analyzing this dataset, we could have a more profound understanding of patterns, trends and preferences in the gaming industry. Additionally, correlation heatmaps can help us identify the relationships between different variables and their impact on global sales. With machine learning models, we can predict global sales based on the available features to further our understanding of the factors that influence the sales of video games.
Authors Contribution
All the authors contributed equally and their names were listed in alphabetical order.
References
[1]. Lin Q Y 2021 Value assessment of video game enterprises based on Schwartz-Moon model (Jiangxi: Jiangxi University of Finance and Economics)
[2]. Wang R 2019 Research on the development and current situation of China's video game industry (Chengdu: Chengdu Information Engineering University)
[3]. Xinhua News 2002 U.S. video game products hot International Economic and Trade News 2002-03-07(004)
[4]. U.S. video game sales jump 16% in October 2021 China and Foreign Toy Manufacturing (12) p 75
[5]. Zhan K 2021 Research on the competitive strategy of R game company in China market (Guangzhou: Guangdong University of Technology)
[6]. Xu X Y and Wu K Z 2023 Global gamers to reach 3.2 billion by 2022. Release of version number revives industry confidence China Business News 2023-01-02(C04)
[7]. Zhou Z X 2022 A brief analysis of game industry based on automatic machine learning Computer Knowledge and Technology 18(24) pp 93–95
[8]. Wang T 2022 Exploration on the development of e-sports industry in China Foreign Trade and Economics (03) p 60–62
[9]. Zhou Z Y 2021 An analysis of the corporate environment and strategy of Nintendo of Japan Modern Enterprise (06) pp 183–184
[10]. Li H 2021 China's e-sports industry develops rapidly with annual output value reaching 140 billion yuan in 2020 Computer and Network 47(02) p 9
Cite this article
Li,X.;Liu,Z.;Xu,G. (2024). Video Games Market Forecast Based on Linear Regression Model. Applied and Computational Engineering,97,139-144.
Data availability
The datasets used and/or analyzed during the current study will be available from the authors upon reasonable request.
Disclaimer/Publisher's Note
The statements, opinions and data contained in all publications are solely those of the individual author(s) and contributor(s) and not of EWA Publishing and/or the editor(s). EWA Publishing and/or the editor(s) disclaim responsibility for any injury to people or property resulting from any ideas, methods, instructions or products referred to in the content.
About volume
Volume title: Proceedings of the 2nd International Conference on Machine Learning and Automation
© 2024 by the author(s). Licensee EWA Publishing, Oxford, UK. This article is an open access article distributed under the terms and
conditions of the Creative Commons Attribution (CC BY) license. Authors who
publish this series agree to the following terms:
1. Authors retain copyright and grant the series right of first publication with the work simultaneously licensed under a Creative Commons
Attribution License that allows others to share the work with an acknowledgment of the work's authorship and initial publication in this
series.
2. Authors are able to enter into separate, additional contractual arrangements for the non-exclusive distribution of the series's published
version of the work (e.g., post it to an institutional repository or publish it in a book), with an acknowledgment of its initial
publication in this series.
3. Authors are permitted and encouraged to post their work online (e.g., in institutional repositories or on their website) prior to and
during the submission process, as it can lead to productive exchanges, as well as earlier and greater citation of published work (See
Open access policy for details).
References
[1]. Lin Q Y 2021 Value assessment of video game enterprises based on Schwartz-Moon model (Jiangxi: Jiangxi University of Finance and Economics)
[2]. Wang R 2019 Research on the development and current situation of China's video game industry (Chengdu: Chengdu Information Engineering University)
[3]. Xinhua News 2002 U.S. video game products hot International Economic and Trade News 2002-03-07(004)
[4]. U.S. video game sales jump 16% in October 2021 China and Foreign Toy Manufacturing (12) p 75
[5]. Zhan K 2021 Research on the competitive strategy of R game company in China market (Guangzhou: Guangdong University of Technology)
[6]. Xu X Y and Wu K Z 2023 Global gamers to reach 3.2 billion by 2022. Release of version number revives industry confidence China Business News 2023-01-02(C04)
[7]. Zhou Z X 2022 A brief analysis of game industry based on automatic machine learning Computer Knowledge and Technology 18(24) pp 93–95
[8]. Wang T 2022 Exploration on the development of e-sports industry in China Foreign Trade and Economics (03) p 60–62
[9]. Zhou Z Y 2021 An analysis of the corporate environment and strategy of Nintendo of Japan Modern Enterprise (06) pp 183–184
[10]. Li H 2021 China's e-sports industry develops rapidly with annual output value reaching 140 billion yuan in 2020 Computer and Network 47(02) p 9