


1. Introduction
Employee turnover has become one of the most important problems in business management. Employees’ unexpected departure is blamed for the interruption of the work, which can further affect the normal progress of the project and exert a negative impact on team stability [1,2]. Moreover, unexpected staff departure may lead to hasty hiring, which can further increase the risk of employee and position mismatch. As a result, it remarkably increases training costs. Therefore, predicting whether some employees will leave the company has numerous advantages in reducing the cost of training and project delays by hiring new employees in advance, which can remarkably lower the duration of job vacancies.
Machine learning excels in processing large-scale data and complex structures. Machine learning has advantages in predicting employee turnover. For instance, Zhao et al. utilized 10 supervised machine learning methods, including a decision tree (DT) method, a random forest (RF) method, and a gradient boosting trees (GBT) method to predict employee turnover rates on datasets of varying scales [3-5]. However, the datasets of this paper are limited and the employee turnover rates of the datasets are low, occupying up to 28%, which makes classification more difficult. Zhang et al. constructed employee turnover characteristics with a data mining technology, which was prepared for training a logistic regression (LR) model [6]. The LR model predicted the employee turnover effectively as its accuracy reached 87.2%. While the features in this literature haven’t been further processed by feature engineering methods which are as significant as algorithms.
Not only have single machine learning skills been applied, but combined machine learning methods have also been proposed in this field. Karande and Shyamala built an ensemble learner model based on diverse machine learning algorithms on a dataset to predict employee turnover by giving the solution with the weighted average [7]. In this research, the ensemble learner model calculates weight average prediction by distributing different weights to individual machine learning models. This method overcomes the limitations of individual models and on the whole gets a better performance. Moreover, this paper uses four variables to present the classification performance, among which the ensemble learner model gains comparatively higher scores in most cases.
Besides combined methods, there are also some improved machine learning models utilized to address employee turnover prediction problems. Gao et al. proposed a weighted quadratic random forest algorithm, which had significant improvement in processing the employee turnover data with high-dimensional unbalanced characteristics [8]. The work is composed of selecting features efficiently and training the model by F-measure values, which are calculated for each decision tree as weights. Although there are many advantages to this model, its universality is a serious problem.
Sexton et al. provided a neural network solution by training an effective neural network model using a neural network simultaneous optimization algorithm (NNSOA) [9]. They discovered that comparatively higher accuracy of employee turnover prediction could be found in a 10-fold cross-validation experimental design. In this study, a comparison was made between the proposed model with models trained by genetic algorithm (GA) and backpropagation (BP) neural networks which proved the effectiveness of the model directly.
Apart from prediction models, there are also some feature selection methods which can improve the performance of the former. Cai et al. proposed a bipartite graph embedding method called dynamic bipartite graph embedding (DBGE) to incorporate temporal information embedded in consecutive work records into account [10]. Features obtained from DBGE can significantly improve turnover prediction performance of machine learning methods.
Although there are many researches applying different machine learning methods to predict employee turnover, the application of models combined with swarm intelligence algorithms such as particle swarm optimization (PSO) algorithm is not sufficiently diverse. As a result, it is of great significance to exploit the utilization of combined models in employee turnover prediction.
This paper aims to use a support vector machine (SVM) classifier trained on an employee information feature matrix with parameters optimized by improved PSO to predict whether an employee is likely to leave the company. Besides, the accuracy of the model would be calculated to prove the effectiveness.
2. Methods
2.1. Data
The dataset used in this project is a dataset in Kaggle named employee future prediction, which includes 4654 items of valid employee information.
This dataset includes various columns detailing education levels, years of service with the company, cities that employees are living in, salary levels, ages, genders, work statuses (including whether employees have been absent from projects for more than one month), experience in the current field, and results. All 9 variables are presented in Table 1.
Table 1: Different types of variables
Term | Type | Range |
Education level | Categorical | 0 for Bachelor, 1 for Master, 2 for PHD |
Joining year | Numeric | From 2012 to 2018 |
City | Categorical | 0 for Bangalore, 1 for Pune, 3 for New Delhi |
Salary level | Categorical | From 1 to 3 (1 is the highest level) |
Age | Numeric | 22 to 41 |
Gender | Categorical | 0 for male, 1 for Female |
Work status | Categorical | 0 for no, 1 for yes |
Experience in the current field (years) | Numeric | From 0 to 7 |
result | Categorical | 0 for not leave, 1 for leave |
2.2. Method
2.2.1. SVM
SVM is a supervised learning classifier which can divide nonlinear samples into two parts by mapping variables to a higher dimensional feature space, in which kernel functions play a crucial role. After processed by a kernel function, points that were inseparable in the past are transformed into separable ones as shown in Figure 1.
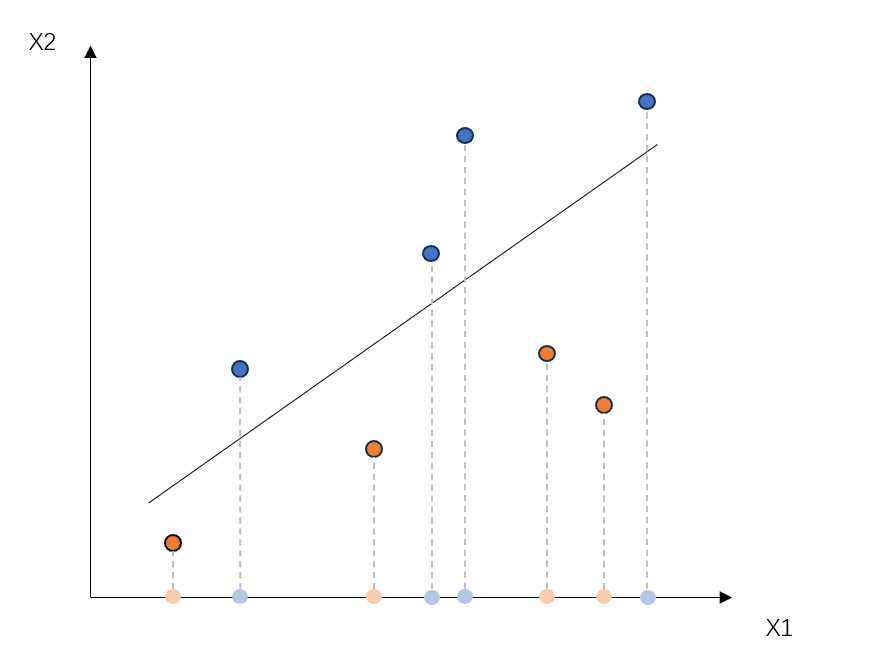
Figure 1: Hyperplane diagram
Therefore, the main purpose of SVM is to obtain a hyperplane that can separate the two parts to the greatest extent. To be more specific, the total distance from each point that has been classified in the higher dimensional feature space to the hyperplane should be minimized. Assuming there is a dataset \( \lbrace x, y\rbrace \) for SVM where \( x \) is a n-dimensional input vector and \( y \) is a dimensional target vector. The following equation shows the idea.
\( \begin{cases} \begin{array}{c} Minimize\frac{1}{2}{‖w‖^{2}} \\ |(wx+b)-y|≤ε \end{array} \end{cases} \) (1)
The \( w \) in the above equation is the weight vector and \( ε \) is the error-insensitive zone.
2.2.2. PSO-SVM Model
PSO is a swarm intelligence algorithm which can be utilized to select the best parameters of the SVM as shown in Figure 2. The best parameters would be found by setting the accuracy rate of the SVM on the test set as PSO fitness function. With particles approaching the best solution vector, the accuracy rate of the SVM reaches the peak, which means the best parameters are found simultaneously. The performance of SVM trained with the best parameters would be improved remarkably compared to the past.
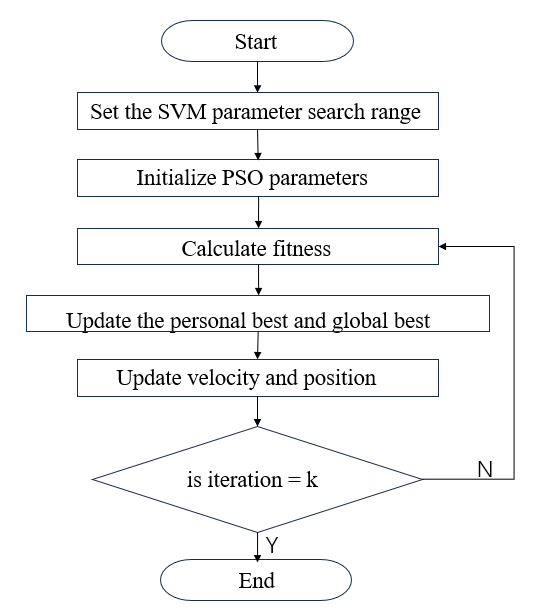
Figure 2: Flow chart of PSO-SVM
The kernel function of the SVM used in this study is the radial basis function (RBF). As a result, there are two parameters need to be selected, including the parameter of RBF and the error-insensitive zone.
3. Results and Discussion
3.1. Descriptive Analysis
Figure 3 is a heat map which establishes a mapping between correlations and colors. As shown in Figure 3, the correlation between 9 variables is intuitively represented within the range of 0 to 1. To be more specific, strong correlations that have higher absolute values are associated with deeper colors and conversely weak correlations are denoted by pale colors. Furthermore, the correlations can be divided into two parts including positive correlations and negative correlations which can be respectively represented by a range of color with a reddish hue and bluish hue.
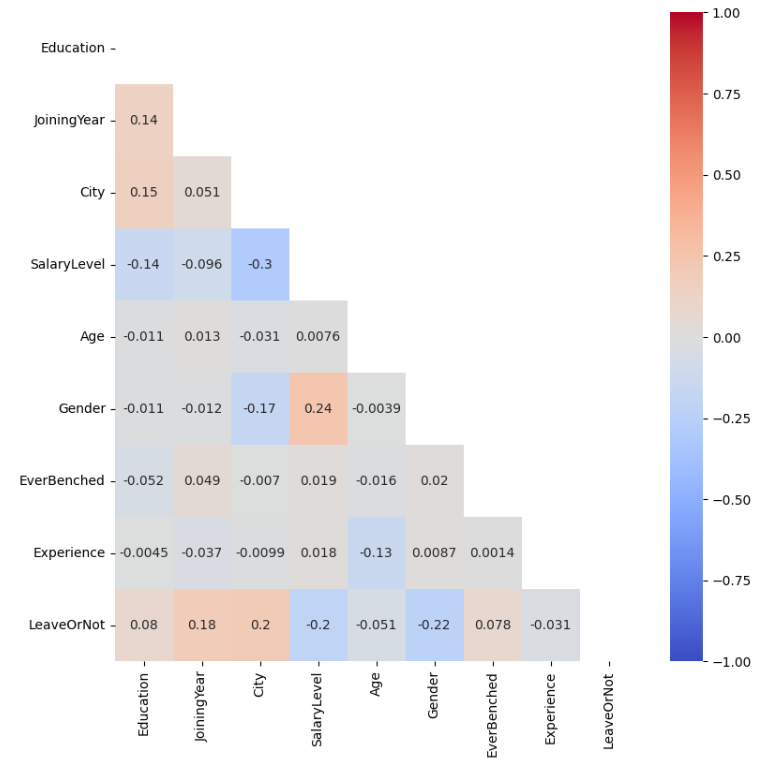
Figure 3: Heat map of correlation matrix
In Figure 3, the highest absolute value of correlation coefficients can be found in the gender column among correlations between the results and other columns, which reaches 0.22. Besides, experience in current field is weakly relevant to whether employees intend to leave the enterprise with the absolute value of correlation coefficient reaching to 0.031. Moreover, it can be seen that the correlation between employee turnover and other variables is not very strong. This means the data is not comprehensive enough to contain all the factors that affect employee departure.
3.2. PSO-SVM Results
By setting the accuracy rate of the SVM on the test set as PSO fitness function, the best parameters of SVM can be obtained from this optimization algorithm. The relationship between fitness function values and iterations is shown in Figure 4.
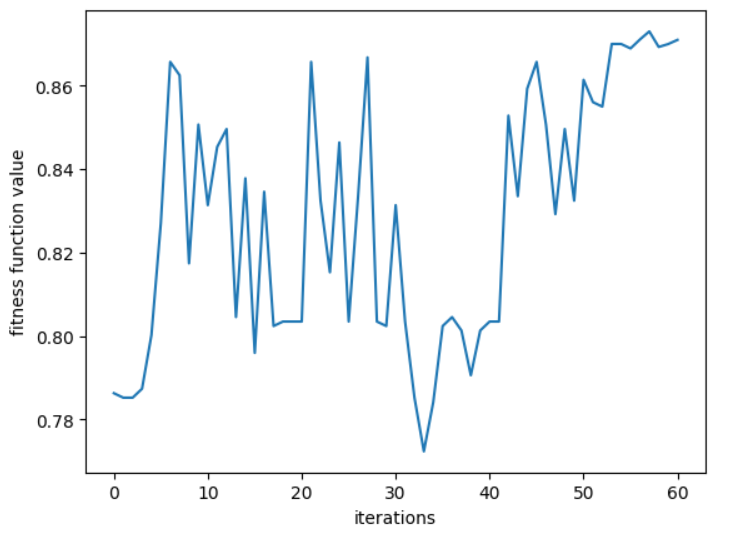
Figure 4: Fitness function curve
As shown in Figure 4, the horizontal coordinate is the number of iterations and the vertical coordinate is the highest fitness function values among all of particles in the current iteration. In the first half of the curve, there is a trend of significant fluctuations. This means particles have a stronger global search capability compared to the later period. Hence, comprehensive solutions can be found by them and the corresponding fitness function values appear to differ dramatically. When it comes to the second half, the curve can be roughly viewed as an increasing curve fluctuating slightly. Eventually, the values of fitness function tend to flatten out and approach the peak, which climbs to 0.87.
Table 2: Model results
Models | Accuracy score | Precision score | Recall score | F1 score |
PSO-SVM | 0.873 | 0.947 | 0.670 | 0.784 |
KNN (K=4) | 0.821 | 0.847 | 0.586 | 0.692 |
RF | 0.849 | 0.826 | 0.710 | 0.764 |
MLP | 0.869 | 0.906 | 0.692 | 0.784 |
AdaBoost | 0.814 | 0.830 | 0.579 | 0.683 |
The performance of PSO-SVM and other models is compared which is based on 4 scores, including accuracy score, precision score, recall score and F1 score. As shown in Table 2, it is obvious that PSO-SVM has the highest accuracy score and precision score, respectively reaching to 0.873 and 0.947. In contrast, the lowest accuracy score is gained by AdaBoost achieving 0.814 while the lowest precision score is obtained by RF attaining 0.826. This data indicates that employee turnover can be predicted more accurately by applying PSO-SVM and the employee who has been viewed as a departing person by the model is more likely to leave the company. However, PSO-SVM model gets a lower recall score which reaches 0.670 compared to RF and MLP which can lead to difficulty in finding potential departure of staff. This phenomenon suggests that more factors influencing employee turnover should be contained in the dataset. When it comes to F1 score which is derived from a combination of precision score and recall score, the highest score is gained by the PSO-SVM model and the MLP model achieving 0.784. On the contrary, AdaBoost model has the lowest F1 score reaching to 0.683. Overall, the PSO-SVM model performs the best on the employee turnover dataset in this study.
4. Conclusion
The insufficiency of applying swarm intelligence algorithms to resolve employee turnover prediction problem is alleviated by employing the model proposed in this study. In this paper, PSO algorithm is applied to improve the performance of SVM by optimizing parameter selection in order to predict employee turnover. After comparing with KNN, RF, MLP and AdaBoost models, it is concluded that PSO-SVM can be utilized to predict staff departure accurately which gets the highest score in accuracy score, precision score and F1 score respectively reaching to 0.873, 0.947 and 0.784. Although PSO-SVM gains a comparatively lower recall score only achieving 0.670, there is no doubt that it performs the best. This conclusion indicates that more swarm intelligence algorithms can be combined with traditional machine learning models to address the employee turnover prediction problem. In a further study, information of employees should be collected more comprehensively to contain more factors affecting employee departure. Moreover, this problem also can be solved by SVM integrated with other swarm intelligence algorithms.
References
[1]. Chang, H. Y. (2009, March). Employee turnover: a novel prediction solution with effective feature selection. In WSEAS International Conference. Proceedings. Mathematics and Computers in Science and Engineering (No. 3). World Scientific and Engineering Academy and Society.
[2]. O'Connell, M., & Kung, M. C. (2007). The cost of employee turnover. Industrial management, 49(1).
[3]. Tracey J B, Hinkin T R. The costs of employee turnover: When the devil is in the details. 2006.
[4]. Mohammed, A. M., Lai, Y., Daskalaki, M., & Saridakis, G. (2016). Employee turnover as a cost factor of organizations. In Research handbook on employee turnover (pp. 109-126). Edward Elgar Publishing.
[5]. Zhao, Y., Hryniewicki, M. K., Cheng, F., Fu, B., & Zhu, X. (2019). Employee turnover prediction with machine learning: A reliable approach. In Intelligent Systems and Applications: Proceedings of the 2018 Intelligent Systems Conference (IntelliSys) Volume 2 (pp. 737-758). Springer International Publishing.
[6]. Zhang, H., Xu, L., Cheng, X., Chao, K., & Zhao, X. (2018, September). Analysis and prediction of employee turnover characteristics based on machine learning. In 2018 18th International Symposium on Communications and Information Technologies (ISCIT) (pp. 371-376). IEEE.
[7]. Karande, S., & Shyamala, L. (2019). Prediction of employee turnover using ensemble learning. In Ambient communications and computer systems (pp. 319-327). Springer, Singapore.
[8]. Gao, X., Wen, J., & Zhang, C. (2019). An improved random forest algorithm for predicting employee turnover. Mathematical Problems in Engineering, 2019(1), 4140707.
[9]. Sexton, R. S., McMurtrey, S., Michalopoulos, J. O., & Smith, A. M. (2005). Employee turnover: a neural network solution. Computers & Operations Research, 32(10), 2635-2651.
[10]. Cai, X., Shang, J., Jin, Z., Liu, F., Qiang, B., Xie, W., & Zhao, L. (2020). DBGE: employee turnover prediction based on dynamic bipartite graph embedding. IEEE Access, 8, 10390-10402.
Cite this article
Yao,Y. (2024). Employee Turnover Prediction based on Particle Swarm Optimization - Support Vector Machine. Applied and Computational Engineering,112,1-7.
Data availability
The datasets used and/or analyzed during the current study will be available from the authors upon reasonable request.
Disclaimer/Publisher's Note
The statements, opinions and data contained in all publications are solely those of the individual author(s) and contributor(s) and not of EWA Publishing and/or the editor(s). EWA Publishing and/or the editor(s) disclaim responsibility for any injury to people or property resulting from any ideas, methods, instructions or products referred to in the content.
About volume
Volume title: Proceedings of the 5th International Conference on Signal Processing and Machine Learning
© 2024 by the author(s). Licensee EWA Publishing, Oxford, UK. This article is an open access article distributed under the terms and
conditions of the Creative Commons Attribution (CC BY) license. Authors who
publish this series agree to the following terms:
1. Authors retain copyright and grant the series right of first publication with the work simultaneously licensed under a Creative Commons
Attribution License that allows others to share the work with an acknowledgment of the work's authorship and initial publication in this
series.
2. Authors are able to enter into separate, additional contractual arrangements for the non-exclusive distribution of the series's published
version of the work (e.g., post it to an institutional repository or publish it in a book), with an acknowledgment of its initial
publication in this series.
3. Authors are permitted and encouraged to post their work online (e.g., in institutional repositories or on their website) prior to and
during the submission process, as it can lead to productive exchanges, as well as earlier and greater citation of published work (See
Open access policy for details).
References
[1]. Chang, H. Y. (2009, March). Employee turnover: a novel prediction solution with effective feature selection. In WSEAS International Conference. Proceedings. Mathematics and Computers in Science and Engineering (No. 3). World Scientific and Engineering Academy and Society.
[2]. O'Connell, M., & Kung, M. C. (2007). The cost of employee turnover. Industrial management, 49(1).
[3]. Tracey J B, Hinkin T R. The costs of employee turnover: When the devil is in the details. 2006.
[4]. Mohammed, A. M., Lai, Y., Daskalaki, M., & Saridakis, G. (2016). Employee turnover as a cost factor of organizations. In Research handbook on employee turnover (pp. 109-126). Edward Elgar Publishing.
[5]. Zhao, Y., Hryniewicki, M. K., Cheng, F., Fu, B., & Zhu, X. (2019). Employee turnover prediction with machine learning: A reliable approach. In Intelligent Systems and Applications: Proceedings of the 2018 Intelligent Systems Conference (IntelliSys) Volume 2 (pp. 737-758). Springer International Publishing.
[6]. Zhang, H., Xu, L., Cheng, X., Chao, K., & Zhao, X. (2018, September). Analysis and prediction of employee turnover characteristics based on machine learning. In 2018 18th International Symposium on Communications and Information Technologies (ISCIT) (pp. 371-376). IEEE.
[7]. Karande, S., & Shyamala, L. (2019). Prediction of employee turnover using ensemble learning. In Ambient communications and computer systems (pp. 319-327). Springer, Singapore.
[8]. Gao, X., Wen, J., & Zhang, C. (2019). An improved random forest algorithm for predicting employee turnover. Mathematical Problems in Engineering, 2019(1), 4140707.
[9]. Sexton, R. S., McMurtrey, S., Michalopoulos, J. O., & Smith, A. M. (2005). Employee turnover: a neural network solution. Computers & Operations Research, 32(10), 2635-2651.
[10]. Cai, X., Shang, J., Jin, Z., Liu, F., Qiang, B., Xie, W., & Zhao, L. (2020). DBGE: employee turnover prediction based on dynamic bipartite graph embedding. IEEE Access, 8, 10390-10402.