


1. Introduction
In physical education, how to effectively evaluate and improve students' comprehensive performance has always been the focus of research and practice. Traditional evaluation methods often rely on teachers' subjective judgment and simple record of achievements, and it is difficult to comprehensively and objectively reflect students' real ability and growth potential. With the rapid development of data science and artificial intelligence, quantitative analysis of sports performance by using machine learning technology has gradually become a new trend. Machine learning model can not only process multi-dimensional data, but also mine patterns hidden in features to support personalized teaching.
In baseball training, hitting, running and batting are the core elements to measure students' comprehensive performance. In view of these characteristics, this study collected students' performance data in the training process, and used a variety of regression models to predict and analyze, in order to explore the influence of these characteristics on students' comprehensive scores. Specifically, we choose K-Neighbors Regressor, Gradient Boosting Regressor, SVM and other machine learning models to compare their performance in regression prediction, and identify key influencing factors through feature importance analysis. In the experiment, the generalization ability of the model is also evaluated by K-fold cross-validation to ensure the stability and reliability of the prediction results.
This study not only evaluates the effectiveness of baseball training through data-driven methods, but also provides reference for how to optimize teaching methods. The results show that specific training indicators (such as cumulative hits and cumulative runs) have a significant impact on students' comprehensive scores, which provides data basis for further improving training plans. Through this study, we hope to provide a scientific evaluation framework for baseball and other physical education, and promote the development of personalized and data-driven physical education.
2. Literature Review
In recent years, the application of machine learning technology in sports analysis has attracted wide attention, especially in the field of baseball. Baseball has become an ideal scene for machine learning research because of its rich data and information. This paper refers to many research documents about the application of machine learning in baseball field, and sorts out the related research progress and achievements.
Hamilton et al. discussed the application of machine learning in baseball pitching prediction, aiming at predicting the possibility of pitching by analyzing pitching data and opponents' performance [1]. This study adopts a variety of machine learning algorithms, including support vector machine and random learning, which have potential in pitching prediction and strategy formulation, and provide assistant decision support for coaches and pitchers.
Koseler and Stephan conducted a systematic review on machine learning in baseball, highlighting applications like player performance prediction, game outcome forecasting, and stadium decision support [2]. They emphasized the potential of machine learning in uncovering trends to aid coaches and management, though traditional statistical methods still dominate in some areas. Karnuta et al [3]. further demonstrated machine learning's superiority over traditional regression in predicting player injuries, confirming its effectiveness in big data processing and pattern recognition, with great potential for player management and pre-season planning.
In the prediction of competition results, Huang and Li applied machine learning and deep learning technology to build a model for predicting competition results. Their research found that the deep learning model is complex to traditional methods, especially when the data characteristics are highly nonlinear. By inputting a large number of game data into the neural network model, this study predicts the game results, achieving high accuracy, which shows the broad prospects of deep learning in sports prediction [4].
Yaseen et al [5]. proposed a multi-modal machine learning method to predict playoff results in professional baseball, combining data sources like team and player performance, and historical game data. This study highlights the potential of multi-modal data fusion in sports prediction, suggesting a promising avenue for future research [6,7]. In conclusion, while challenges in data quality and feature engineering remain, machine learning's application in baseball—such as in game prediction, performance analysis, and injury forecasting—demonstrates significant practical value. Future advancements in deep learning and multimodal learning will further expand its role in decision support, strategy optimization, and player health management.
3. Data
3.1. Data introduction
The dataset reflects student performance in baseball training across key areas. Current Performance Data (e.g., AtBat, Hits) highlights semester strengths and weaknesses, while Cumulative Data (e.g., CHits, CRuns) provides insights into long-term skill progression. Defensive Performance (e.g., PutOuts, Assists, Errors) evaluates consistency in defense. The target variable, score, represents overall performance, helping identify key factors influencing outcomes. This comprehensive dataset supports machine learning analysis of offensive and defensive contributions, offering actionable insights to refine teaching strategies and improve student performance in baseball training.
3.2. Descriptive statistical analysis
The variable AtBat has a total of 322 observations. The mean value is 380.93, with a standard deviation of 153.41, indicating a moderate spread of values around the mean. The minimum value is 16, and the maximum is 687, suggesting that some students have very low and very high participation in training. The distribution is positively skewed, as shown by the increasing percentiles, with the 50th percentile (median) being 379.50. This suggests that half of the students have fewer than 380 at-bats, while the other half have more. The 99th percentile value is 658.59, which is close to the maximum, further supporting the presence of a few students with significantly higher training participation.
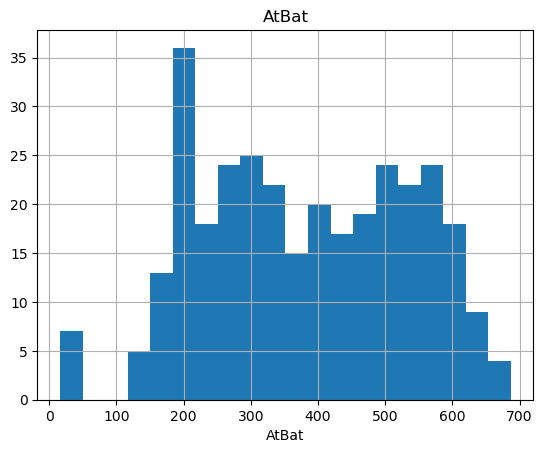
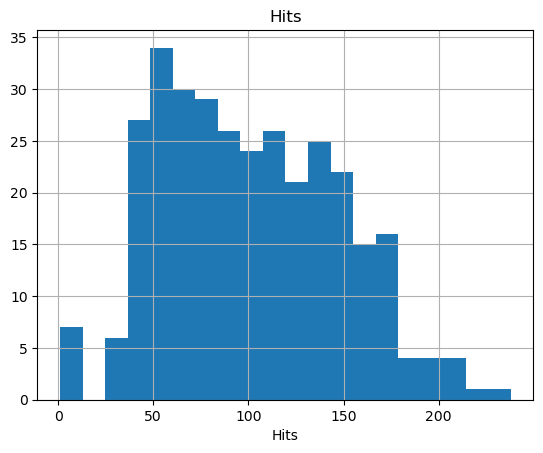
Figure 1: Statistical analysis of AtBat variable and Hits variable description
The variable Hits has 322 observations, with a mean value of 101.03 and a standard deviation of 46.46, indicating a moderate variation in the number of successful hits among students. The minimum value is 1, while the maximum value is 238, reflecting a wide range of performance. The distribution is slightly skewed towards higher values, as the percentiles increase gradually. For example, the median value (50th percentile) is 96, with 50% of the students having fewer than 96 hits and the other half having more. The 99th percentile value is 210.79, which is close to the maximum, highlighting a small group of students who perform significantly better than the majority.
4. Model analysis
4.1. Model Introduction
Support Vector Machine (SVM) is a supervised learning algorithm used for classification and regression. It finds the hyperplane that maximizes the margin between classes or minimizes errors in regression tasks, providing robust results, especially in high-dimensional spaces.
K-Neighbors Regressor relies on the k-nearest neighbors (KNN) algorithm, predicting values based on the average of the k closest data points. It is simple, interpretable, and effective for datasets with similar patterns.
Kernel Ridge Regression combines ridge regression and kernel methods to handle non-linear relationships by mapping data into a higher-dimensional space. It applies regularization to prevent overfitting, making it suitable for complex datasets.
Decision Tree Regressor splits data based on criteria at each node, predicting outcomes. It is easy to interpret but prone to overfitting without regularization.Random Forest Regressor is an ensemble method that aggregates predictions from multiple decision trees built on different data subsets, improving accuracy and reducing overfitting [8].Logistic Regression, primarily for classification, can be adapted for regression by estimating probabilities. It’s simple and interpretable, often used as a baseline model [9].
Gradient Boosting Regressor builds an ensemble of weak learners sequentially, improving accuracy by correcting previous errors, ideal for complex, non-linear data relationships [10].
4.2. Model results
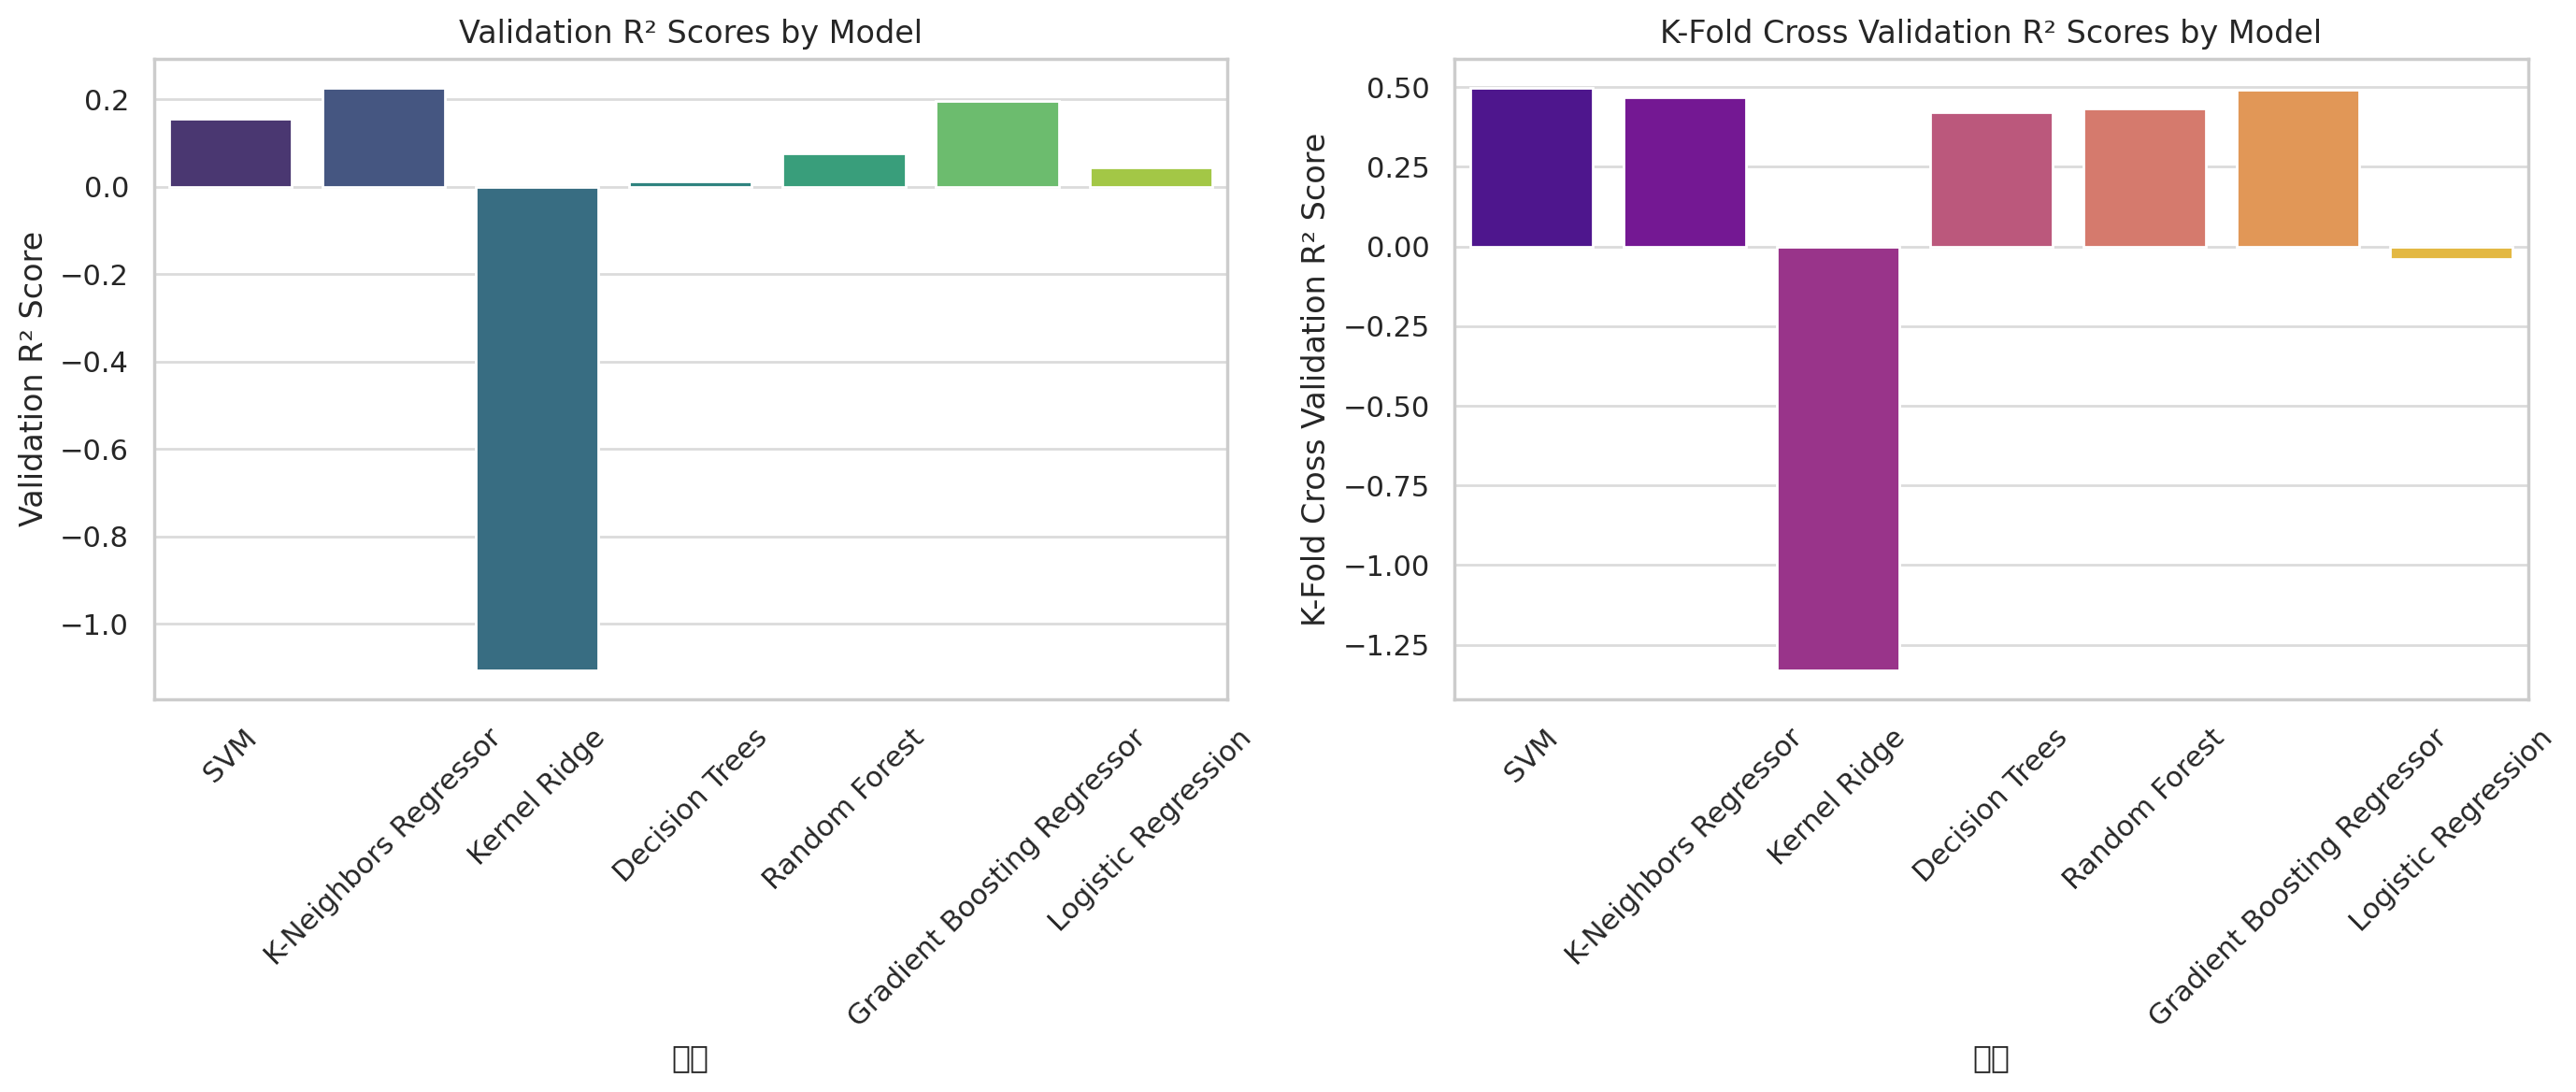
Figure 2: Validation R-squared results of each model
The K-Neighbors Regressor and Gradient Boosting Regressor performed well, with K-Neighbors achieving a 22.7% R score and Gradient Boosting showing a 19.75% R score, along with lower MAE and RMSE, indicating more accurate predictions. Gradient Boosting also scored high (49.20%) in K-fold cross-validation, demonstrating strong stability. SVM and Random Forest had lower verification R scores (15.6% and 7.67%, respectively), with SVM performing slightly better. However, both models showed higher MAE and RMSE, and although SVM’s K-fold cross-validation score was higher (49.81%), its accuracy still needs improvement.
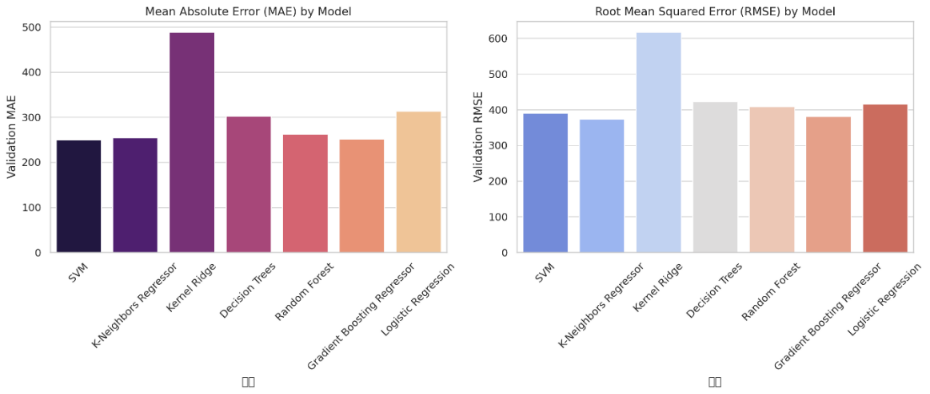
Figure 3: MAE and RMSE results of each model
Kernel Ridge and Decision Trees: Kernel Ridge performed poorly, the validation r was -110.59%, and the K-fold cross-validation score was also negative, which reflected their poor fitting effect on this data set. The validation r of Decision Trees is 1.32%, which is also not good, and the standard deviation in validation set and K-fold cross validation is large, indicating that its stability is insufficient.
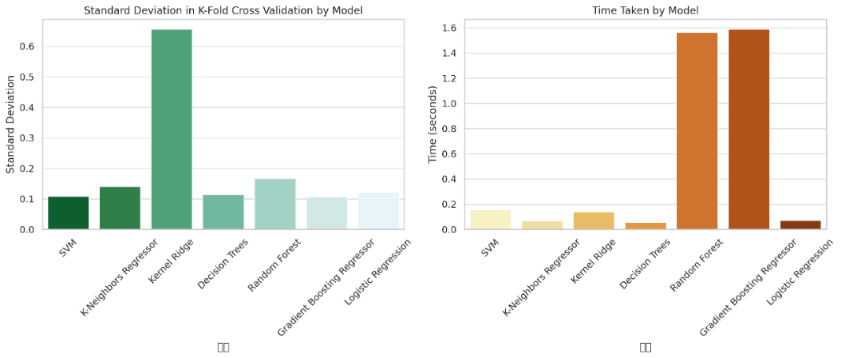
Figure 4: Standard deviation and time taken results of each model
Logistic Regression: Although Logistic Regression is usually used in classification tasks, it is mediocre in regression tasks, with a test R score of only 4.42% and a negative score in K-fold cross-test. Logistic Regression is not suitable for regression tasks, so its results are not good.
Generally speaking, K-Neighbors Regressor and Gradient Boosting Regressor have obtained higher R scores and lower MAE and RMSE on the verification set, which are the more recommended models in the current results.
4.3. Feature importance analysis
The feature importance analysis reveals the relative influence of each variable on predicting students' baseball performance. CHits (cumulative hits, importance 0.072) has the highest weight, indicating its crucial role in performance prediction. Higher cumulative hits reflect consistent batting skills, directly contributing to overall performance. CRuns (cumulative run times, importance 0.07), though slightly less important than CHits, highlights the significance of running ability, which is essential for scoring opportunities after a successful hit.
RBI (hit points, importance 0.058), measures students' contribution to team scoring. While not as important as the cumulative indicators, RBI is crucial for assessing students’ ability to perform under pressure and increase scoring efficiency. CRBI (cumulative hit points, importance 0.056), a long-term measure of students' scoring ability, underscores their consistency in helping teammates score over time, playing a key role in comprehensive performance.
CAtBat (cumulative at-bats, importance 0.053) has the lowest importance, but it still impacts performance. It indicates students' participation and experience in games, indirectly enhancing other features like CHits and RBI, which are essential for evaluating overall performance.
Overall, cumulative features (CHits, CRuns, CRBI, CAtBat) dominate the model, emphasizing the importance of students' long-term performance. These indicators provide a stable foundation for evaluating training effectiveness. The high importance of RBI and CRBI suggests that improving students' scoring ability at critical moments should be a focus for enhancing overall performance. By refining teaching methods based on these insights, educators can optimize training strategies to better support student development in baseball.
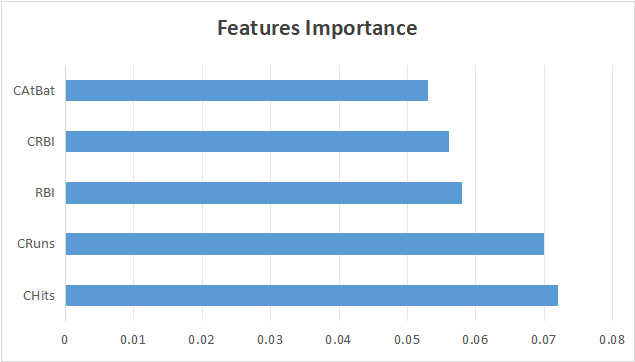
Figure 5: Feature importance analysis
5. Conclusions and Suggestions
5.1. Conclusions
This study applied machine learning models to predict students' comprehensive scores in baseball training and evaluate the effectiveness of current training methods. Among the models tested, Gradient Boosting Regressor emerged as the most robust, demonstrating high accuracy and stability, while K-Neighbors Regression and SVM also performed well. Feature importance analysis revealed that cumulative hits (CHits) and cumulative runs (CRuns) were the most significant predictors, highlighting the importance of long-term performance and scoring abilities. These findings emphasize that fostering students’ hitting and running skills is crucial for improving overall performance. Additionally, K-fold cross-validation confirmed the stability of the models across data partitions, and feature engineering processes, such as standardization and dimensionality reduction, further enhanced prediction accuracy by identifying critical patterns in the data. The study not only identifies key factors influencing baseball training outcomes but also provides valuable data support for optimizing training methods.
To improve student performance, training should prioritize hitting accuracy by focusing on hand-eye coordination and timing to maximize scoring opportunities. Equally important is enhancing running skills, such as speed, reaction time, and route judgment, to transition effectively from hitting to scoring. Scoring ability at critical moments can be cultivated by simulating high-pressure game scenarios, helping students make accurate judgments and stable plays. Increasing opportunities for practical experience, particularly for beginners, can further refine skills and build adaptability. Personalized feedback based on model insights is essential, allowing students to understand their strengths and weaknesses while setting targeted improvement goals. By aligning training with these findings, educators can enhance both individual and team performance, advancing the overall effectiveness of baseball education.
References
[1]. Hamilton M, Hoang P, Layne L, et al. Applying Machine Learning Techniques to Baseball Pitch Prediction[C]//ICPRAM. 2014: 520-527.
[2]. Koseler K, Stephan M. Machine learning applications in baseball: A systematic literature review[J]. Applied Artificial Intelligence, 2017, 31(9-10): 745-763.
[3]. Karnuta J M, Luu B C, Haeberle H S, et al. Machine learning outperforms regression analysis to predict next-season Major League Baseball player injuries: epidemiology and validation of 13,982 player-years from performance and injury profile trends, 2000-2017[J]. Orthopaedic journal of sports medicine, 2020, 8(11): 2325967120963046.
[4]. Huang M L, Li Y Z. Use of machine learning and deep learning to predict the outcomes of major league baseball matches[J]. Applied Sciences, 2021, 11(10): 4499.
[5]. Yaseen A S, Marhoon A F, Saleem S A. Multimodal machine learning for major league baseball playoff prediction[J]. Informatica, 2022, 46(6).
[6]. Song Y Y, Ying L U. Decision tree methods: applications for classification and prediction[J]. Shanghai archives of psychiatry, 2015, 27(2): 130.
[7]. Guo G, Wang H, Bell D, et al. KNN model-based approach in classification[C]//On The Move to Meaningful Internet Systems 2003: CoopIS, DOA, and ODBASE: OTM Confederated International Conferences, CoopIS, DOA, and ODBASE 2003, Catania, Sicily, Italy, November 3-7, 2003. Proceedings. Springer Berlin Heidelberg, 2003: 986-996.
[8]. Breiman L. Random forests[J]. Machine learning, 2001, 45: 5-32.
[9]. LaValley M P. Logistic regression[J]. Circulation, 2008, 117(18): 2395-2399.
[10]. Friedman J H. Greedy function approximation: a gradient boosting machine[J]. Annals of statistics, 2001: 1189-1232.
Cite this article
Sun,S.;Yuan,J.;Yang,Y. (2024). Research on Effectiveness Evaluation and Optimization of Baseball Teaching Method Based on Machine Learning. Applied and Computational Engineering,115,16-22.
Data availability
The datasets used and/or analyzed during the current study will be available from the authors upon reasonable request.
Disclaimer/Publisher's Note
The statements, opinions and data contained in all publications are solely those of the individual author(s) and contributor(s) and not of EWA Publishing and/or the editor(s). EWA Publishing and/or the editor(s) disclaim responsibility for any injury to people or property resulting from any ideas, methods, instructions or products referred to in the content.
About volume
Volume title: Proceedings of the 5th International Conference on Signal Processing and Machine Learning
© 2024 by the author(s). Licensee EWA Publishing, Oxford, UK. This article is an open access article distributed under the terms and
conditions of the Creative Commons Attribution (CC BY) license. Authors who
publish this series agree to the following terms:
1. Authors retain copyright and grant the series right of first publication with the work simultaneously licensed under a Creative Commons
Attribution License that allows others to share the work with an acknowledgment of the work's authorship and initial publication in this
series.
2. Authors are able to enter into separate, additional contractual arrangements for the non-exclusive distribution of the series's published
version of the work (e.g., post it to an institutional repository or publish it in a book), with an acknowledgment of its initial
publication in this series.
3. Authors are permitted and encouraged to post their work online (e.g., in institutional repositories or on their website) prior to and
during the submission process, as it can lead to productive exchanges, as well as earlier and greater citation of published work (See
Open access policy for details).
References
[1]. Hamilton M, Hoang P, Layne L, et al. Applying Machine Learning Techniques to Baseball Pitch Prediction[C]//ICPRAM. 2014: 520-527.
[2]. Koseler K, Stephan M. Machine learning applications in baseball: A systematic literature review[J]. Applied Artificial Intelligence, 2017, 31(9-10): 745-763.
[3]. Karnuta J M, Luu B C, Haeberle H S, et al. Machine learning outperforms regression analysis to predict next-season Major League Baseball player injuries: epidemiology and validation of 13,982 player-years from performance and injury profile trends, 2000-2017[J]. Orthopaedic journal of sports medicine, 2020, 8(11): 2325967120963046.
[4]. Huang M L, Li Y Z. Use of machine learning and deep learning to predict the outcomes of major league baseball matches[J]. Applied Sciences, 2021, 11(10): 4499.
[5]. Yaseen A S, Marhoon A F, Saleem S A. Multimodal machine learning for major league baseball playoff prediction[J]. Informatica, 2022, 46(6).
[6]. Song Y Y, Ying L U. Decision tree methods: applications for classification and prediction[J]. Shanghai archives of psychiatry, 2015, 27(2): 130.
[7]. Guo G, Wang H, Bell D, et al. KNN model-based approach in classification[C]//On The Move to Meaningful Internet Systems 2003: CoopIS, DOA, and ODBASE: OTM Confederated International Conferences, CoopIS, DOA, and ODBASE 2003, Catania, Sicily, Italy, November 3-7, 2003. Proceedings. Springer Berlin Heidelberg, 2003: 986-996.
[8]. Breiman L. Random forests[J]. Machine learning, 2001, 45: 5-32.
[9]. LaValley M P. Logistic regression[J]. Circulation, 2008, 117(18): 2395-2399.
[10]. Friedman J H. Greedy function approximation: a gradient boosting machine[J]. Annals of statistics, 2001: 1189-1232.